- CNY Swaps are the 9th most traded interest rate swap at CCPs.
- The market is quite standardised, with 90% of volumes in just three tenors.
- Clearing is split between Shanghai Clearing and LCH SwapClear.
- 60% of the market is now cleared.
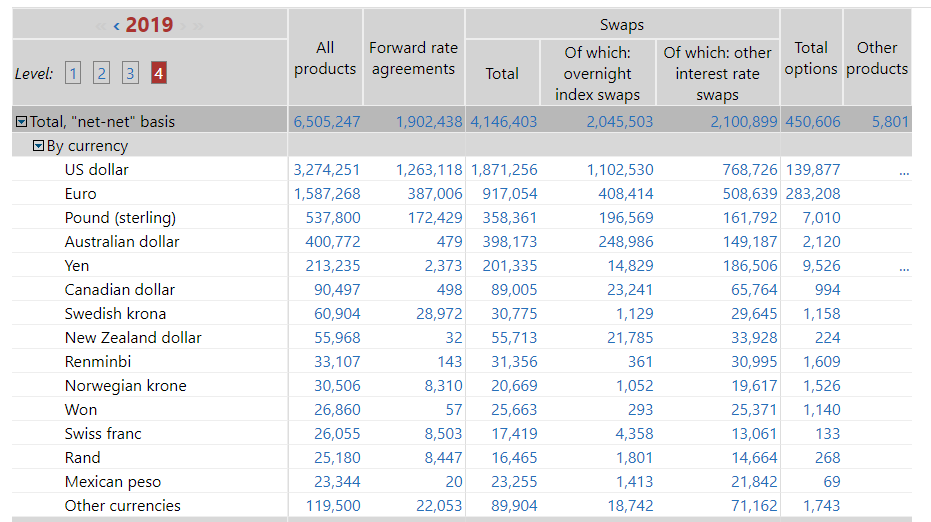
When I took a look at trends in 2019 for swaps market data, I found that CNY swaps were the 9th most traded currency in cleared Interest Rate Derivatives.
From CCPView;
Showing;
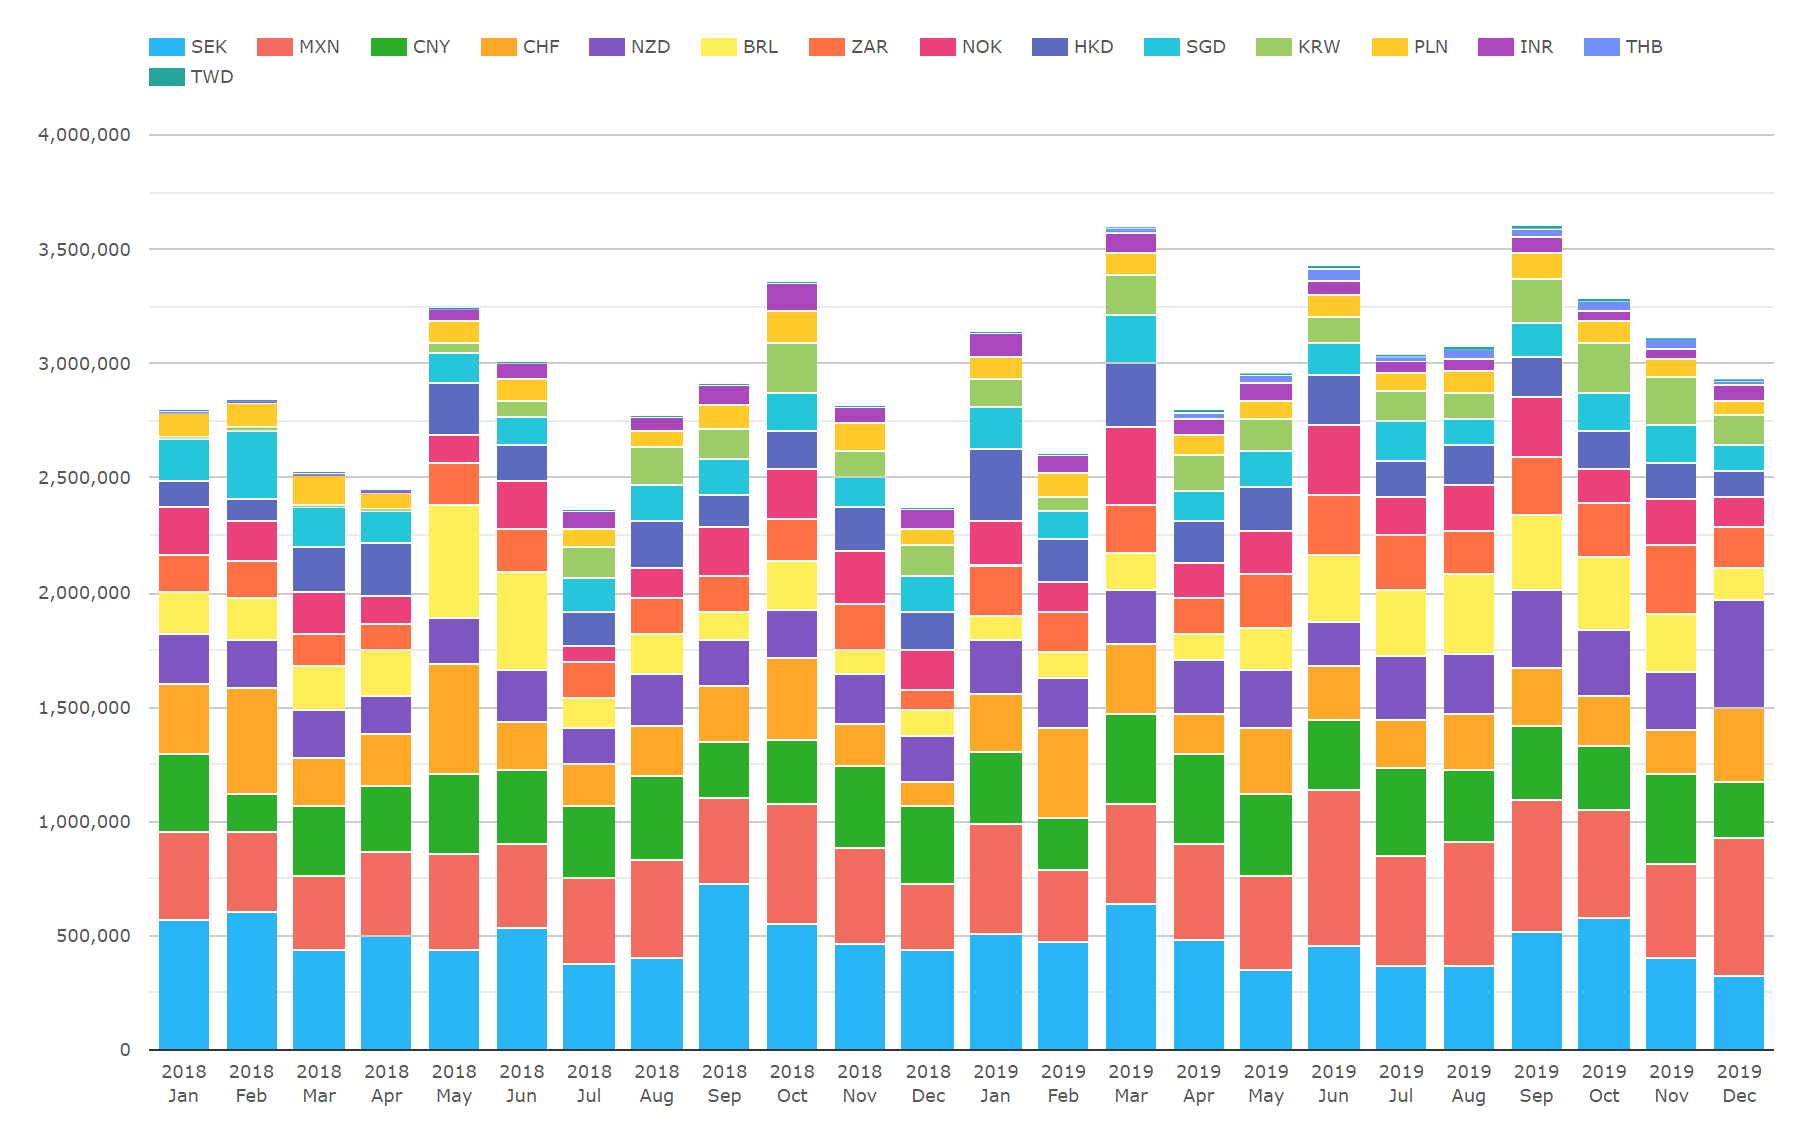
- Volumes in Cleared Interest Rate Derivatives from CCPView.
- The chart excludes the top six currencies by volumes (USD, EUR, GBP, JPY, AUD and CAD). These six currencies represented over 95% of total cleared volumes (see Four Trends in Swaps Data).
- For the volumes displayed on the chart (not total cleared volumes), SEK represents 16% and MXN 15%.
- The next largest over the last two years were CNY at 11% and CHF at 9%.
I know very little about CNY swaps, so given the high volumes I thought I should educate myself beyond the fact that CNY swaps are pretty much as large as CHF, which has a relatively developed (if persistently difficult to trade!) swap market.
60%/40% CCP Market Shares
Somewhat unusually, we see a consistent market share split among two CCPs for CNY swaps:
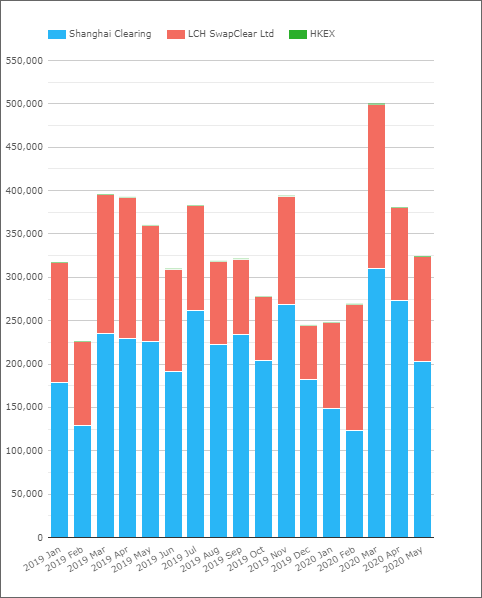
Showing;
- In 2020, Shangahi Clearing have had a 60% market share of CNY Swap Clearing.
- LCH SwapClear accounts for the other 40%.
- In February 2020, LCH did see 54% of volumes cleared. However, this was unusual, with the longer run average closer to 35% market share.
- Whilst LCH only offer Non Deliverable CNY Swaps, it therefore would make sense for Shanghai Clearing to represent the onshore market. Is that fair? Let us know in the comments below.
- Total volumes passed $0.5trn ($500bn) for the first time in March 2020.
60% of CNY Volumes are Cleared
There remains a relatively large uncleared portion of the market.
From SDRView;
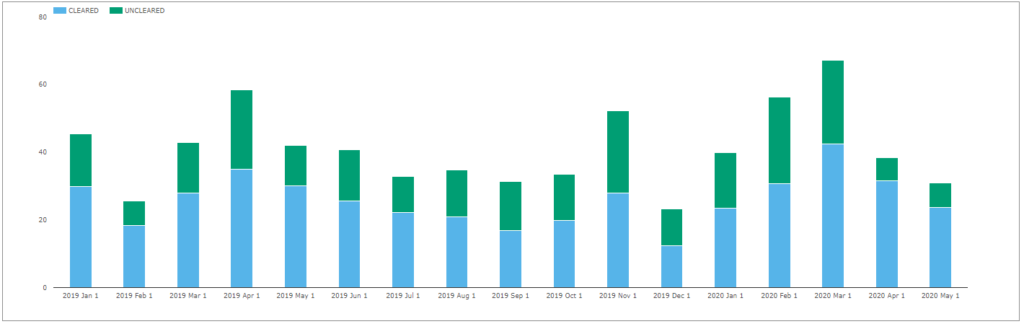
Showing;
- Total Cleared volumes are much larger than those reported to SDRs. SDR volumes make-up less than 10% of total Cleared volumes.
- Total volumes reported to SDRs each month average about $40bn.
- The proportion that is cleared by US Persons varies quite dramatically month-on-month. It ranges from ~50-80%.
- Since 2019, 63% of volume has been cleared.
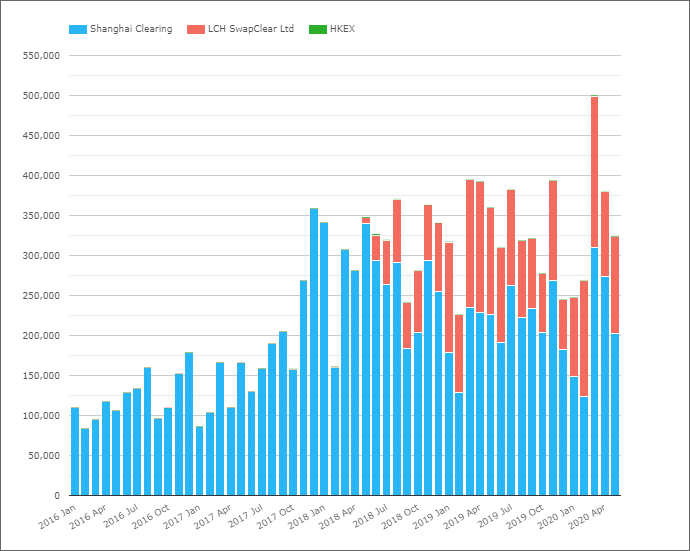
On that last point, there was no clearing of CNY reported to SDRs prior to May 2018. Given that CCPView has history for Shanghai Clearing going all the way back to at least 2016, this suggests that only LCH volumes are being reported/reported as Cleared in the SDRs:
It is an interesting question for SDR data, however. Is the trade only marked as Cleared if the DCO is on the CFTC list of DCOs? If anyone knows the answer, please comment below.
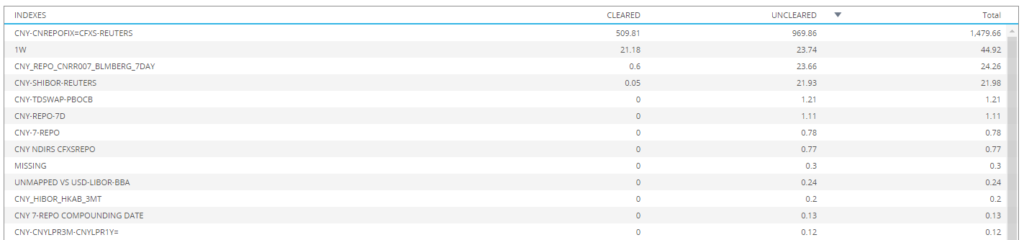
Most CNY Swaps are versus CNREPOFIX
There are a lot of different CNY indices reported to the US SDRs. Consistent with our assumption that all Cleared swaps are at LCH in the SDR, virtually all cleared swaps are reported versus the “CNREPOFIX=CFXS-Reuters” index.
However, we also see CNY SHIBOR and CNY Repo in the mix – albeit small:
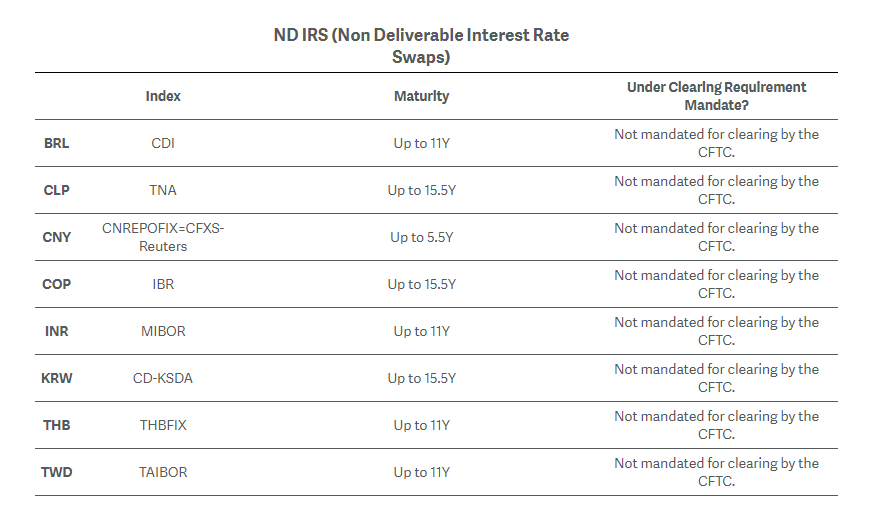
Risk is Concentrated in Benchmark Tenors
LCH provide clearing of CNY out to 5 and a half years:
Looking at SDR Tenor data, we can see that CNY does not typically trade longer than 5 years:
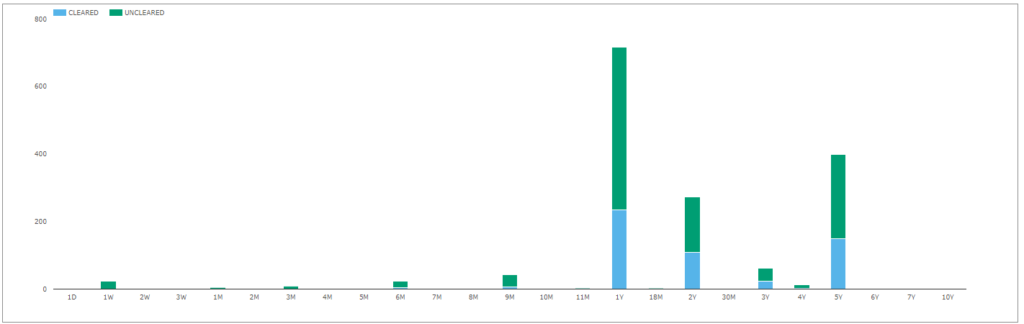
Showing:
- The longest trade reported had a 7 year tenor.
- Volumes are hugely concentrated in 3 benchmark tenors – 1Y, 2Y and 5Y.
- 88% of the total risk has been traded in these three tenors.
There used to be a CNY OIS Market
According to SDR data, about $2.5bn of uncleared OIS trades were transacted by US Persons back in 2014-15, each month. They were traded versus the CNY-SHIBOR index.
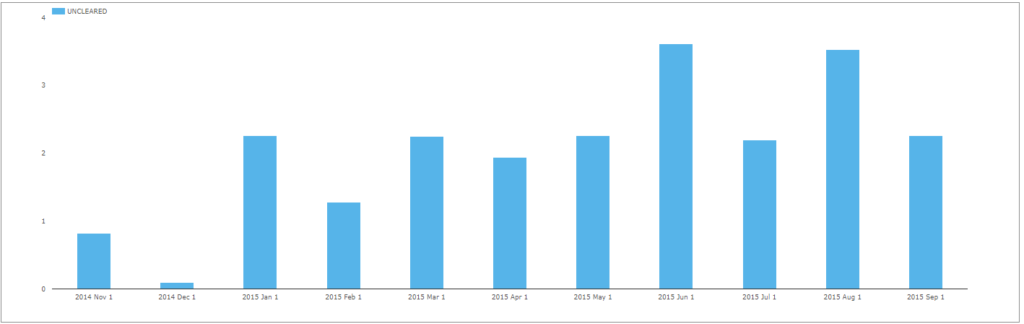
However, this activity has now disappeared. There has been no OIS reported since 2019 certainly.
With SDR data only covering the US Persons market, I therefore referred to the BIS data to see whether there was still an OIS market in CNY. The April 2019 Triennial survey shows $361m per day in CNY OIS transacted:
Overall Market Size
Using the BIS data to calibrate versus our CCPView data for April 2019:
- April 2019 saw ~$400bn cleared in the whole month.
- This equates to approximately $18bn ADV.
- The BIS reported an ADV of $31bn for IRS alone.
- This suggests that ~60% of the market is cleared, entirely consistent with our SDR data.
- The OIS market, at $361m per day, would equate to $8bn per month. I’m surprised that we don’t see any of this at all in SDR data.
98%+ of Trades Are Executed off-SEF
Finally, our data suggests that there isn’t really a SEF market for CNY;
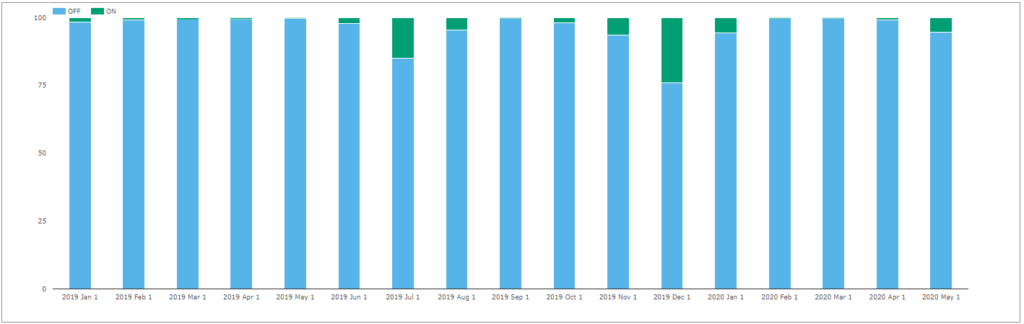
Showing;
- SEF trading has not taken hold in CNY swaps.
- SEFView does show some months have had over $10bn executed on-SEF, but this is very unusual.
- On the whole, SEF trading for CNY is insignificant.
In Summary
- CNY swaps are an important market in Interest Rate Derivatives.
- 60% of the market is now cleared.
- There is a 60/40 split between Shanghai Clearing and LCH for CCP market share in CNY swaps.
- The data suggests there are on-shore and off-shore cleared markets.
- Volumes are concentrated in benchmark tenors, 1Y, 2Y and 5Y.
It is an interesting question for SDR data, however. Is the trade only marked as Cleared if the DCO is on the CFTC list of DCOs? If anyone knows the answer, please comment below.
No, cleared flag true is independent of whether the CCP is a DCO. What you maybe observing is that US persons are only using a DCO? If this is the case they’d be one and the same thing…
Thanks Kirston. Yes, think it’s another structural facet of the SDR reporting – we only see LCH cleared CNY I think. Makes MIFID data interesting for this as well – would we finally see onshore CNY in European data I wonder….?