This post looks at USD swaptions activity in Q1 as part of our regular quarterly coverage, the last of which was Swaption Volumes by Strike Q4 2024.
Swaptions basics
If you are uninitiated in swaptions, here are some basics:
- A swaption is an option on an interest rate swap (IRS) for which the buyer pays the seller a premium to be able to exercise the option and get into the swap.
- The underlying swap is often a very vanilla cleared swap (a SOFR OIS if USD) with a specified whole number of years’ term or “tail”.
- A swaption may be either “physical exercise”, meaning exercise results in the two parties executing the underlying swap. Or “cash exercise”, meaning the two parties settle cash to one another equivalent to the current value of the underlying swap. USD swaptions are usually “cash exercise”.
- The effective date and end date of a swaption set the period during which it can be exercised. The term of the underlying swap or “tail” is defined separately.
- Most swaptions are “European” meaning they can be exercised only on the maturity date. American options can be exercised on any date in the period. Bermudan options can only be exercised on a discrete set of dates specified.
- A swaption will be a receiver (or payer) swaption if the buyer would receive (or pay) fixed rate interest and pay (or receive) floating interest in the underlying swap.
- A straddle is a pair of receiver and payer swaptions with the same expiry, tail, and strike.
Now, on to the post.
Swap market context
Q1 2025 saw the following daily price moves and activity in 10-year SOFR swaps:
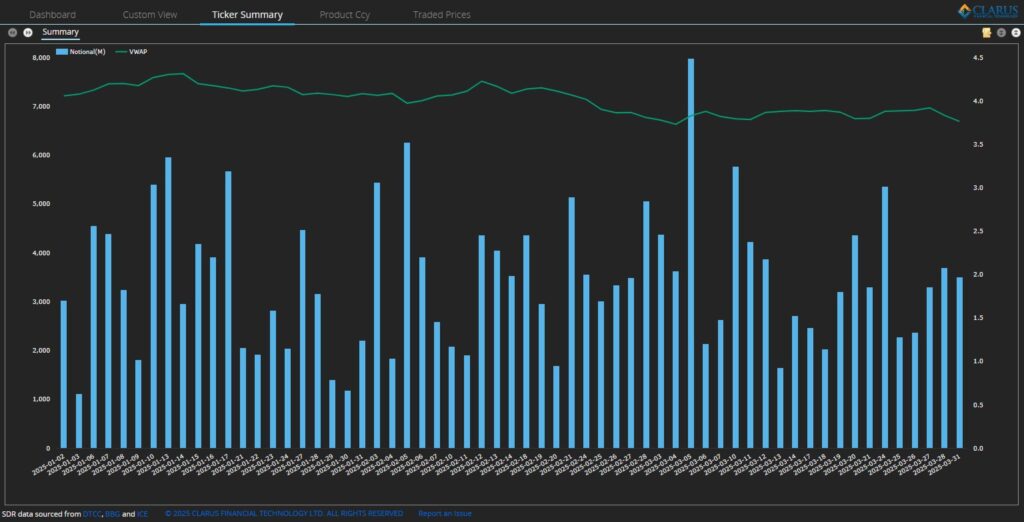
Chart 1: 2025 Q1 USOSFR10 swap notional and daily VWAP. Source: SDRView
Focusing on the daily volume weighted average price (VWAP) on 10Y USD SOFR Swaps (ticker USOSFR10), chart 1 shows there was a 58 basis point range in the VWAP of 10Y SOFR swaps, from 3.733 percent to 4.315 percent – much lower than the record 100 basis point range in Q4 2024.
Unsurprisingly, the increase in block sizes early in Q4 2025 continued to drive lower percentages of trades (in the 8–11 percent range) reported above the capped threshold.
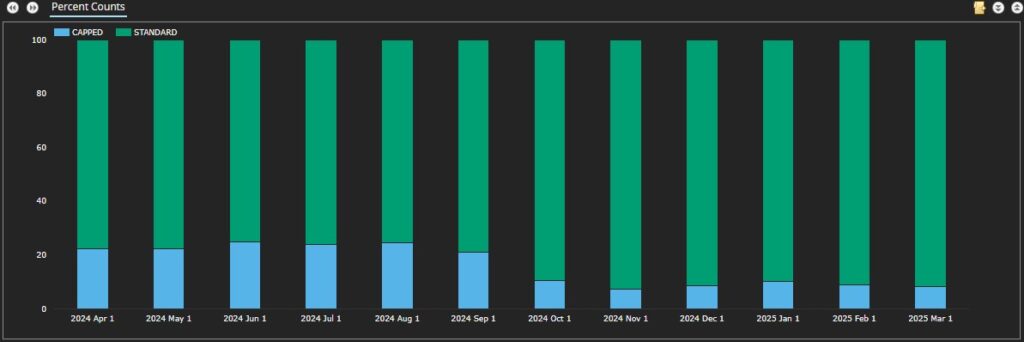
Chart 2: Percentage of USD swaptions above the block threshold.
Source: SDRView
Swaptions activity overall
The year-on-year comparison highlights the variability observed in swaption volumes.
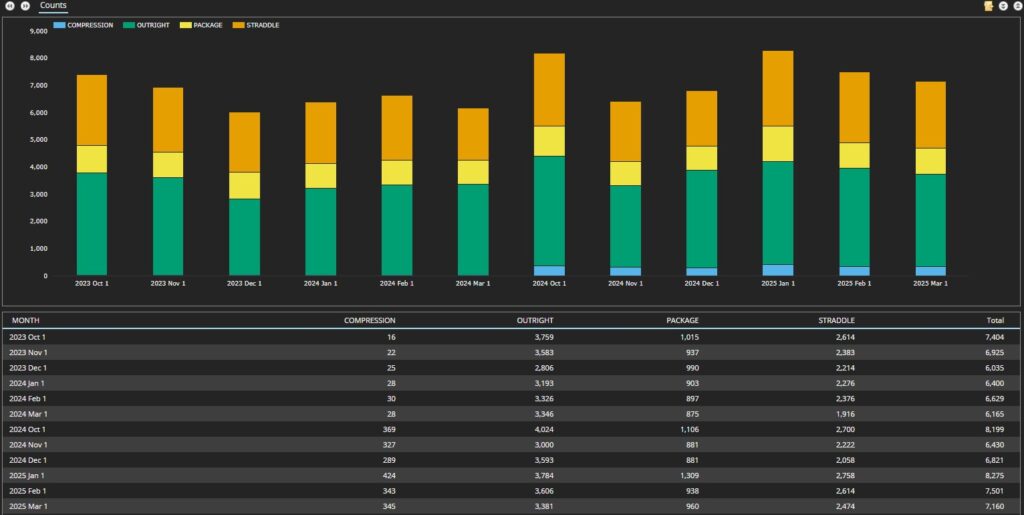
Chart 3: Trade counts of all USD swaptions.
Source: SDRView
Chart 3 shows:
- 22,908+ swaptions were executed in Q1 2025, 20 percent higher than Q1 2024, and 7 percent higher than Q4 2024.
- While January 2025 was the highest month in the quarter, exceeding any quarter in 2024, it was still 17 percent lower than the prior monthly record in February 2023 (not shown).
Swaptions activity by strike
SDR data for all USD swaptions reported in Q4 2024 (including packages) can be used to create the following heatmaps of swaption activity. Table 1 shows payers, receivers, and straddles combined. Then, each type is broken out in turn in an individual heatmap. Each table shows new trade notional volume (in $ millions) of USD swaptions traded in major whole year tails in 25 basis point strike increments. Expiries are grouped by tail. For example, a 3M10Y (that is, 3-month expiry, 10-year tail) is grouped with a 1Y10Y, if they were traded at the same strike. Red areas show the “hottest” strikes and tails, meaning those with the most notional traded.
First, we look at the summary.
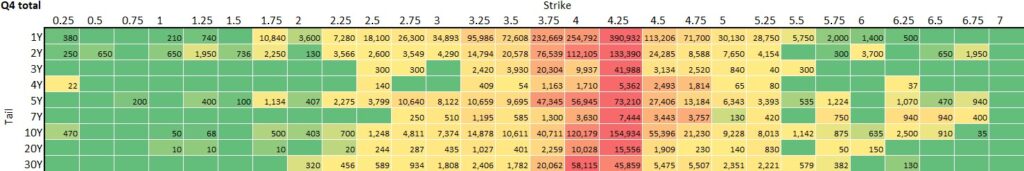
Table 1: USD swaptions volumes in USD millions.
Source: SDRView
We see:
- USD swaption notional volumes in these tails increased by 39 percent over Q4 – a huge increase.
- Strikes all the way up to 6.75 percent were traded in the quarter.
- The 6.25 percent strike continued last quarter’s higher-than-usual activity, though concentrated in 5Y tails (trading over $1 billion) and 10Y tails (trading $2.5 billion) instead of Q4’s focus on 2Y tails.
- The red areas clustering around 4 percent and 4.25 percent largely reflect where the at-the-money rates were, as volume trading is naturally concentrated around these areas.
- The most active tail was 1Y, with $1,403 billion ($618 billion more than Q4) traded across all strikes, largely driven by $878 billion trading in strikes of 3.75 percent, 4 percent, and 4.25 percent.
- There is then a big gap to activity in 10Y tails, which traded $457 billion – up$26 billion on Q4 2024.
- These are closely followed by 2Y tails, which traded $429 billion – up $104 billion on Q4 2024.
Now, we look at fixed rate receivers.
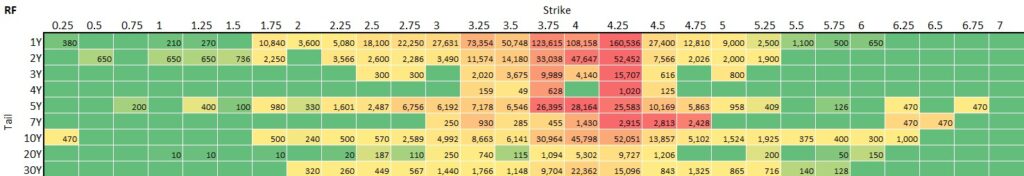
Table 2: USD receiver swaptions volumes in $ millions.
Source: SDRView
We see:
- Fixed rate receiver swaptions accounted for most of the overall QoQ volume increase, with total activity in fixed rate receiver swaptions up 65 percent on Q4.
- Receivers made up 45 percent of overall swaption notional traded (up from 37 percent in Q4).
- The most active tail was 1Y, which saw material activity in a range of strikes – more than $10bn traded in all strikes from 2.5 percent all the way up to 4.75 percent.
- Activity in 20Y tails always seems heavier in receivers, which were 57 percent of 20Y tails versus 16 percent in payers. Activity was concentrated at the 3.75 percent, 4 percent, and 4.25 percent strikes.
Next, we have fixed rate payers.
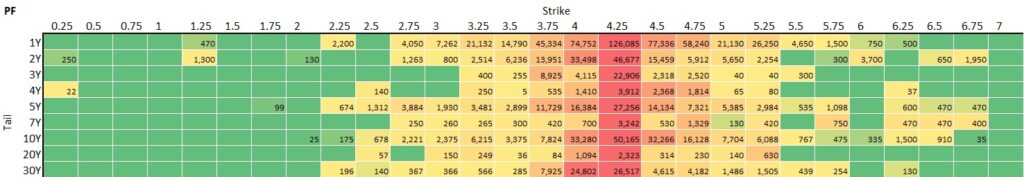
Table 3: USD payer swaptions volumes in $ millions.
Source: SDRView
We see:
- Total activity in fixed rate payer swaptions was up 22 percent on Q4.
- Payers made up 36 percent of overall swaption notional traded (down from 41 percent).
- 1Y and 4.25 percent were the most active tail and strike (the same as Q4).
- 4Y payers accounted for 80 percent of all activity in 4Y tails.
- 30Y payers continued to be active at 50 percent of total 30Y tails activity (as in Q4).
Finally, here are straddles.
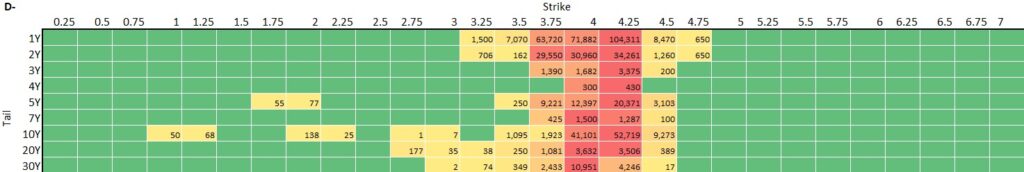
Table 4: USD swaption straddles volumes in $ millions.
Source: SDRView
We see:
- It is worth repeating the observation that the range of strikes is more compressed for straddles. This is because a straddle is a combination of a receiver swaption and a payer swaption with the same expiry, tail, and strike. This means that if rates do not really move, both payer and receiver positions will expire worthless, so that the premium paid (or received) will constitute a loss (or gain). Hence, straddle strikes naturally more closely follow at-the-money rates.
- Total activity in swaption straddles was up 23 percent on Q4.
- Straddles made up 19 percent of overall swaption notional traded (down from 21 percent).
- The most traded straddles were 1Y tails at 3.75 percent, 4 percent, and 4.25 percent strikes; then 10Y at 4 percent and 4.25 percent. The 1Y tail alone accounted for over $257 billion (47 percent) of straddle activity.
In summary
- Q1 2025 USD swaptions activity was much higher than the already active Q4 2025.
- The activity heatmaps show what can be done with SDRView trade data to show the most active USD swaption tails and strikes.
- This quarter, the main driver was 1Y tails, especially 3.75 percent, 4 percent and 4.25 percent strikes.
- We will continue to analyze USD swaptions activity quarterly as events unfold after the US election. I wonder what the next quarter holds.
Please contact us if you are interested in an SDRview subscription.