Continuing the work on Swaptions, I delve into the options market activity in Q4.
The quarter was characterised by trading activity related to the US election, and from a data perspective we cannot avoid giving a notable hat tip to the change in block sizes. Q4 2024 saw the following daily moves in ten year SOFR swaps:
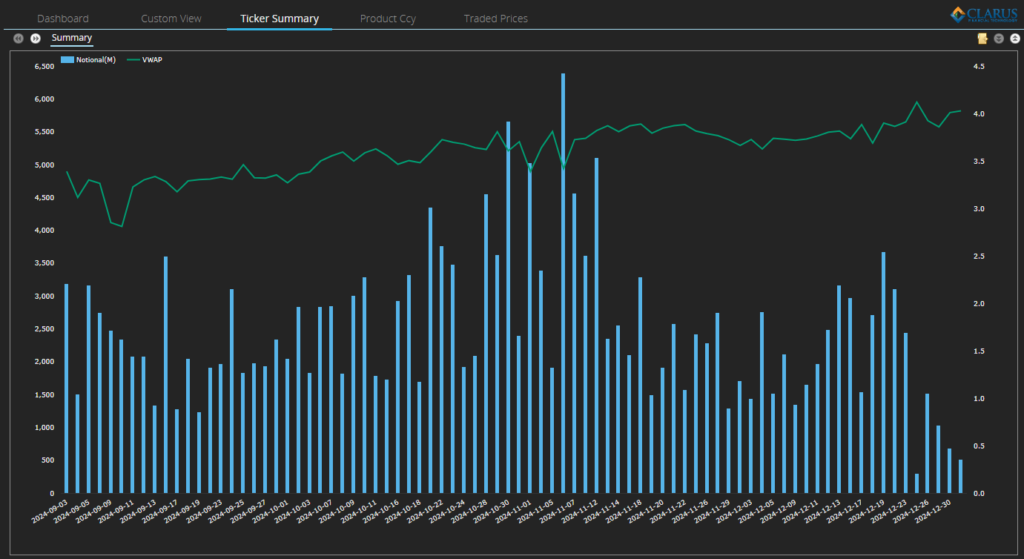
Showing;
- The daily Volume Weighted Average Price (VWAP) for 10Y USD SOFR Swaps (ticker USOSFR10).
- There was a 100 basis point range in VWAP, from 3.12% to 4.12% for 10Y SOFR swaps. This is a truly huge range, much larger than any other quarter in recent memory.
- The 60-70bp move higher in yields from the end of September was notable, as was the Christmas Eve high of 4.12%. Q1 2025 isn’t shaping up to have anywhere near the same range as the end of last year!
- The largest volume days were obviously around the Election – consistent with our blogs at the time – the result of which was pretty well priced-in by markets and saw yields consolidate at their higher levels.
- Volumes then declined throughout Q4, before a blitz of trading in the middle of December, followed by the typical seasonal death of volumes into year end.
Notes on the Data
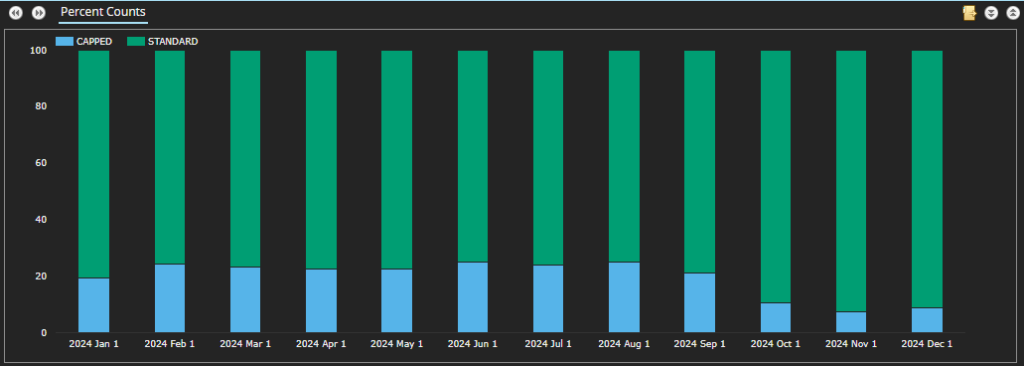
Straddles are one of the packages that Clarus identify in SDR data. They are no longer identified in the source data – see this blog for details – and yet over 74% of D2D trades were Straddles in Q4. I have to mention the change in Block Sizes again, with the percentage of trades reported above the capped threshold decreasing from 23% to just 8%. This is as a result of the Block Sizes increasing:
Swaptions Activity
The Year-on-Year comparison highlights the variability we see in Swaption volumes:
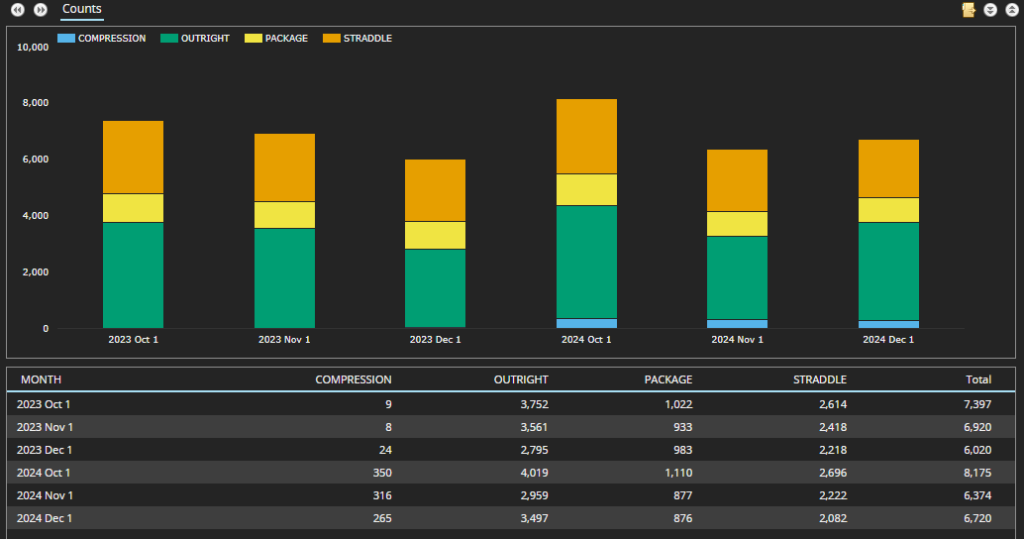
Showing;
- 21,000+ swaptions executed in Q4-2024, 4% higher than Q4-2023.
- October 2024 (NOT the election month!) saw the highest volumes, common with 2023. October volumes were 10% higher than a year earlier.
- December actually saw more activity this year than in November, which seems relatively unusual. I guess we have Trump to thank….
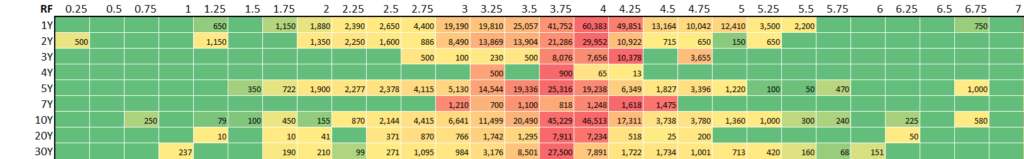
Swaptions Activity by Strike
SDR data for all USD Swaptions reported in Q4 2024 (including packages) can be used to create the following heatmap of Swaption activity:
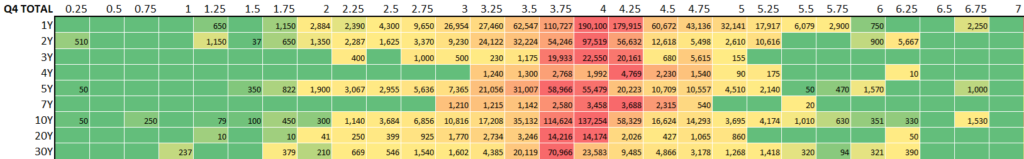
The summary of Q4 2024 USD swaptions activity shows;
- The notional volume (in $ millions) of USD swaptions traded in major tenors in 25 basis point strike increments.
- This covers all expiries. A 3m10y is grouped together with a 1y10y if they were traded at the same strike.
- This covers Payers & Receivers, Straddles and all other Packages.
- It looks at new volumes traded in the quarter. This is not the same as Open Interest (such as the CME Heat Maps) but it nevertheless gives an idea of activity.
- Red areas show the “hottest” strikes and tenors, those with the most notional volume traded.
- We saw strikes all the way up to 6.75% trade in the quarter (for 1Y, 5Y and 10Y underlyings), with activity starting to drop-off at ~5.75% strikes for most of the underlyings. The $5Bn+ of activity in 2Y tails at 6.25% is the notable exception (underlyings are also referred to as “tails”).
- The 6.25% strike saw 1Y, 5Y and 10Y tails all trade in excess of $1bn. It has been unusual to see such large activity at these elevated strikes
- The red areas largely reflect where the at-the-money rates were as vol trading is naturally concentrated around these areas. The red areas can help highlight the shape of the curve, and wow is it a flat curve these days.
- The most active tenor was 1Y, with $785bn traded across all strikes in Q4 2024, $117bn more than during Q3. We have not seen those types of volumes for 18 months (see Q3 2023 Swaptions).
- There is then a big gap to activity in 10Y underlyings, with $429bn traded (again much higher than Q3 2024). This is consistent with our previous analyses where 1Y and 10Y tenors see the largest notional amounts trading.
- There was an exceptional amount of activity in 1Y tails at strikes of 4-4.25% with over $370bn trading!
Receivers Activity
Now looking at activity only in Receivers:
- Total activity in Receivers accounted for 37% of overall Swaption activity (measured by notional) – identical to the 37% we saw in Q2 and Q3 2024.
- The most active underlying was 1Y, which saw a range of strikes traded. $10bn or more traded in strikes from 3.0% all the way up to 5%.
- Activity in 20Y underlyings is always seemingly heavier in Receivers. Of all activity versus a 20Y tail, 50% was in Receivers (versus 25.7% in Payers). Activity was concentrated at the 3.75% and 4% strikes.
- 4Y receivers saw only $1.5bn traded across four different strikes. They accounted for only 9% of total 4Y swaptions activity.
Payers
And for Payers only;
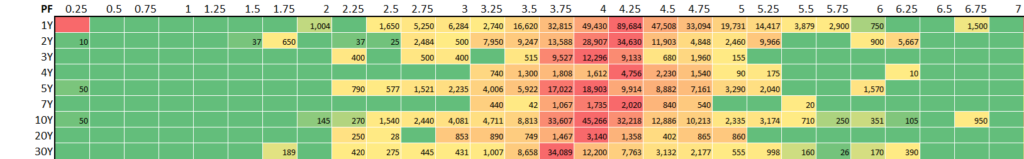
- Payers accounted for 41% of total Swaptions activity as measured by notional (up from 39% the previous quarter).
- The most active underlying and strike was 1Y 4.25% (the same as Q3). However, with $90bn traded it saw huge volumes, easily the most active of any 25 basis point increment across Payers and Receivers, and only rivalled by the $80bn of activity in 1Y 4% Straddles (see below).
- 4Y Payers accounted for 89% of all activity in 4Y tails this quarter.
- 30Y tails were also pretty active in Payers, accounting for 50% of activity for 30Y tails (up from 46% in Q3).
Straddles
And finally the Straddles Heatmap:
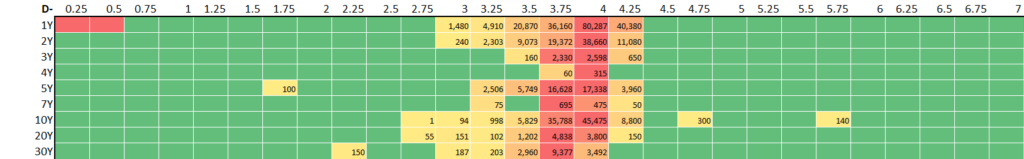
- Due to the product, the range of strikes is naturally more compressed for Straddles. A Straddle is a combination of a Receiver Swaption and Payer Swaption with the same expiry, same underlying and same strike. Therefore, if Rates do not really move, both Payer and Receiver positions will expire worthless, and the premium paid (or received) will constitute a loss (or gain).
- Straddles accounted for 21% of total swaption notional traded, lower than both Q2 and Q3 2024. Activity in Straddles is heavily skewed toward the D2D market, making me wonder if we should repeat this analysis for D2D data only!
- The most traded Straddles were 1Y and 10Y underlyings at 4% strikes (did someone say “flat curve”?). The 1Y underlying accounted for over $80bn of activity (these are “package adjusted” notionals, so only one leg of the Straddle notional is counted).
In Summary
- Analysis of swaptions activity is a regular feature on the blog across Payers, Receivers and Straddles, allowing us to monitor quarterly trends.
- Heatmaps of option activity show the most active underlyings (tails) and strikes.
- Q4 2024, including a US Election, saw 4% more swaptions transacted than the same quarter last year.
- There was a huge amount of activity in Payers versus 1Y underlyings at 4.25% strikes.