This post looks at USD swaptions activity in Q3 as part of our regular quarterly coverage, the most recent of which was Swaption Volumes by Strike – Q2 2024.
We use SDRView data, which shows all trades reported by US financial firms to US SDRs.
If you are new to swaptions, some basics are outlined at the start of the earlier Q1 blog.
Key takeaways:
- Unusually, Q3 2025 saw SDR-reported USD swaptions notional volumes increasing and breaking a monthly record at the same time as executed trade count went down. This means that trade size increased with a greater effect than the reduction in trade count.
- The biggest QoQ notional increases were in 1Y, 2Y and 5Y tails, and the biggest decrease was in 10Y tails.
- The activity heatmaps used to derive this information are an example of the use of SDRView trade data download to analyze more deeply.
Swap market context
Q3 2025 saw the following daily price moves and activity in 10-year SOFR swaps:
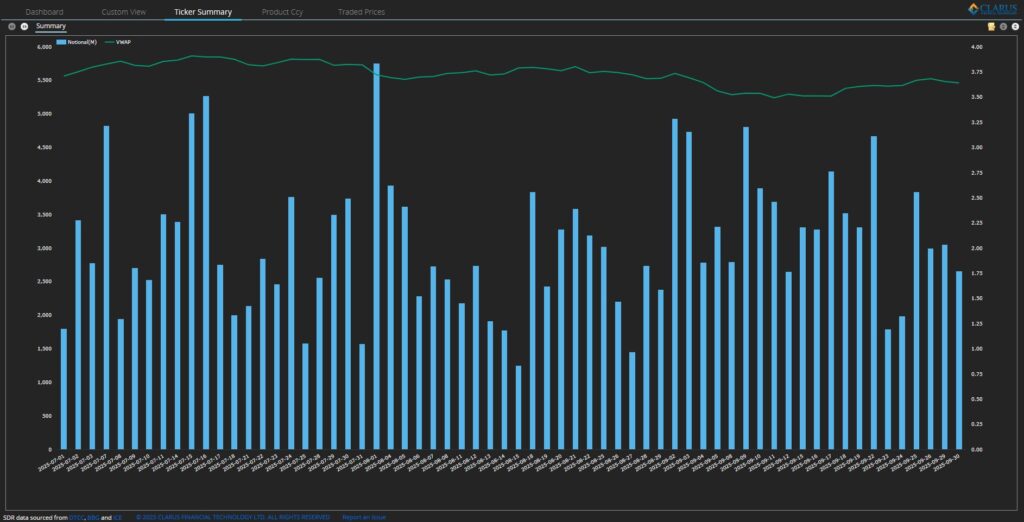
Chart 1: Q3 2025 USOSFR10 day-by-day swap USD notional and VWAP. Source: SDRView
Focusing on the daily volume and volume weighted average price (VWAP) of 10Y USD SOFR Swaps (ticker USOSFR10), Chart 1 shows that Q3 saw a 41.6 basis points (bps) range in the VWAP of 10Y SOFR swaps, from 3.495 percent to 3.911 percent. This is lower than the 55 bps range in Q2 2025. After rising to a 3.911 percent peak in the first half of July, August saw VWAP dwell in the 3.7–3.8 percent range, while early September brought a retreat to the 3.495 percent period low before VWAP recovered.
Let us take a quick look at capped trade percentages.
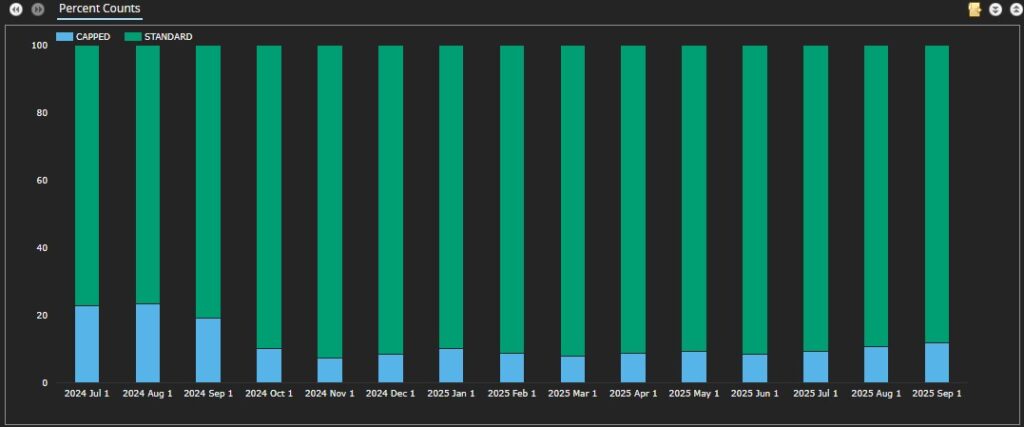
Chart 2: Month-by-month trade count percentage of USD swaptions above the block threshold. Source: SDRView
Chart 2 shows that the percentages of trades reported above the capped threshold trended up in Q3 2025. September 2025 was over 11 percent for the first time since the increase in block sizes early in Q4 2025, while remaining well below the percentages over 20 percent seen before that. The share of capped trades in Q3 was on average 1.8 percent higher than in Q2.
Swaptions activity overall
Activity continued at a similar level to prior quarters and below the prior peak noted in the last edition of this blog.
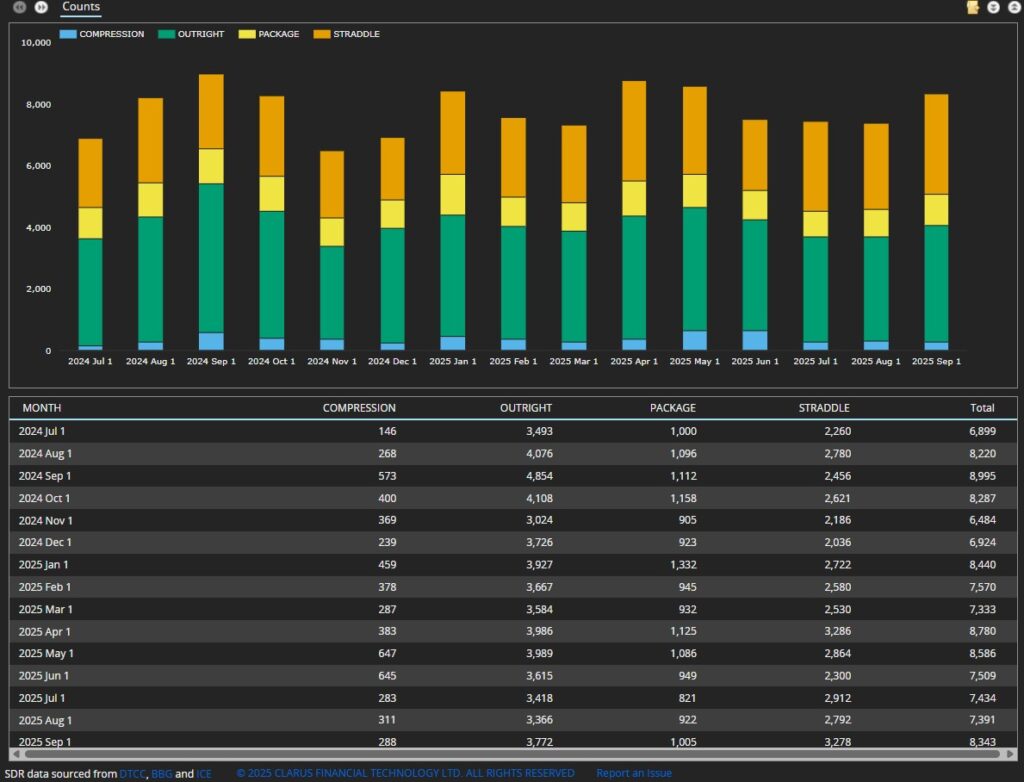
Chart 3: Month-by-month USD swaptions executed trade counts by package type. Source: SDRView
Chart 3 shows that there were 23,168 swaption trades executed in Q3 2025 – down 3.9 percent YoY, and down 6.9 percent QoQ.
- September was the highest trade count month in Q3 2025 with 8,343 trades – down 7.2 percent YoY, but up 11.1 percent over June. The September trade count was below that of January, April, and May of 2025, and well below the February 2023 record of 10,426 trades.
If we look at the same trades but analyzed by notional, we see quite a different picture.
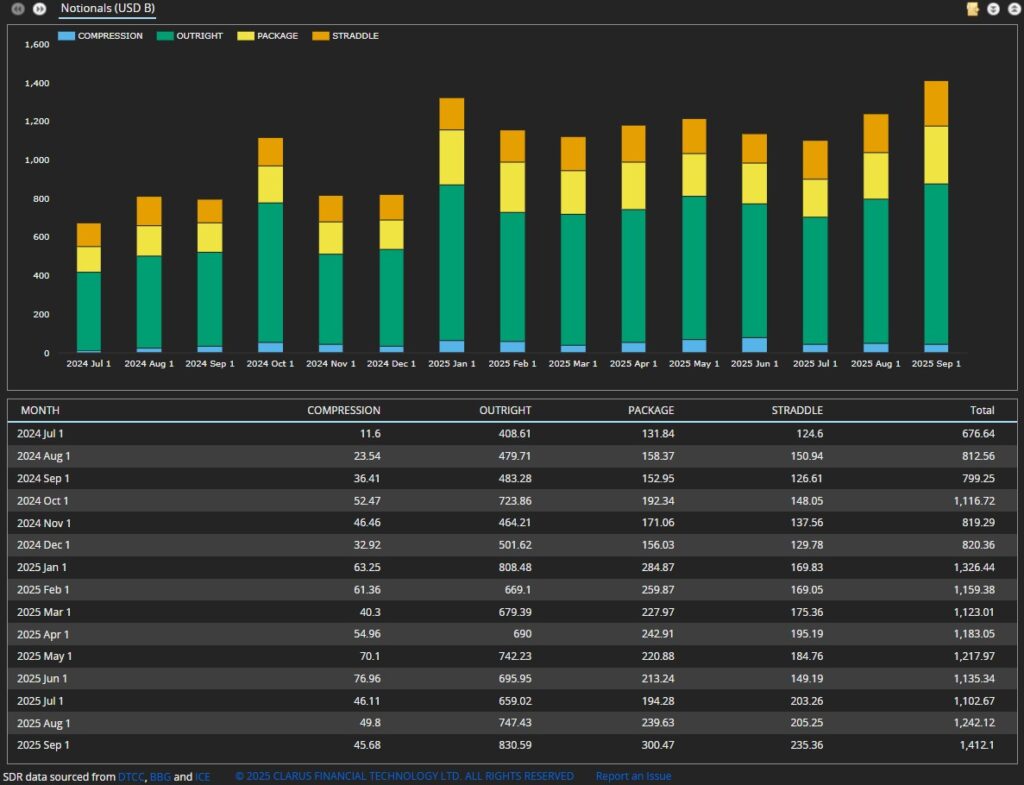
Chart 4: Month-by-month USD swaptions executed trade notional by package type ($ billions). Source: SDRView
Chart 4 shows that Q3 saw $3.76 trillion notional of SDR-reported swaption trades executed – up 64 percent YoY, and up 6.2 percent QoQ.
- The notional increase seems to clash with the decreased Q3 USD swaption count shown in Chart 3. However, the notional increase is corroborated by the material increase in the share of capped trades in Chart 2.
- September saw a new record of $1.41 trillion of SDR-reported USD swaption notional, beating the prior record of $1.33 trillion set in January 2025.
- Compressions in the quarter were down an average of $20 billion a month in Q3 compared with Q2 – suggesting June, July, and August IM optimization volumes were lower than March, April, and May. For more on rates IM optimization, see our recent blogs: Rates IM optimization and Rates IM optimization and swaption terminations.
Swaptions activity by strike
SDR data for all USD swaptions reported in Q3 2025 (including packages) can be used to create the following heatmaps of swaption activity. Table 1 shows payer, receiver, and straddle option types combined. Subsequent tables present a heatmap for each option type in turn. Each table shows new trade notional volume (in $ millions) of USD swaptions traded in major whole-year tails in 25 bps strike ranges. We group expiries by tail. For example, we group a 3M10Y (that is, 3-month expiry, 10-year tail) with a 1Y10Y, if traded at the same strike. Red areas show the “hottest” strikes and tails, meaning those with the most notional traded.
First, we look at the summary.
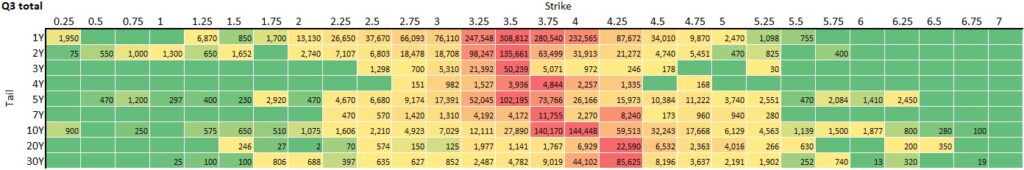
Table 1: USD swaptions notional volumes by major tail and strike in USD millions. Source: SDRView
Table 1 shows that:
- Table 1 shows increased Q3 USD swaption notional in the major tails – up 14 percent over Q2.
- Strikes all the way up to 6.75 percent traded in the quarter.
- The red areas clustering around 3.5, 3.75, 4, and 4.25 percent reflect where the at-the-money rates were, as volume trading naturally concentrates around these areas.
- The range of strikes trading over $10 billion in the quarter was from 2.00 to 5.25, tighter than Q2s range from 1.25 to 6.25.
- The most active tail was 1Y, with $1,436 billion traded across all strikes, driven by $1,069 billion traded in strikes of 3.25, 3.5, 3.75, and 4.0 percent.
- Tails with bigger QoQ volume changes were 1Y – up $298 billion (26 percent), 2Y – up $58 billion (16 percent), and 5Y – up $38 billion (12.3 percent) and 10Y – down $27 billion (5.4 percent).
Now, we look at fixed-rate receiver swaptions.

Table 2: USD receiver swaptions notional volumes by major tail and strike in USD millions. Source: SDRView
Table 2 shows that:
- In Q3, fixed-rate receiver swaptions accounted for most of the overall QoQ volume decrease, with activity in these tails up 7.4 percent on Q2.
- Receivers made up 40.3 percent of overall swaption notional traded – down slightly from 40.7 percent in Q2.
- The most active tail was 1Y, which saw material activity in a range of strikes, with more than $10 billion traded in each strike from 2.00 to 4.25 percent.
- 20Y tails again traded more actively in receivers, which were 47 percent of 20Y tails activity versus 35 percent in payers. 20Y tails were highly concentrated in the 4.25 percent strike, which alone was 52 percent of the activity.
Next, we have fixed-rate payer swaptions.

Table 3: USD payer swaptions notional volumes by major tail and strike in USD millions. Source: SDRView
Table 3 shows that:
- Q3 total activity in fixed-rate payer swaptions was up 17 percent on Q2.
- Payers made up 40.3 percent of overall swaption notional traded – down slightly from 40.5 percent in Q2.
- The most active tail was 1Y, in which the most active strike was 4 percent with 3.75 close behind (where 1Y and 4 percent stood out in Q2).
- 4Y payers accounted for 84 percent of all activity in 4Y tails.
- 30Y payers continued to be active at 45 percent of total 30Y tails activity (compared with 48 percent in Q4).
Finally, there are swaption straddles.
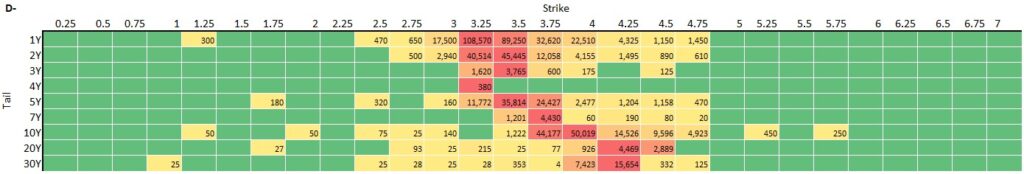
Table 4: USD swaption straddles notional volumes by major tail and strike in USD millions. Source: SDRView
Table 4 shows that:
- As usual, the Q3 range of strikes was more compressed for swaption straddles than for payers or receivers. See the Q1 blog for an explanation.
- Q3 total activity in straddles was up 22 percent on Q2.
- Straddles made up 19.4 percent of overall swaption notional traded – up from 18.8 percent in Q2.
- The most traded straddles were 1Y tails at 3.25 and 3.5 percent strikes; then 10Y at 3.75 percent and 4 percent. The 1Y tail alone accounted for over $279 billion or 44 percent of straddle activity.
End note
Skip back to the top to reread the key takeaways if you like.
Contact us if you are interested in an SDRView subscription.