This post continues our quarterly strikes analysis of USD swaptions, which are typically 50 percent or more of swaptions volumes in all currencies.
If you are new to swaptions, some basics are outlined at the start of the earlier Q1 blog. You may also wish to keep open on the side our recent blog on 2025 swaption volumes.
We use SDRView data, which captures OTC derivatives trades reported by US financial firms to US SDRs.
Key takeaways
- In Q4 2025:
- Both QoQ and YoY comparisons showed material decreases in SOFR swap rate volatility and markedly lower executed trade counts in SDR-reported USD swaptions.
- Despite the YoY declines in trade counts, YoY trade size growth was disproportionate enough to yield YoY USD swaption notional volume increases of 7.4 percent.
- There was unusually large activity in far out-of-the-money payer swaptions.
- The activity heatmaps used to derive this information are an example of the use of SDRView trade data download to analyze more deeply.
Swap market context
Q4 2025 saw the following daily activity and price moves in 10-year SOFR swaps.
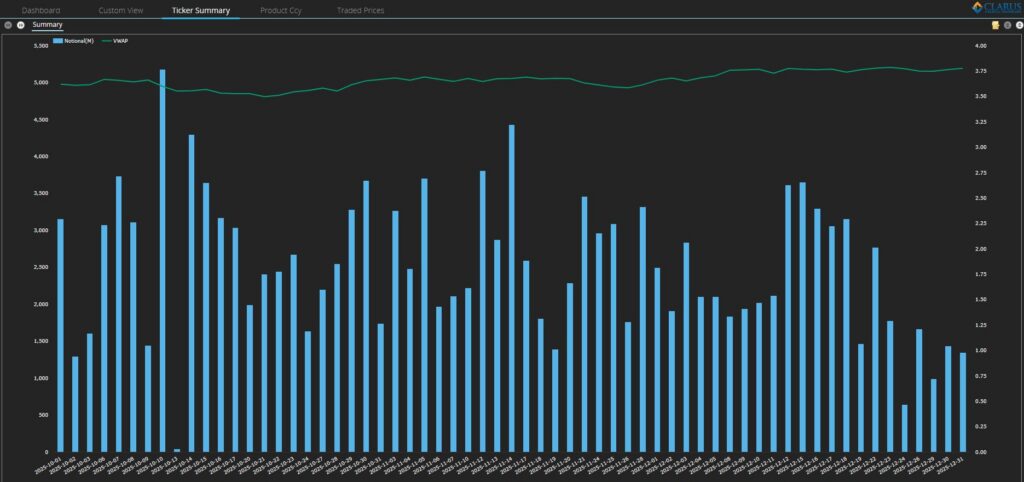
Chart 1: Q4 2025 USOSFR10 day-by-day swap USD notional and VWAP. Source: SDRView
Chart 1 shows that the 10Y USD SOFR swap rate (ticker USOSFR10) began Q4 2025 with its swap rate VWAP retreating to a late October low just below 3.5 percent. It then rose steadily to be above 3.7 percent for most of December.
- The VWAP range from 3.50 percent to 3.79 percent was 29 basis points (bps). This was markedly down from Q4 2024’s 100-bps range, via 52 in Q1 2025, 55 in Q2, and 42 in Q3.
Swaptions activity overall
Activity continued at a similar level to prior quarters and below the prior peak noted in the last edition of this blog.
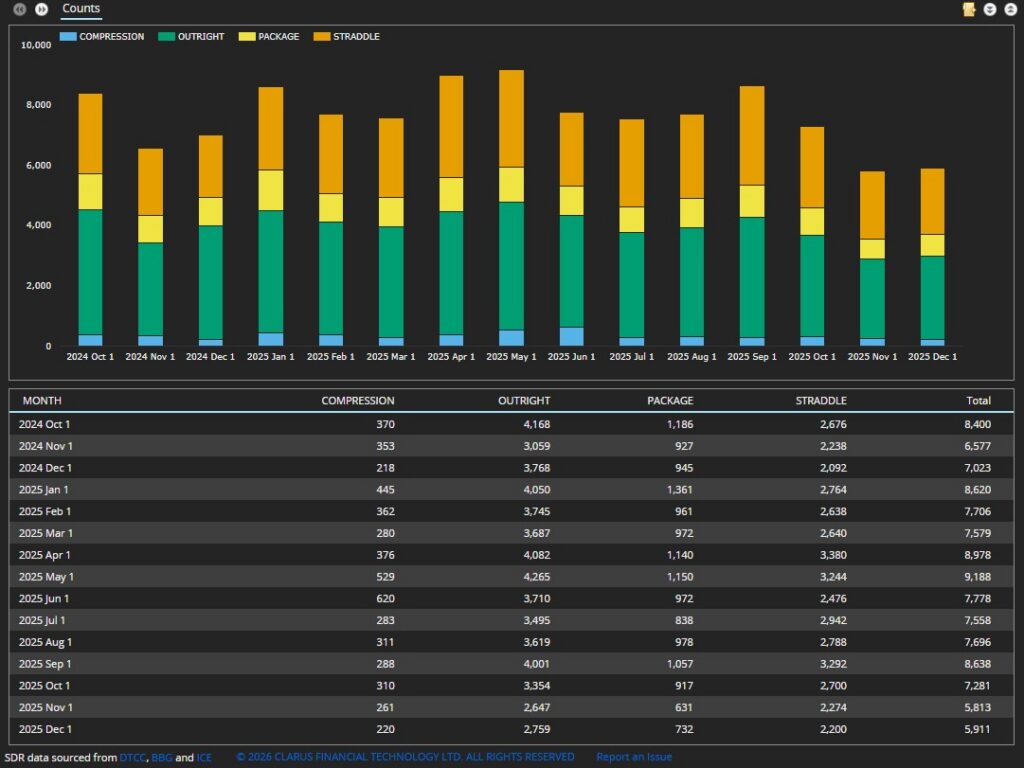
Chart 2: Month-by-month USD swaptions executed trade counts by package type. Source: SDRView
Chart 2 shows that 19,055 swaption trades were executed in Q4 2025 – down 14 percent YoY, and down 21 percent QoQ.
- Each month in Q4 2025 saw lower trade count than any earlier month of 2025. This might reflect non-linear trading desks comfort in meeting revenue budget well before year-end.
If we look at the same trades but analyzed by notional, we see a subtly different picture.
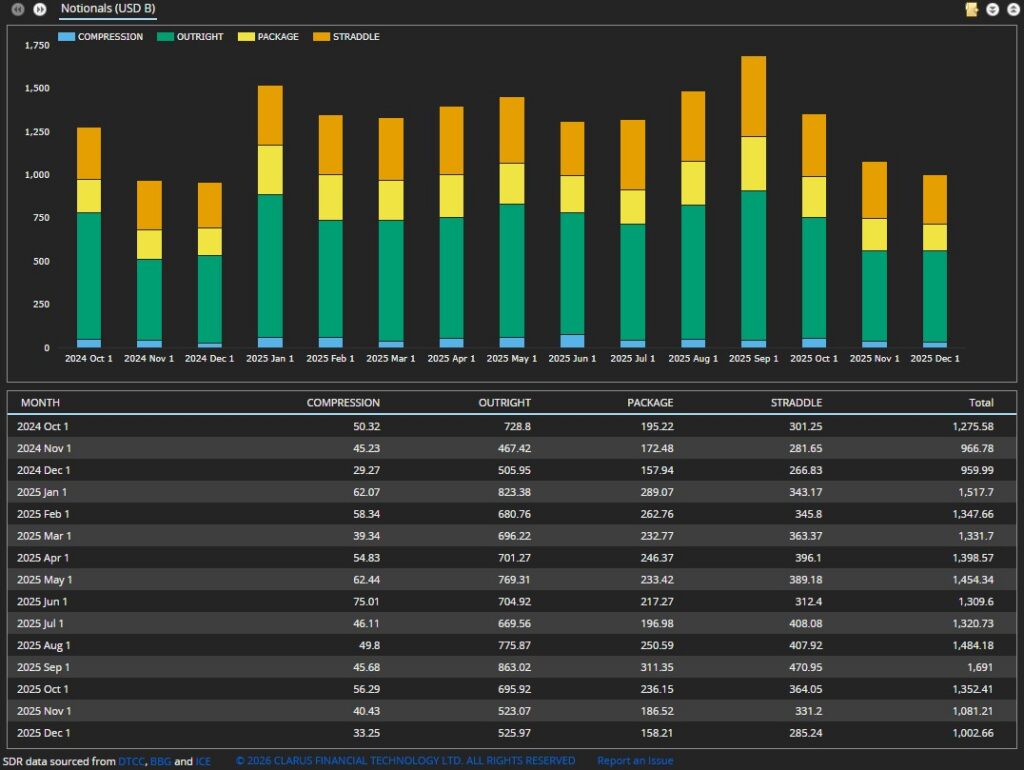
Chart 3: Month-by-month USD swaptions executed trade notional by package type ($ billions). Source: SDRView
Chart 3 shows that Q3 USD swaps saw $3.43 trillion notional executed – up 7.3 percent YoY, but down 24 percent QoQ.
- Swaption compressions volumes (which are heavily driven by rates IM optimization) had similar notional volumes in Q4 2025 as those in Q4 2024 after jumping up in Q2 2025.
There is apparent dissonance between the 14 percent YoY decrease in trade count noted under Chart 2 and the 7.3 percent YoY increase in traded notional noted under Chart 4. We can make sense of this by combining the two charts’ data to calculate trade sizes.
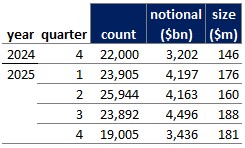
Table 1: quarter-by-quarter USD swaptions notional, count, and average trade size. Source: SDRView, author analysis
Table 1 shows that Q4 2025 trade sizes were $181 million – up 24 percent YoY, but down 4 percent QoQ. The YoY increase in notional volume is because the percentage increase in trade size was bigger than the percentage decrease in trade count. Take another look at Charts 3 and 4 to visualize the effect of trade size increases in 2025 for yourself.
Let us take a quick look at USD swaptions’ capped trade percentages.
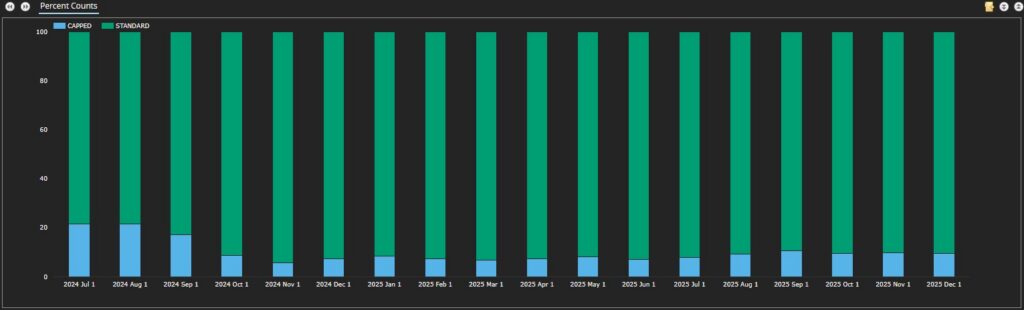
Chart 4: Month-by-month trade count percentage of USD swaptions above the block threshold. Source: SDRView
Chart 4 shows that the percentage of trade count reported above the capped threshold stayed between 9.4 and 10 percent in Q4 2025. This was down from the peak of 10.7 percent in September 2025. It was also about 2 percent higher than the average of the first nine months of 2025. This is consistent with the larger trade sizes in Q3 and Q4 shown in Table 1.
Swaptions activity by strike
SDR data for all USD swaptions reported in Q4 2025 (including packages) can be used to create the following heatmaps of swaption activity, where:
- Table 2 shows payer, receiver, and straddle option types combined.
- Subsequent tables present a heatmap for each option type in turn.
- Each table shows new trade notional volume (in $ millions) of USD swaptions traded in major whole-year tails in 25-bps strike ranges.
- We group expiries by tail. For example, we group a 3M10Y (that is, 3-month expiry, 10-year tail) with a 1Y10Y, if traded at the same strike.
- Red areas show the “hottest” strikes. That is, the strikes with the most notional traded within each tail.
First, we look at the summary.
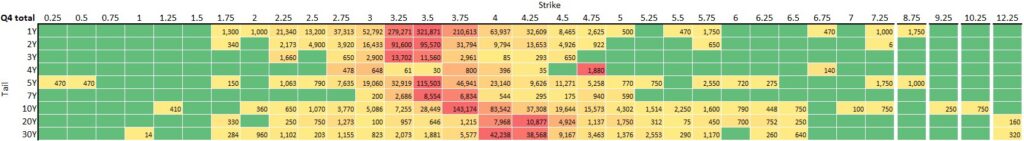
Table 2: USD swaptions notional volumes by major tail and strike in USD millions. Source: SDRView
Table 2 shows the breakdown of Q4 USD swaption notional volumes. These were down 28 percent over Q3, with all package types and tails contributing to the decline.
- Q4 2025 saw an unusually large amount of fixed rate payer swaptions activity reported with strikes above 7 percent. In the chart, I have included only those quarter-point ranges above 7 percent with non-zero activity and separated them with wider borders.
- The red areas for strikes near to at-the-money rates showed at around 3.25, 3.5, and 3.75 for shorter tails but around 4, 4.25, and 4.5 for longer tails.
- The range of strikes trading over $10 billion in the quarter was from 2.25 to 4.5, tighter than Q3’s range from 2.00 to 5.25.
- While all tails declined in volume from Q3 2024, the most active tail remained 1Y which traded $1.05 trillion notional – driven by $812 billion in strikes of 3.25, 3.5, and 3.75 percent.
Now, we look at fixed-rate receiver swaptions.
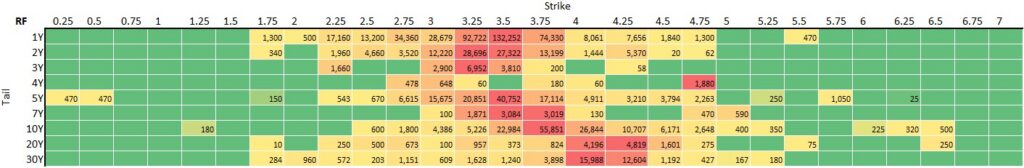
Table 3: USD receiver swaptions notional volumes by major tail and strike in USD millions. Source: SDRView
Table 3 shows the breakdown of Q4 2025 fixed-rate receiver swaptions activity. This made up 39.2 percent of USD swaption notional traded – down slightly from 39.4 percent in Q3.
- The most active tail was 1Y. This saw material activity in a range of strikes, with more than $10 billion traded in each strike from 2.25 to 3.75 percent.
- Of all activity in 4Y tails, payers accounted for 74 percent. Of this, 42 percent was in 4.75 percent strikes alone.
- 20Y tails again traded more actively in receivers (43 percent) than payers (36 percent). 20Y tail receivers were highly concentrated in the 4.00 and 4.25 percent strikes, which combined for 60 percent of the activity.
Next, we have fixed-rate payer swaptions.
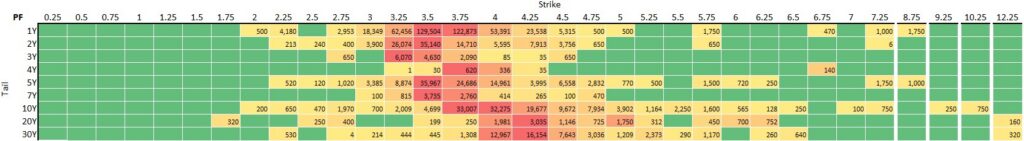
Table 4: USD payer swaptions notional volumes by major tail and strike in USD millions. Source: SDRView
Table 4 shows the breakdown of Q4 2025 fixed-rate payer swaptions activity, which made up 38.9 percent of USD swaption notional traded – down slightly from 39.6 percent in Q3.
- Again, the table shows the unusually large volume of payer swaptions activity in strikes above 7 percent.
- The most active tail was 1Y. Within 1Y, the most active strike was 3.5 percent with 3.75 not far behind (3.75 and 4 percent stood out in Q3).
- 30Y tails again traded more actively in payers (43 percent) than receivers (36 percent). 30Y tail payers were also highly concentrated in the 4.00 and 4.25 percent strikes, which combined for 59 percent of the activity.
Finally, there are swaption straddles.
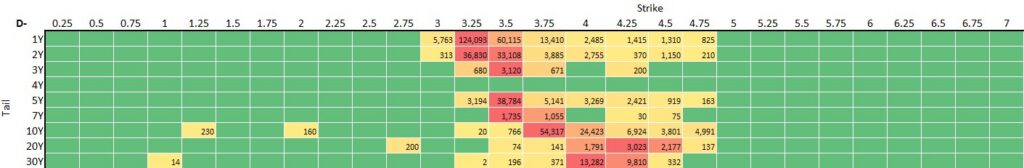
Table 5: USD swaption straddles notional volumes by major tail and strike in USD millions. Source: SDRView
Table 5 shows the breakdown of Q4 2025 swaptions straddle activity. This made up 21.9 percent of USD swaption notional traded – up slightly from 21.0 percent in Q3.
- As usual, the Q3 range of strikes was more compressed for swaption straddles than for payers or receivers. See the Q1 2025 blog for an explanation.
- The most traded straddles were 1Y tails at 3.25 and 3.5 percent strikes. Next was 10Y at 3.75 percent, then 5Y at 3.5 percent, then 2Y at 3.25 and 3.5 percent.
- The 1Y tail alone accounted for over $209 billion or 44 percent of straddle activity.
End note
Skip back to the top to reread the key takeaways if you like.
Contact us if you are interested in an SDRView subscription.