We looked into Term SOFR and BSBY Swap Volumes in April 2022 and What’s New in Term SOFR in November 2022, so today I will update that blog to see how trade volumes in these reference indices developed in 2022.
Term SOFR Swaps
In SDRView, I can group USD FixedFloat Swaps by the Reference Index of the floating leg and export this data to create an Excel PivotChart, which selects just Term SOFR trades.
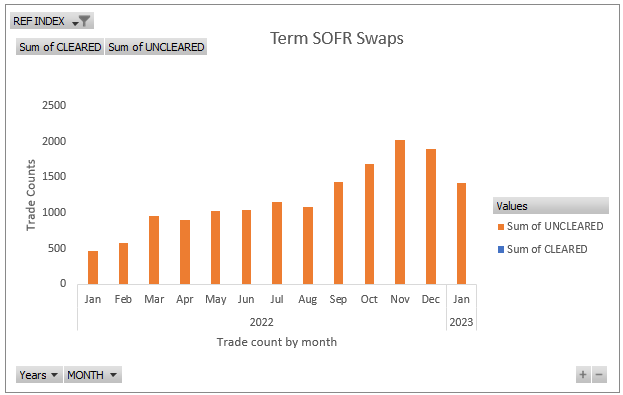
The number of trades in a month:
- 471 in Jan 2022
- 959 in Mar 2022
- 1,150 in Jul 2022
- 1,437 in Sep 2022
- 2,023 in Nov 2022
- 1,423 in Jan 2023
- All are Uncleared (and Off SEF).
So we continue to see an upward trend in monthly volumes, though with overall trade volumes of 15,000 to 20,000 per month in this product type, this represents <10% of overall volume.
For instance in Jan 2023, we see 17,800 trade counts, of which 15,255 are Libor, 2,273 SOFR and 273 Other. Of the 2,273 SOFR, we identify 1,423 as Term SOFR, howver the wide range of naming conventions for the SOFR reference index ( over 25 variations!) makes this an in-exact science. To get 1,423, we have taken anything which looks like a Term SOFR Rate (e.g. TSOFR or CME TERM SOFR) as well as any SOFR Average, but ignored ones that just have SOFR ( the remaining 850 out of 2,273).
Next the same selection but with gross notional.
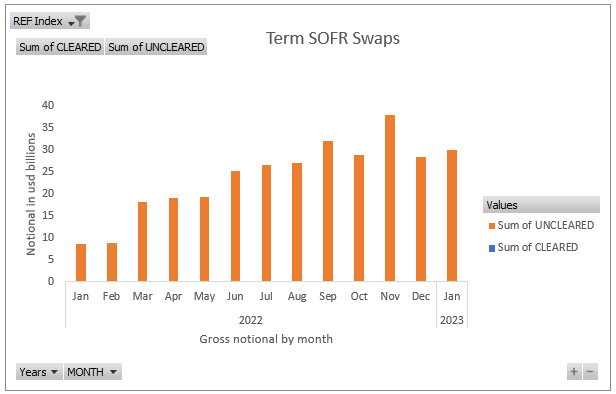
Again showing a steadily increasing trend from $9 billion in Jan 2022 to $29 billion in Jan 2023, with a high of $38 billion in Nov 2022.
The $29 billion in Jan 2023 is only 1% of the $3.5 trillion in USD FixedFloat Swaps reported; much lower than the 8% of trade count in the month.
In summary, we would say that Term SOFR Swap volume is ticking along with a slow increase but remains small, uncleared and off venue.
BSBY Swaps
Next lets repeat the above from SDRView for Swaps that reference the Bloomberg Short-term Bank Yield Index (BSBY), available here, which is series of credit sensitive reference rates that incorporate bank credit spreads and a forward term structure.
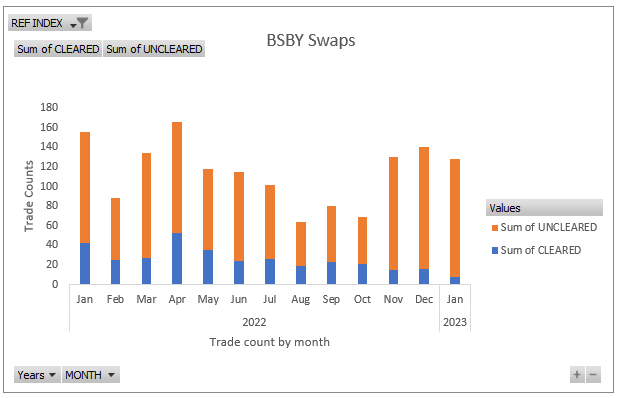
No clear trend, with 120 uncleared trades and 15 cleared trades in each of the prior 3 months.
Jan 2023 with just 128 trades in total.
Let’s switch to gross notional.
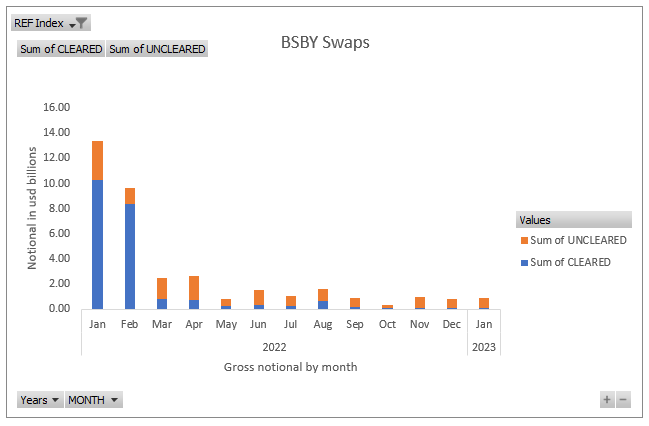
After the highs in Jan and Feb 2022 of $13 billion and $10 billion, we are down to < $1 billion in each of the prior 5 months, with $800 million in Jan 2023.
In Summary BSBY use is at very low levels and looks to be tailing off.
It is a small fraction of Term SOFR volumes, suggesting that Term SOFR has a significant lead in being the Term rate of choice where firms do not use the standard daily compounded in arrears SOFR rate.
Basis Swaps
A quick look at Basis Swaps that reference either BSBY or Term SOFR, shows tiny volume for either.
BSBY with between 1-5 trades a month and then nothing in the last two months.
Term SOFR with 20-40 trades a month.
No need for charts here.
CapsFloors
Next let’s look at CapsFloors.
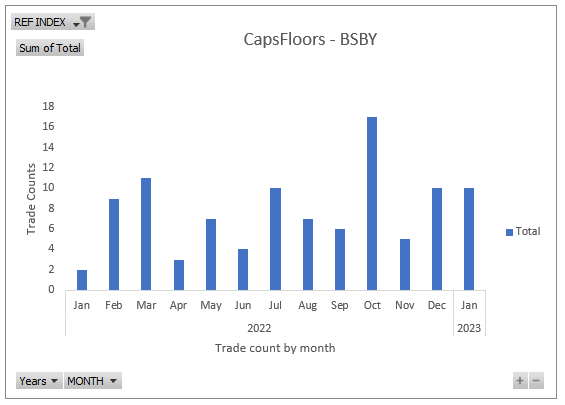
Around 10 trades a month that reference BSBY.
So not materal, lets move onto Term SOFR.
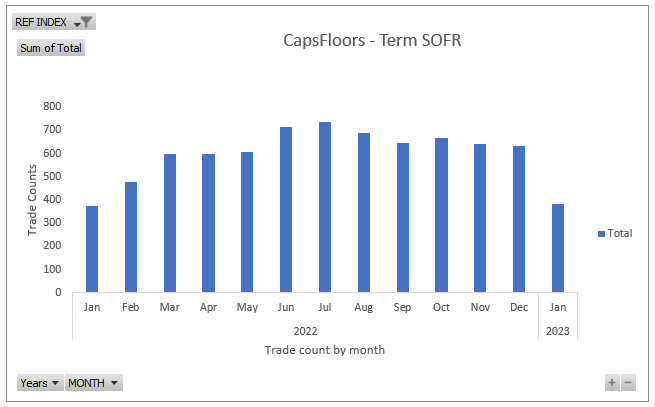
Significantly more that reference Term SOFR with 650 trades in most months in 2022.
Jan 2023 with 384 trades that reference Term SOFR out of a total of 983 that use SOFR or Term SOFR and 97 LIbor and 150 Other. Meaning Term SOFR represents a signficant chunk > 30% of all CapsFloors trades in the month. (But again with > 25 variations of Term SOFR names, albeit many with only a few trades, our numbers above are subjection to some variation).
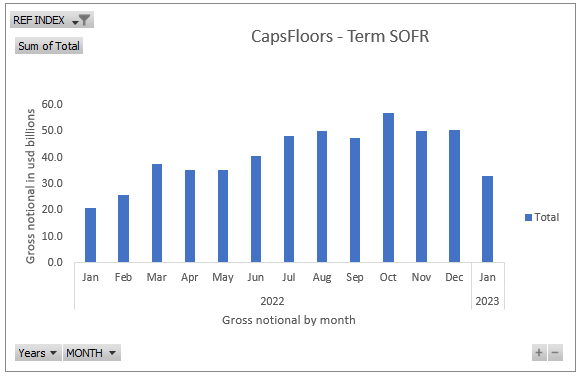
Volumes at $50 billion in each of Nov and Dec 2022, while Jan 2023 has $33 billion.
This compares to total CapsFloor volume in these same months of $235 billion, $305 billion and $300 billion, so Term SOFR share represents between 11% to 21% monthly share.
Term SOFR certainly seems to have become well adopted for CapsFloors trades.
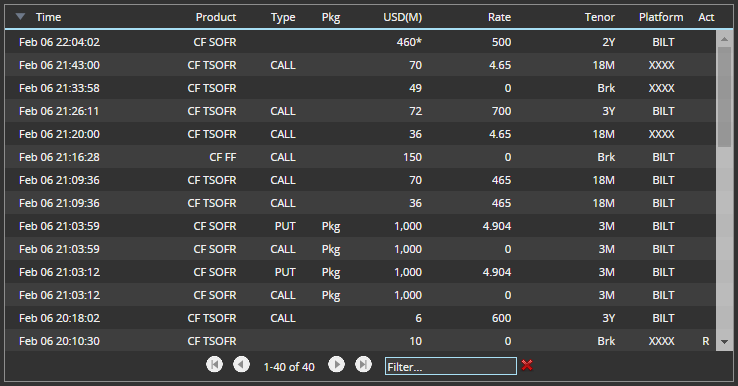
A quick look at the SDRView Tradelist for CapsFloors shows both SOFR and TSOFR trades, with the latter all Off venue.
Summary
Term SOFR is being actively used for Swaps and CapsFloors.
Volumes are ticking along and generally up over 2022.
CapsFloors in particular are between 10-20% of gross notional each month.
BSBY has very low use, <1% in Swaps and CapsFloors.
It will be interesting to see how volumes develop this year.