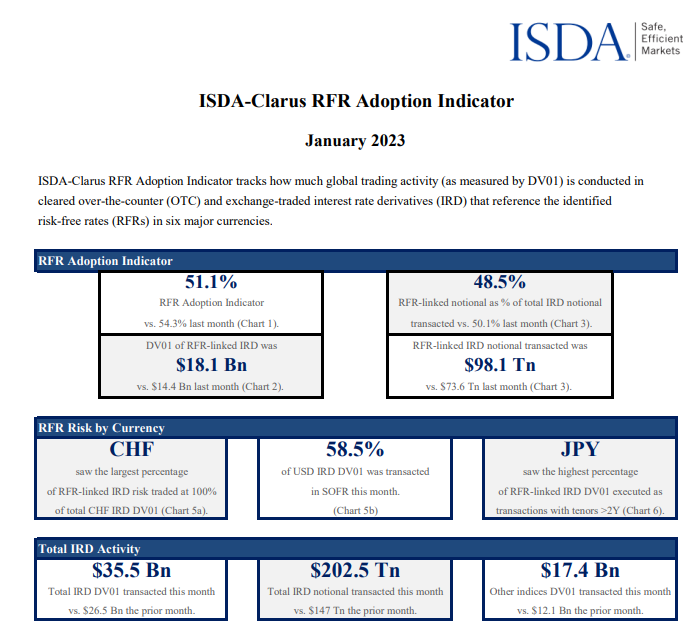
- The ISDA-Clarus RFR Adoption Indicator declined to 51.1% last month.
- This is the sixth consecutive month that it has remained around 51%.
- SOFR adoption dropped from 64.1% to 58.5%.
- €STR adoption remains volatile, around 18-22% each month.
- I take a look at Fed Funds activity again in USD markets.
The ISDA-Clarus RFR Adoption Indicator for January 2023 has now been published.
Showing;
- The index has dropped from 54.3% to to 51.1% – very similar levels to where it has been for six months now.
- SOFR adoption retreated back to November/December levels at 58.5%, a surprising drop from last month’s 64.1% reading.
- 48% of total activity by notional was vs RFRs, again at similar levels to the past 3 months.
- Futures activity again accounted for about 40% of all RFR risk – no real change since September last year.
Why The Stasis?
Am I becoming a broken record? In the past few weeks, I have written:
- RFR Adoption – Is This Groundhog Day?
- Can $62Trn really be about to simply disappear?
- Are Fed Funds the latest winner from benchmark reform?
All of those blogs are very much about the slower than required adoption of RFRs, particularly SOFR, as June 2023 fast approaches. What does this tell us?
- That LIBOR cessation in USD, despite it being a much much larger market, appears to be progressing in a similar manner as it did for GBP, CHF and JPY.
- Markets love leaving things to the last minute.
- It continues to be very hard to change trading behaviour.
- Market participants will heavily rely on the conversion processes at CCPs to transition trades into SOFR.
- And finally, could it mean that the average holding period of a position is only about 3 months, so everyone will be terminating their LIBOR trades before June anyway?!
Fed Funds Trading is Hot Right Now
My previous blog, and other commentators, have noticed that Fed Funds volumes are really elevated at the moment (as they were in Q1 2022). Updating my most recent Fed Funds blog;
Showing;
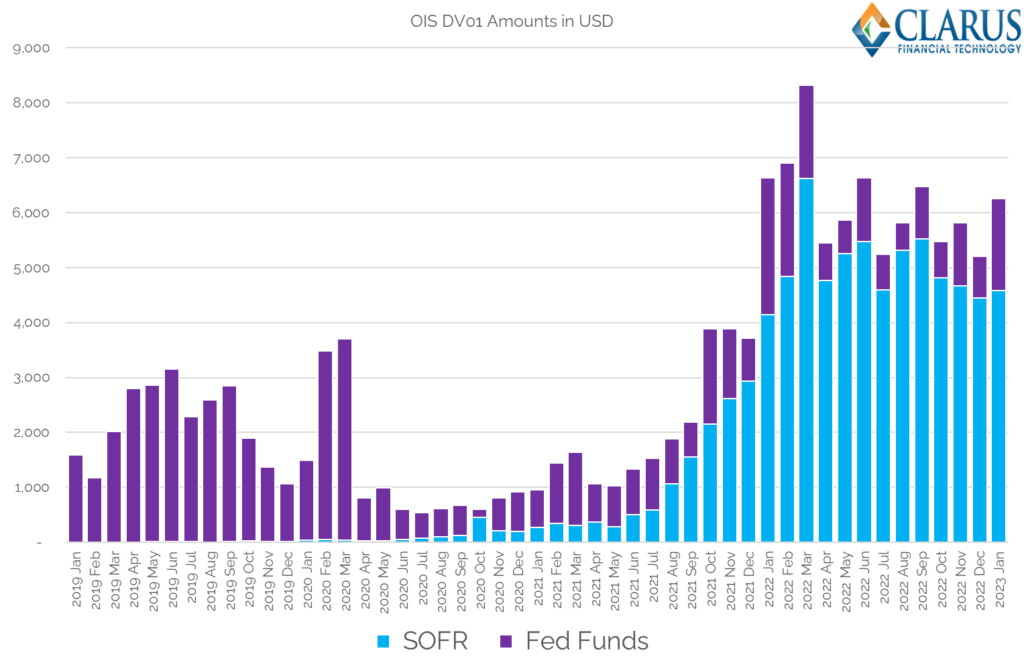
- DV01 Amounts of USD OIS cleared each month for the past four years.
- These are OTC DV01 amounts only – i.e. they exclude futures.
- The SOFR market has been larger, in terms of DV01 traded, than Fed Funds for quite some time.
- In fact, the last time that more Fed Funds risk traded in OIS markets than SOFR was way back in July 2021!
- Why are we looking at Fed Funds risk AGAIN then? Because Fed Funds counts as a “legacy rate” in the RFR Adoption Indicator. Increases in Fed Funds risk therefore increases the “non-RFR” volumes that we monitor – and is also potentially taking volume away from SOFR, so is certainly relevant.
- Last month saw $6.25Bn DV01 traded in OIS, with FedFunds the highest since Mar 2022
- It helps explain what dragged SOFR trading down to 58.5% of the market again.
USD LIBOR Risk Increased in January 2023
Staying in OTC space, we can monitor the amount of new USD LIBOR risk trading by looking at Fixed-Float USD Swaps in CCPView:
Showing;
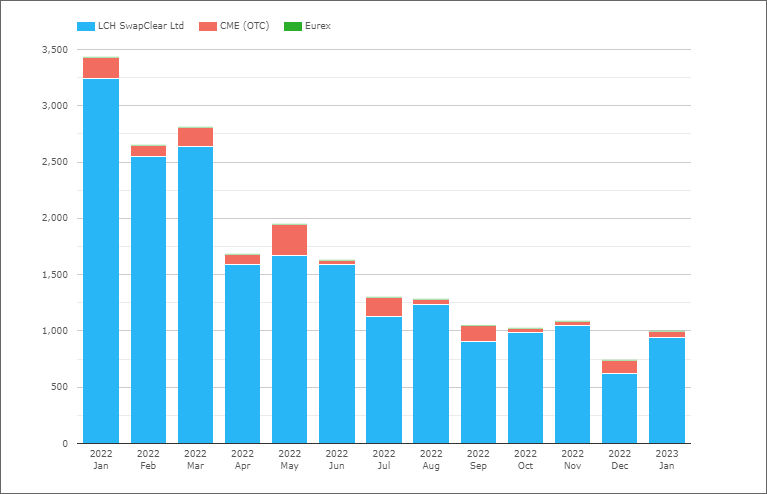
- DV01 of USD LIBOR IRS cleared each month.
- Notice that $1bn of DV01 traded in LIBOR swaps – similar to the amount in Fed Funds last month!
- That was up from $735m last month, and similar to each of Sep, Oct and Nov last year.
- Could this be more LIBOR risk moving into clearing to benefit from the conversion process I wonder?
- Open Interest (measured by notional, not DV01) dropped a touch by end Jan 2023, though at $33 trillion single-side gross notional, there is a lot of stock to convert to SOFR.
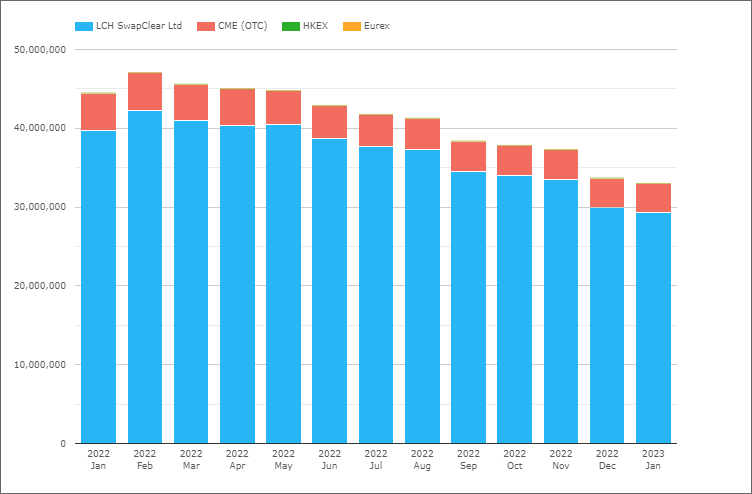
Now it is not unusual for Open Interest (in notional terms) to reduce at year-end before “miraculously” rebounding in January. Did I hear anyone say Window Dressing?
As far as I can tell, Open Interest has reduced in December and rebounded in January every year since at least 2018. Can’t be a coincidence, right?
Except for Jan 2023.
Two Final Charts
Two final charts today that I think our readers will find interesting. The percentage of OIS risk that is traded as either SOFR or Fed Funds in USD OTC markets:
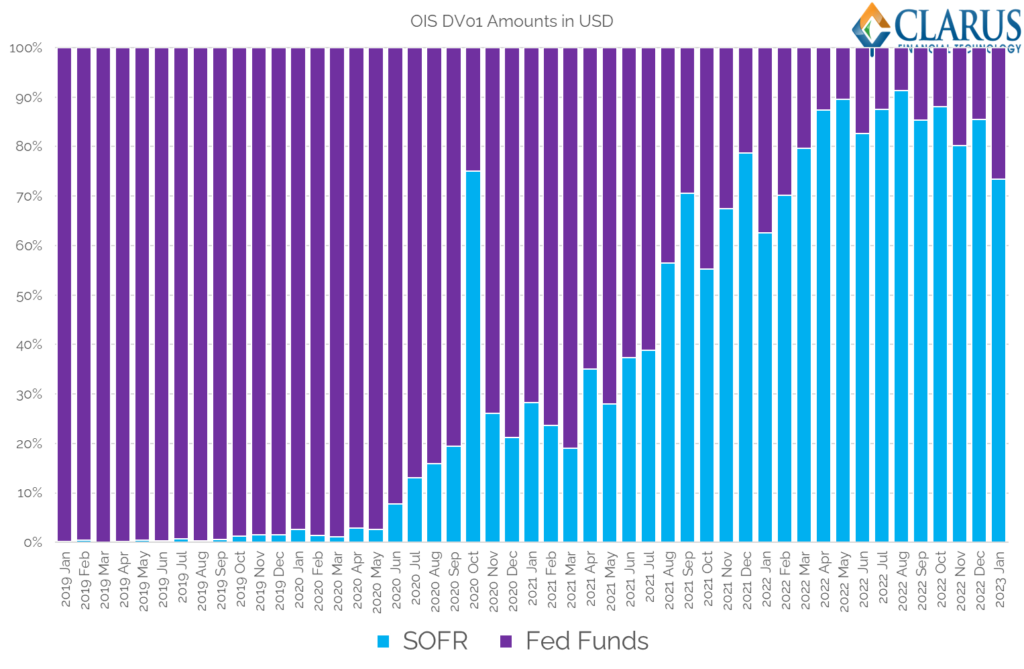
I have previously stated that I thought around 10% of the USD market would be traded versus Fed Funds after LIBOR cessation. That was based on a pretty steady reading from Q2 and Q3 last year. It will be interesting if Q1 this years ends up looking like Q1 last year….
And finally, let’s not leave Futures out of this. The amount of DV01 risk trading in Eurodollar futures has shrunk to less than 10% of the total USD risk at CME:
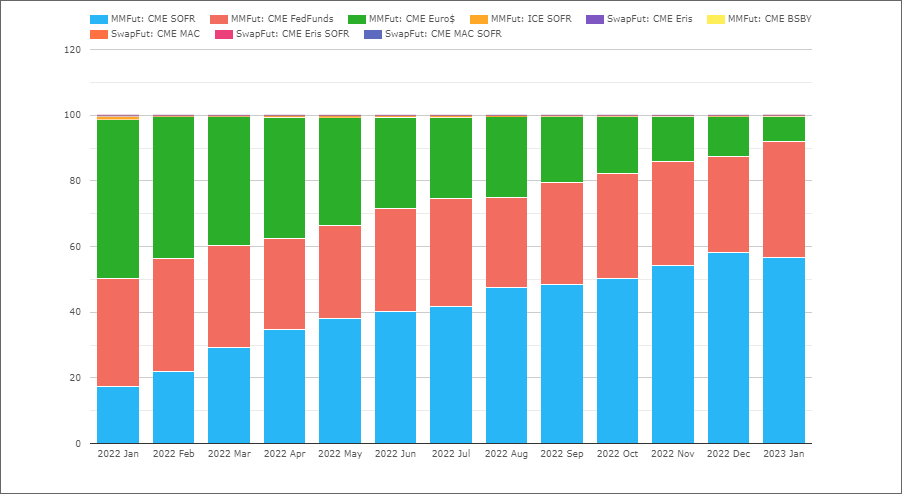
With SOFR accounting for 57% of DV01 risk in Futures for Jan 2023 and FedFunds 35%, you can see that the story is very similar across both OTC and ETD. Fed Funds trading increased slightly last month, whilst USD LIBOR trading increased in OTC but not ETD.
In Summary
- January 2023 was not a great month for RFR Adoption.
- The headline indicator decreased to 51.1%.
- USD SOFR trading decreased to 58.5% of the market.
- Much of the trading outside of SOFR can be traced to increases in Fed Funds activity.