Data is now in for the final month of the year, and we can put together our updated metrics on the FCM industry.
If you remember from the previous quarterly reports we do on this topic, the common themes have been:
- The growth in clearing is in swaps
- European banks stand out as retreating, or not growing as much as US firms
- The business is concentrated within the top 5 or so firms
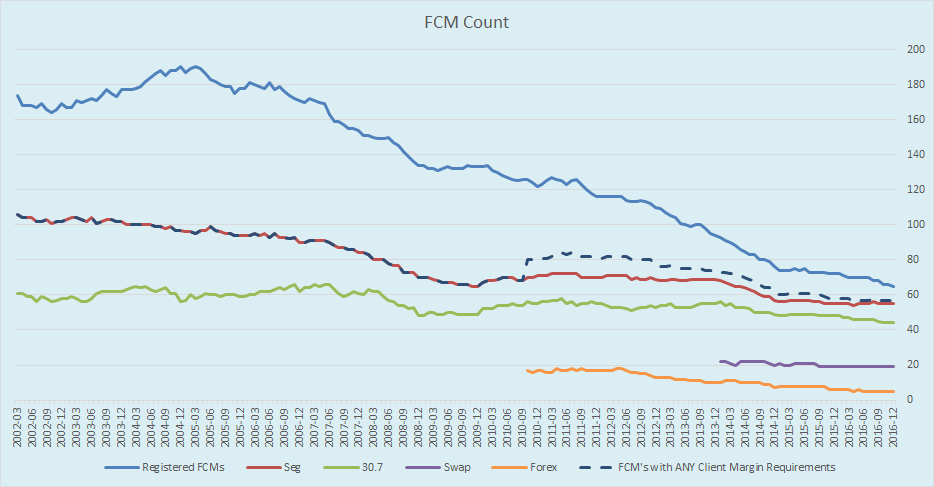
Reporting FCMs
The sheer number of FCM’s reporting data to the CFTC hit fresh lows December 2016. We now stand at just 65 total FCMs, down from 68 in September. Two of the names dropping off of the list appear to be simple consolidations:
- ETrade Securities & ETrade Clearing were both reported in September, now just ETrade Securities
- JP Morgan Clearing Corp & JP Morgan Securities were both reported in September, now just JP Morgan Securities
The other dropout is State Street Global Markets, now being fully wrapped up. Rest in peace SSGM.
The dotted line is the total number of FCMs that have any client margins across the regulatory classes. This number stayed put at 57. Which begs the question – what are the other 8 firms with no client business doing?
Required Margins
Below is the amount of margin required, per regulatory bucket.
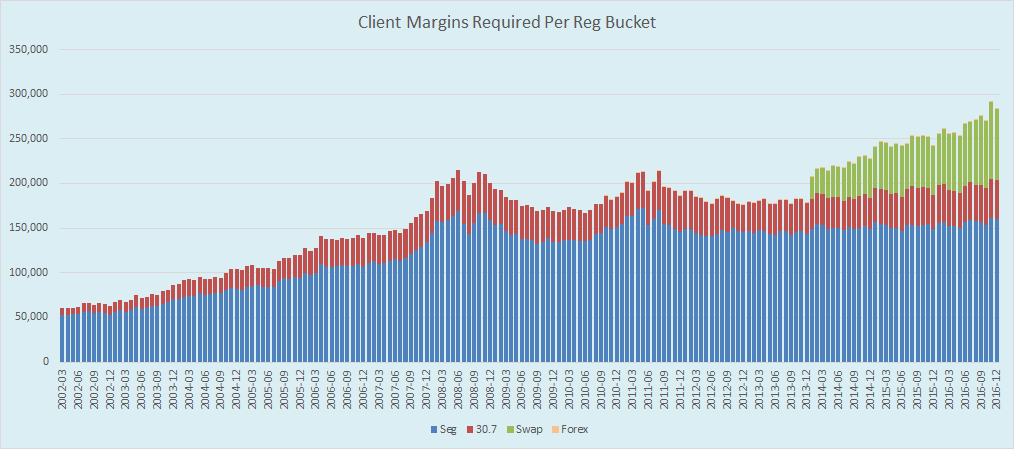
Its quite easy to notice that both Seg (domestic Futures & Options) and 30.7 (Foreign Futures & Options) are still off of their 2008 peak. Also noteworthy is that the amount of swaps margins continue to rise. In particular, swaps margins peaked in November 2016, which is probably due to a combination of effects from the US election:
- More trading activity due to the market volatility
- Margin models reacting to increased volatility, as we documented in a November article.
In total, we nearly hit $300 billion in required client collateral for cleared derivatives in the US. (Remember, this does not include house accounts).
League Tables
So lets now put some names and numbers together.
Cleared Swaps
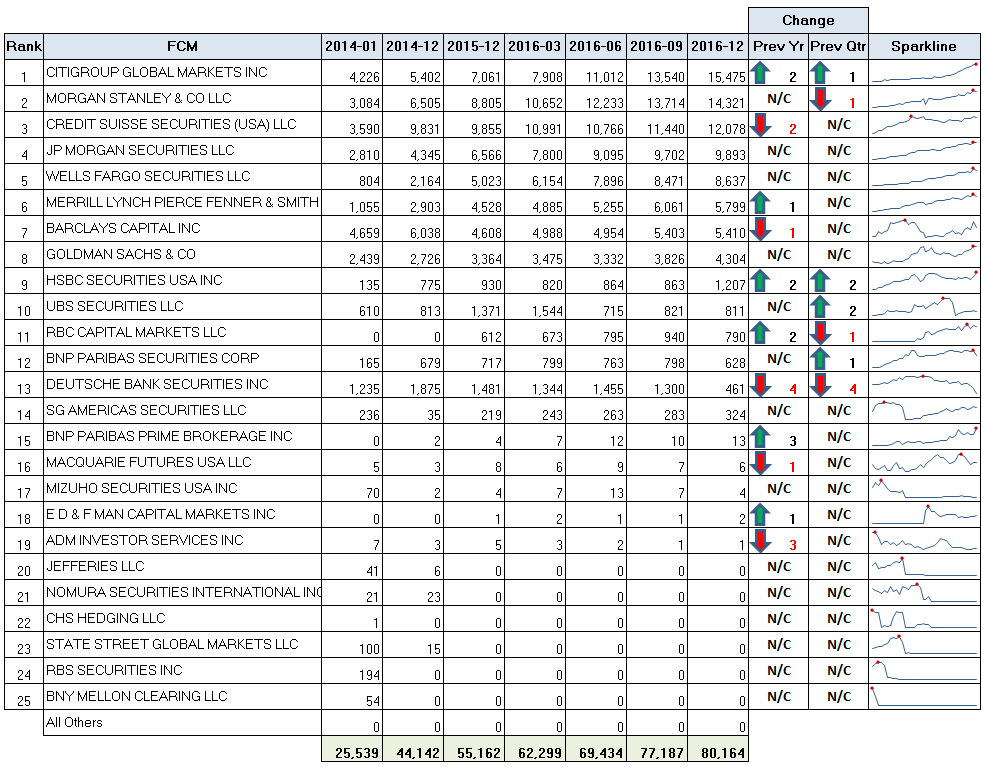
I have provided two “Change” columns. The first (Prev Year) is the change in ranking from Dec 2015, and the “Prev Qtr” is the ranking change from Sep 2016.
My takeaways here:
- Citigroup now tops the list, advancing 2 spots over the course of the year, by roughly doubling their required margins. Also note their clear trajectory in the sparkline, ending 2016 at their all-time high.
- HSBC advancing 2 spots from the ashes, to #9, and at an all-time high for them as well.
- Deutsche Bank down 4 spots, now with only 1/3 of the required margins they had at 2015 year-end.
- Many names in this list topped out in November (you can glean this from the sparkline). Of note, both JPM and Wells Fargo eclipsed $10bn in margins in November.
- Concentration of the business increases further:
- Top 3 control 52.2% (up from 50.1% in Sep)
- Top 5 control 75.4% (up from 73.7%)
- Top 10 control 97.2% (up from 95.7%)
Seg Futures & Options
Goldman Sachs still the clear #1 in F&O. Other points of interest:
- Goldmans actually topped 25bn in November, the highest amount of required Seg margins for an FCM.
- Soc Gen dropped 2 places in the final quarter, letting Morgan Stanley and Merrill Lynch to hit #3 and #4 respectively.
- Much like in Swaps, Deutsche Bank drops 3 places in Seg
- Concentrations of the business generally unchanged from previous quarter. Top 3, 5, and 10 firms handling 35.1%, 52.7%, and 73.9%, respectively.
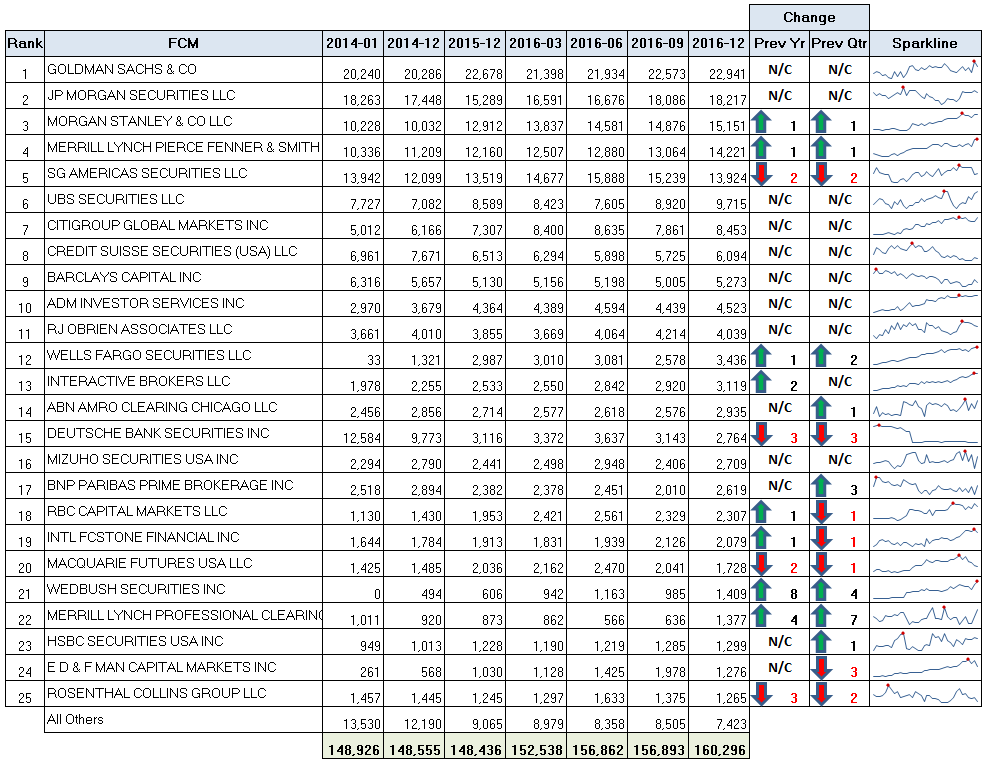
Combined League Table
To wrap up, we have the combined league table, spanning total required margins across all 4 reg classes:
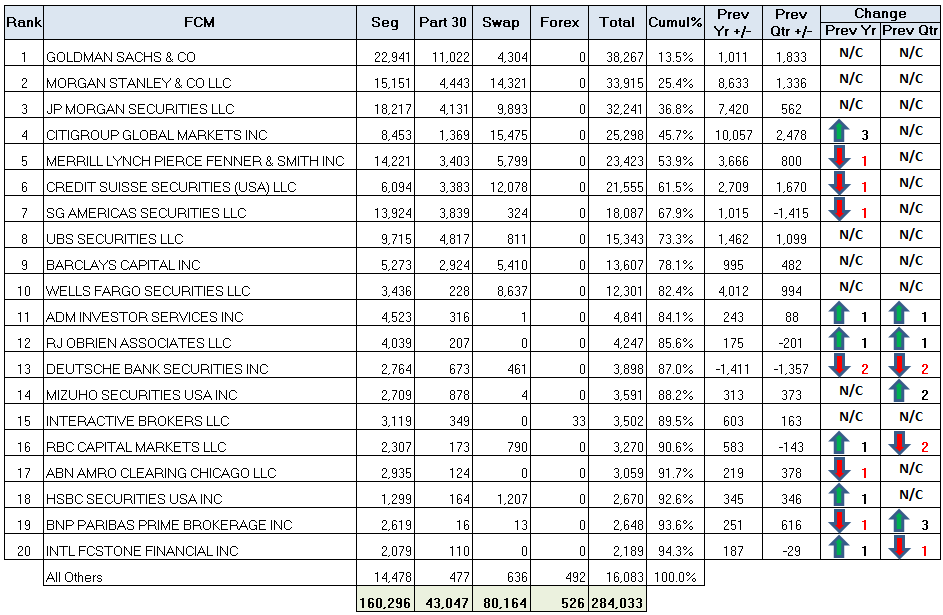
Once again, we have ranking changes for both the full year as well as the previous quarter. Some notables:
- Goldman Sachs clear #1. We saw their Seg futures in the previous section, but interesting to note the scale of their Foreign F&O (Part 30) as it is more than double the next largest firm.
- Citigroup up 3 spots, thanks largely to their increased swaps business. They added over $10bn in required margins in 2016 (from 15 to 25bn)
- Concentration of the overall also slightly up. Top 10 firms now handling 82.4% of the business, up from 80% in June and 81% in September.
Wrapping up
The year closes with the same themes as before. A highly concentrated business, with most of the growth coming in cleared swaps. While Futures & Options are still the largest share of the business, Swaps margins grew by 45% on the year, compared to 8% growth in Seg margins.
Barring the retreat of Deutsche Bank in the last quarter of the year, the European names, while under-performing in relation to US names, did not fare too badly over the course of 2016.
There is a glimmer of hope for the industry as some volatility returns, and more products in the swap asset class are likely to be clearable this year (if not mandatory cleared).
It should be an interesting year, and of course, we’ll be keeping tabs on it.
EDIT 09-Feb-2017: Only hours after publishing this report, Deutsche Bank announced their withdrawal from the US Swap Clearing business. Bloomberg article here.