- GSIBView is the latest data product from ClarusFT.
- We collect and calculate the GSIB scores for 118 banks.
- Data shows how GSIB scores and components change over time.
- Drill-down into components and compare across peer groups.
- This blog looks at funding data, payments data and derivative notionals of RBS, ICBC and Morgan Stanley.
Global Systemically Important Banks
The G-SIB regime is a quantitative assessment of how systemic a bank is. If an institution qualifies as a G-SIB it must hold an additional amount of Tier One capital (CET1, Common Equity Tier 1). The exact amount ranges from an additional 3.5% to zero (see table below).

In 2019, 30 banks qualified for the Bucket 1 designation or higher. They were therefore required to hold at least an additional 1% of Tier One Capital as a result of being classified as a G-SIB.
Tier One capital is expensive. It is typically estimated to carry a cost of around 10-15% per year. This is the expected average Return on Equity that the banking industry operates under.
The 12 Indicators of G-SIB
The 12 indicators over which banks are assessed are as follows:
- Total Exposures – 20% weighting
- Intra-financial system assets – 6.7% weighting
- Intra-financial system liabilities – 6.7% weighting
- Securities Outstanding – 6.7% weighting
- Total Payments – 6.7% weighting
- Assets Under Custody – 6.7% weighting
- Underwriting Activity – 6.7% weighting
- Notional amount of OTC Derivatives – 6.7% weighting
- Trading and AFS Securities – 6.7% weighting
- Level 3 Assets – 6.7% weighting
- Cross-Jurisdictional Claims – 10% weighting
- Cross-Jurisdictional Liabilities – 10% weighting
We’ve blogged twice on this subject, covering some of the intricacies of the regime:
Introducing GSIBView
I created a number of spreadsheets when I was writing the two previous G-SIB blogs, and I quickly realised that some of the analysis I wanted to do just wasn’t going to be possible. Therefore, we’ve introduced a tool, GSIBView, to analyse the GSIB scores and the components. I’ll go over the key details here.
Key goals of the tool are to be able to:
- Track changes in GSIB scores over time per institution.
- Include data on both GSIB and non-GSIB banks.
- Drill-down into the components of each score.
- Compare components across banks.
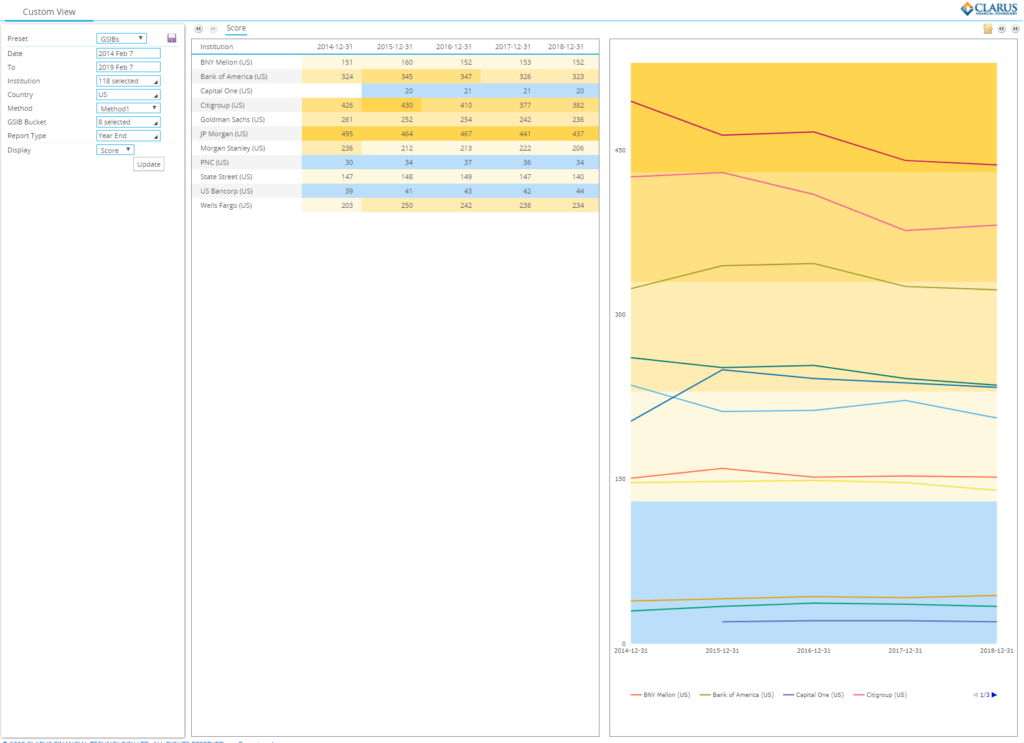
Tracking Changes over Time
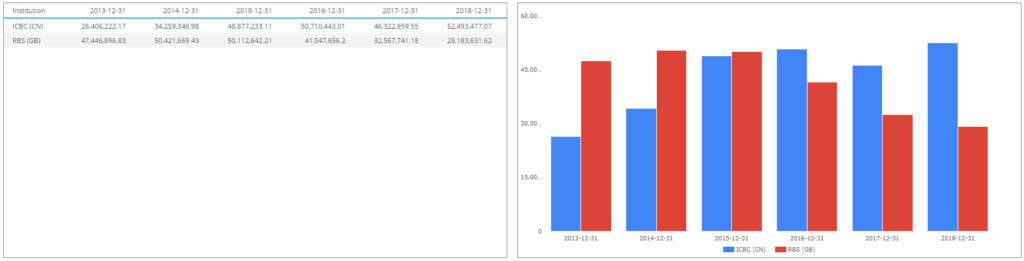
For the purposes of this blog, it is interesting to look at two banks who started 2014 in a similar place from a GSIB perspective – RBS and ICBC.
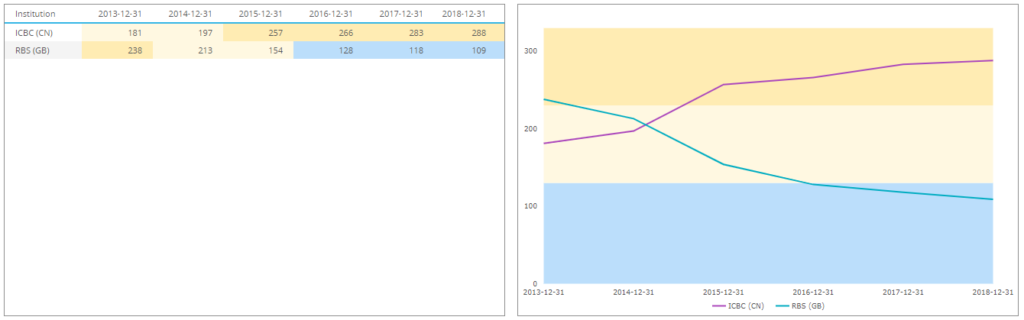
As at end of 2013;
- Both RBS and ICBC hit similar GSIB scores. These were 238 and 181 respectively.
- This put RBS in Bucket 2, requiring an extra 1.5% in Tier 1 capital in 2014. ICBC was in Bucket 1, requiring an extra 1.0% in Tier 1 capital.
- Since that point, RBS has lost its GSIB status and last recorded a GSIB score of 109.
- ICBC has followed a very different path, ending 2018 in the middle of Tier 2, recording a score of 288 and requiring an additional 1.5% in Tier 1 capital as a result.
Analysing Components
For RBS, we can drill-down into the components to see where this drop has come from:
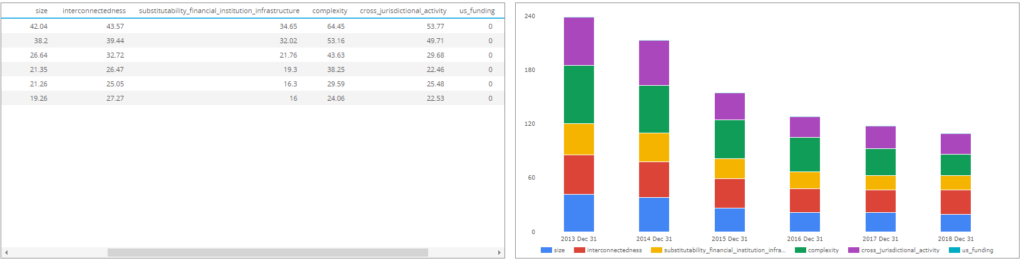
Showing;
- Reductions across all 5 measures under Method1 of GSIB scores.
- On a percentage basis, the biggest reduction has come from the “Inteconnectedness” element of the scores.
- We can drill-down and see where this comes from:
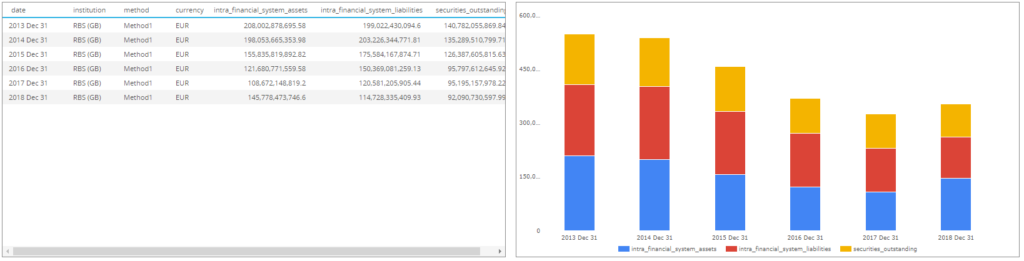
Showing that the 62% reduction in the RBS score for Interconnectedness has been driven by a 70% reduction in intra-financial system assets, a 57% reduction in intra-financial liabilities and a 65% reduction in securities outstanding. Impressive stuff!
We can also see that RBS has drastically reduced the notional of OTC derivatives outstanding:
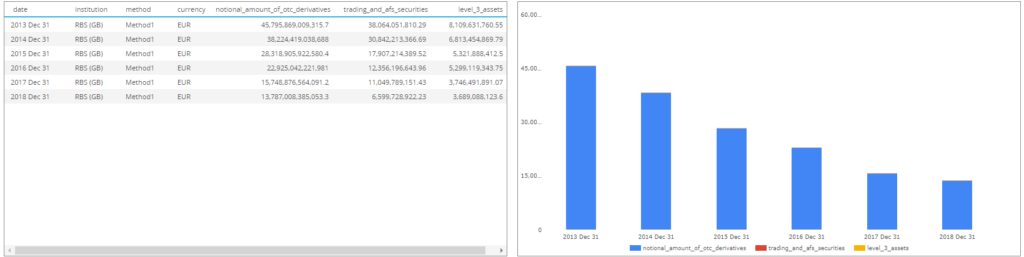
The notional outstanding has reduced from ~$45trn to ~$15trn in the space of 5 years! Thanks compression!
Comparing RBS to ICBC
ICBC has seen increases in all of the GSIB components:
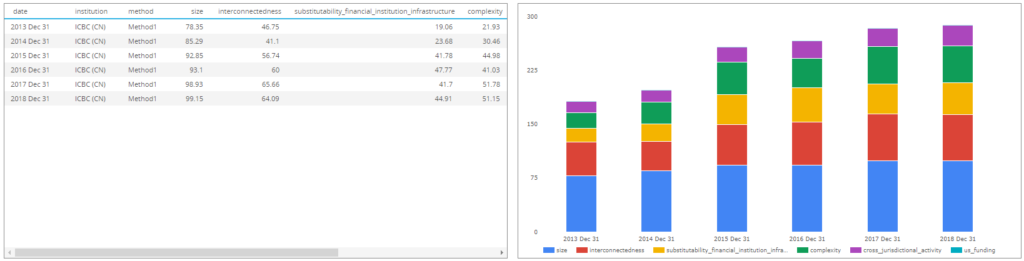
And specifically, the Substitutability and Complexity scores have increased substantially, to 2.3 times 2013 levels.
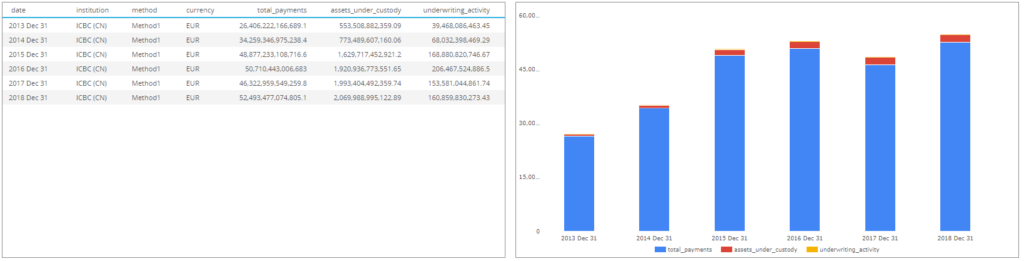
Drilling-down, we can that these increases are due to increased scores for payments for ICBC:
And closer to home for this blog, increases in OTC derivatives notional:

The notional amount of derivatives at ICBC has increased by about four times since 2013! What about compression? This increase really needs to be put in context.
Therefore, we can chart OTC derivatives notional for both ICBC and RBS on the same chart:
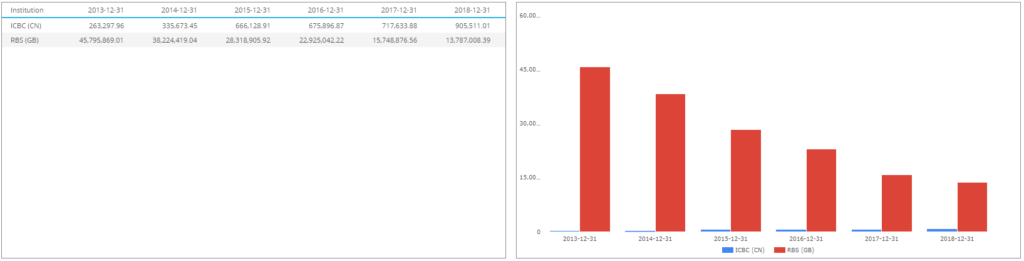
Et voila, we can see that the ICBC total derivatives portfolio is merely a rounding error compared to the total RBS derivatives book!
However, in terms of Payments, the charts are just as instructive. ICBC has notably increased whilst RBS has shrunk:
US Banks
US institutions operate under a slightly different regime to the rest of the World. They also provide quarterly data. The main difference is the inclusion of a “Funding” score, which we can chart and compare on a quarterly basis:
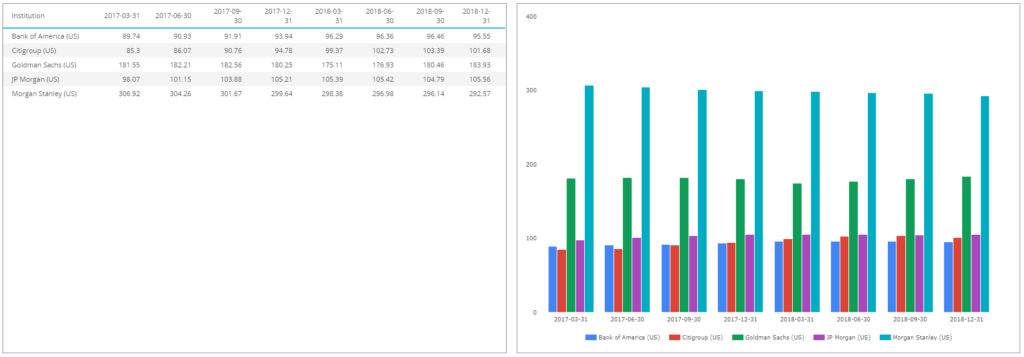
Showing;
- Five of the largest banks (BAML, Citi, JPM, GS and MS) quarterly Funding scores.
- These show the reliance of a bank on short-term wholesale funding, measured as the total amount outstanding of the below instruments, as a proportion of total risk weighted assets.
Clearly Morgan Stanley has a completely different funding strategy to the rest of this group. Nonetheless, the scores are pretty consistent over time.
Accessing GSIBView
For anyone interested to have a play around with our latest data, please contact us.
As a starter, it is interesting to see what happens to the Funding scores when Deutsche is added in to the mix….
Contact us now to get your trial log-in.
In Summary
- We have launched a new data product, GSIBView.
- This includes important metrics for 118 different banks related to how global, how systemic and how replaceable these banks are within the financial system.
- Our tool includes historic data as well as quarterly snapshots for US banks.
- Data can be compared versus historic values and across different banks.
- Contact us now to find out how to access the data, pricing details and the availability of free trials.