ISDA continues to make progress towards providing more certainty about the way forward for derivatives post LIBOR. This includes the calculation of the ‘fallback spread’ which is to be applied to the preferred fallback compounding methodology to minimize value transfer when the fallback is triggered.
The fallback spread is calculated as the 5-year median difference between the relevant LIBOR and the compounded Risk Free Rate (RFR). This means that the spread is constant from the time the fallback is triggered and applied to the derivatives.
However the spread has been volatile as I have previously shown for USD.
Although the median is relatively consistent, the spread can and does vary considerably from the median.
In this blog, I will look at the potential for the USD spread to be significantly different to the median leading into December 2021 when LIBOR is expected to become unusable thereby triggering the fallbacks.
What has happened so far this year?
My previous blog on USD showed the 1 and 3-month spreads in 2020 until 31st March 2020 and projected these to 30th April 2020 (1-month) and 30th June 2020 (3-month).
The time horizons have been extended in this blog past 31st December 2021. I have based the forward rates on Clarus Charm output and checked against market pricing.
As expected, the forward expectations behave as expected. The recent upheavals in LIBOR and SOFR resulting in spreads much higher than the 5-year median have relaxed over the past 2 months to median levels.
The following 1 and 3-month charts show this clearly.
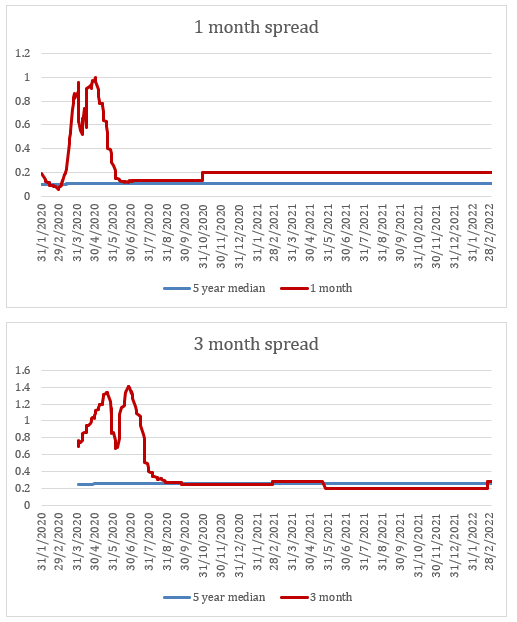
The early 2020 increases in the spread are certainly returning to more ‘normal’ levels. The 1-month topped at 1% (compared with the median of 0.1%) while the 3-month rose as high as 1.4% (compared with the median of 0.25%).
The forward curves (past June 2020) are showing a very benign market until December 2021 with the spread very close to the 5 year medians.
But this is not always the case!
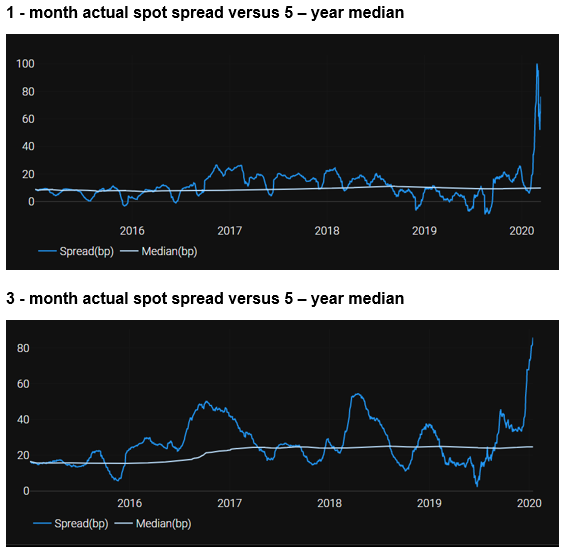
From my previous blog, I have the Charm curves reproduced below. The actual spread does vary considerably and often from the 5-year median.
Medians and averages can be deceiving
The market is certainly pricing a very smooth and benign run into December 2021 for the fallback spread. This reminds me of one of the oldest statistics jokes known:
“Did you hear about the statistician who had his head in an oven and his feet in a bucket of ice?
When asked how he felt, he replied, “On the average I feel just fine.”
In other words, maybe the extremes do matter!
Historically, there is ample evidence to suggest the actual fallback spreads could vary significantly from the 5-year medians in between now and December 2021. And they could be at an extreme level.
If they are very different to the 5-year medians on the final day, there could easily be a ‘cliff’ event as LIBOR is triggered into the fallbacks plus the spread. The rate difference could be very significant if market conditions leading into the cessation lead to LIBOR settings well away from SOFR.
What could a cliff event look like?
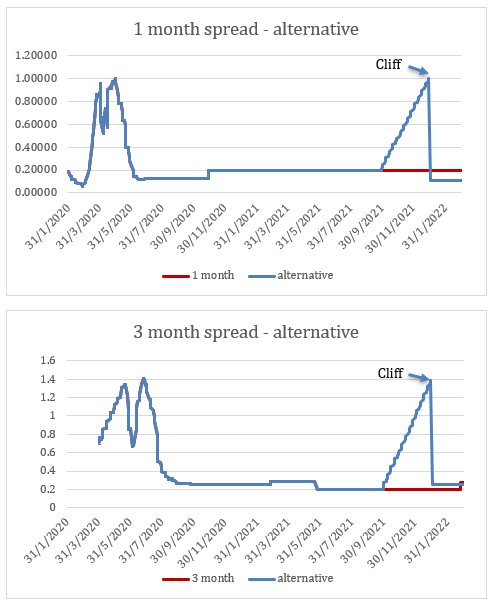
I have added a possible scenario to the charts.
In both the 1 and 3-month cases I added a scenario to gradually increase LIBOR from 1st October 2021 to a maximum replicating the recent (2020) spread increases on 31st December 2021.
Rather predictably, this leads to a cliff event from 31st December 2021 to 3rd January 2022 (next business day in USD). If this should happen then the actual benchmark rate will drop from LIBOR to the realized SOFR plus the 5-year median spread (much lower).
This is a potential change in rate of around 90 basis points in the 1-month and 115 basis points in the 3-month benchmarks.
Could a cliff event happen?
If history is any guide, the current USD market pricing predicting a very flat glide into the 5-year medians for the spread to be applied to 1 and 3-month fallbacks is very possibly optimistic.
If markets have any disruptive event(s) near to December 2021 there could easily be a cliff in the actual LIBOR on 31st December and that in January 2022 or whenever a LIBOR trigger is activated and the ISDA fallbacks are then used in place of LIBOR.
And that would create some ‘interesting’ valuation scenarios.
Modelling and risk management
Although most trading books are obliged to use market rates to value derivatives, some models can be simplistic in their treatment of cliff events. A few options for better understanding the possible valuations are:
- Include a cliff (or step) function in revaluations for derivatives to be used if required;
- Add some scenarios to estimate the potential valuation outcomes in positive and negative cliff events; and
- Manage rate fixes before and after the assumed ISDA trigger date (currently sometime in January 2020).
Clarus IBOR Transition Tools and Microservices can be used to test for these scenarios and can be easily used to calculate valuations across a range of scenarios. This gives an independent valuation for internal use and potentially for external client valuations.
Summary
Market pricing is currently showing a very benign path to the ISDA 5-year median spreads for 1 and 3-month tenors.
History suggests this may be overly optimistic.
In 2020 we have seen very large spot spreads as LIBORs peaked in late March 2020 and SOFR was setting at 0-0.07% for the following 3 months. This situation was driven by market conditions which were beyond the control of market participants.
This may be an extreme position but the spot spread has historically moved relative to the 5-year median: and sometimes this can be a large difference.
It may be unwise to assume the slow glide into December 2021 with no disruptions.
We recommend you test for stress scenarios to accurately model a variety of outcomes.