Clearing Houses have published their latest CPMI-IOSCO Quantitative Disclosures:
- Initial margin for ETD at $449 billion is down 3% QoQ and down 15% YoY
- Initial margin for IRS at $317 billion is down 6% QoQ and up 13% YoY
- Initial margin for CDS at $69 billion is flat QoQ and down 10% YoY
- In 2Q23 a number of CCP quantitative disclosure show record highs
- Highlighted are B3, CCIL, CDCC, CME, DTCC, Eurex, HKEX, ICE, Nasdaq, OCC
- Listen to the Podcast on Apple or Spotify.
- Charts and details below
Background
Under the CPMI-IOSCO Public Quantitative Disclosures, CCPs publish over two hundred quantitative data fields covering margin, default resources, credit risk, collateral, liquidity risk, back-testing and more.
CCPView has over 7 years of these quarterly disclosures for 44 Clearing Houses, each with multiple Clearing Services, covering the period from 30 Sep 2015 to 30 Jun 2023. This disclosure data provides insights into trends over time at one CCP and comparisons between CCPs.
Let’s take a look at the latest disclosures.
Initial Margin for IRS
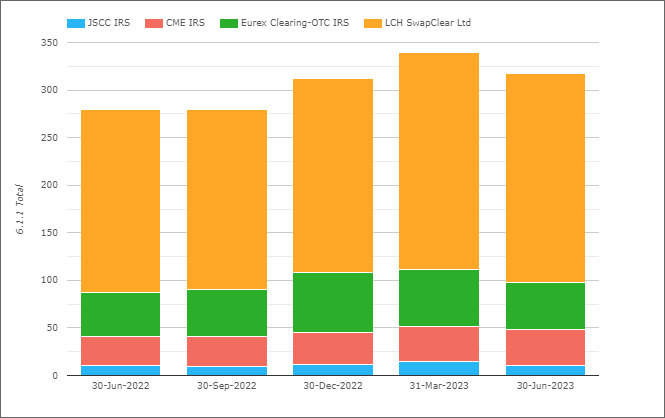
- Total IM for these four CCPs was $317 billion on 30-Jun-2023
- Down $22 billion or -6% QoQ and Up $37 billion or 13% YoY
- LCH SwapClear with $219 billion or £173 billion on 30-Jun-2023
- Down 6% QoQ and Up 9% YoY in GBP terms (Down 4% and Up 13% in USD terms)
- Eurex OTC IRS with $50 billion or €46 billion
- Down €8.6 billion or 16% QoQ and Up €2 billion or 5% YoY (in EUR terms)
- CME IRS with $37.6 billion, Up 5% QoQ and 20% YoY
- JSCC IRS with $10.2 billion or Y1,477 billion, Down 24% QoQ and Up 8% YoY (in JPY terms).
Total IM for IRS at $317 billion, down from record high on 31-March-2023, but still the second highest IM on record. Every CCP is up YoY and down QoQ, except for CME IRS, which is also up QoQ.
Initial Margin for CDS
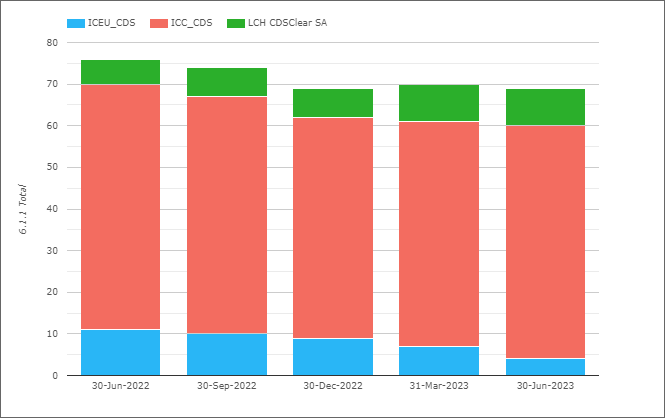
- Total IM for these three CCPs was $69 billion on 31-Jun-2023
- Flat QoQ and Down $7 billion or 10% YoY
- ICE Credit Clear with $55.75 billion, Up 4% QoQ and Down 5% YoY
- LCH CDSClear with €8.1 billion, Up 3% QoQ and 38% YoY
- ICE Europe Credit with €3.8 billion, down 40% QoQ and 64% YoY
ICE Credit Clear and LCH CDSClear both increasing QoQ, while IM at ICE Europe Credit is down again as the October 2023 shutdown approaches.
Initial Margin for ETD
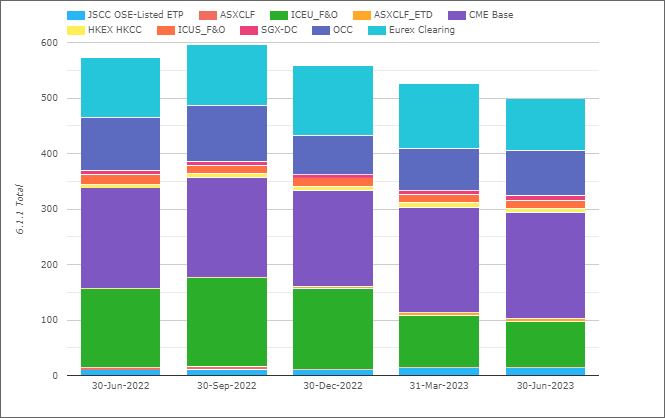
- Total IM for these CCPs was $449 billion on 30-Jun-2023
- Down $14b or 3% QoQ and down $79b or 15% YoY
- (Note the chart shows higher totals as Eurex includes OTC IRS IM, which I exclude)
- CME Base with $191 billion, up 1% QoQ and up 5% YoY.
- ICE Europe F&O with $84 billion, down 12% ($11b) QoQ and down 40% ($57b) YoY
- OCC with $81 billion, up 8% QoQ and down 15% ($14b) YoY.
- Eurex with $44 billion, down 18% QoQ and down 30% YoY.
- ICE US F&O $15.3 billion, down 3% QoQ and down 11% YoY.
- JSCC OSE Listed ETP with $14 billion, down 2% QoQ and Up 33% YoY
- HKEX HKCC with $7 billion, down 8% QoQ and down 2% YoY
- SGX-DC $9.5 billion, up 16% QoQ and up 22% YoY
- ASX CLF $4.6 billion, down 5% QoQ and down 10% YoY
Most CCPs IM is down QoQ, except for CME Base, OCC and SGX-DC.
Most CCPs IM is also down YoY, except for CME Base, JSCC OSE Listed ETP and SGX-DC.
Other Disclosures of Interest
Next let’s do a quick scan of 30-Jun-23 disclosures, highlighting those with significant changes.
- B3 (Brasil Bolsa Balcao) – 6.2.15 Client IM PreHaircut, Total IM Held was $125 billion, up from $113 billion and a new record high
- B3 – 19.1.1. Number of clients (accounts?) was 697,272, up from 604,786 in the prior quarter and 476,234 on 30-Jun-2019
- BME – BMEC_Repo 4.4.8 Number of days on which the estimated largest stress loss (in excess of IM) that would be caused by the default of any two participants exceeded actual pre-funded default resources was 1, though the amount in 4.4.9 shows 0?
- CCIL (Clearing Corporation of India) – Forex 4.4.8 shows 8 days and 4.4.9 gives the amount in excess as $48.7 million, while Securities show 9 days and 4.4.9 with $147 million, other CCIL services (Forwards, Rupee Derivatives, Securities Tri-party Repo) show 0 days
- CDCC (Canadian Derivatives Clearing Corporation) – 6.8.1 Maximum aggregate IM call on any given business day as $4.3 billion, the highest on record with a prior high of $1.8 billion in the quarter ending 30-Dec-2022
- CME Base – 4.4.8 Number of days on which the estimated largest stress loss (in excess of IM) that would be caused by the default of any two participants exceeded actual pre-funded default resources was 1 with 4.4.9 Amount Exceeded showing $390 million. The last time this happened was in the quarter ending 31-Mar-2018, when the excess was $316 million
- CME Base – 7.3.1 Estimated largest same-day and where relevant multi-day payment obligation that would be caused by the default of a single particpant in extreme but plausible market conditions was $24.7 billion, a new high and up from $21.8 billion in the prior quarter
- DTCC GSD – 6.6.1 Average Total VM paid to the CCP by participants was $6.9 billion, a new high and up from $5.6 billion and $4.3 billion in prior quarters
- ECC (European Commodity Clearing) – 6.1.1 Total IM required is $17 billion, down from $19.5 billion in the prior quarter and down from the record high of $55 billion on 30-Sep-2022
- Eurex Clearing – 4.1.8 Committed aggregate participant commitments to address an initial particpant default is €15.9 billion up from €8.9 billion, while 4.1.9 Committed aggregate participant commitments to replenish the default fund is €8 billion, up from €4.5 billion
- HKEX HKCC – Default fund resources are up, 4.1.1. Prefunded Own Capital is $89 million up from $62 million, 4.1.4 Prefunded Aggregate Participants Contributions Required are $466 million, up from $227 million and 4.1.8 Committed aggregate participant commitments to address an initial particpant default are $933 million, up from $455 million.
- ICE Clear Credit – 6.2.5 Client IM PreHaircut held as Soverign Bonds Domestic (so UST) is $26.3 billion, the highest on record and up from $20 billion in the prior quarter
- ICE Clear Europe – 16.2.2 Percentage of total participant cash held as cash deposit as central bank of issue of currency deposited was 12.04%, up from 9.44% and a record high
- LCH Clearnet Ltd – 16.2.13 Percentage of total participant cash invested in securities; state/municipal bonds is 1.64%, the first time it has been non-zero
- Nasdaq Clearing – Financial Markets 6.8.1 Maximum aggregate IM call on any any day in the period was SEK 50 billion (USD 4.6 billion!), up from SEK 2 billion (USD 191 million) in the prior quarter.
- Nasdaq Clearing – Commodities 6.8.1 Maximum aggregate IM call on any any day in the period was EUR 4.9 billion, up from EUR 81 million in the prior quarter
- OCC – 7.3.1 Estimated largest same-day and where relevant multi-day payment obligation that would be caused by the default of a single particpant in extreme but plausible market conditions was $12 billion, a new high and up from $5.8 billion in the prior quarter and the prior high was $9.3 billion in the quarter ending 31-Dec-2022
- …….
- ….. we could go on and on and on …..
There are a lot more Clearing Services and Disclosures but I will stop there and leave it to those of you with your own CCPView access to analyze further changes.
As well as a Web UI, we also offer an API to programatically access this data.
IOSCO Quantitative Disclosures
CCPView has disclosures from 44 Clearing Houses, each with many Clearing Services, covering Equities, Bonds, Futures, Options and OTC Derivatives with over 200 quantitative data fields each quarter and quarterly figures from September 2015 to June 2023.
If you are interested in this data, please get in touch.