Clearing Houses have published their latest CPMI-IOSCO Quantitative Disclosures:
- Initial margin for ETD at $547 billion is up 4% QoQ and up 16% YoY
- Initial margin for IRS at $281 billion is a touch higher QoQ (record high) and up 12% YoY
- Initial margin for CDS at $74 billion is down 3% QoQ and up 23% YoY
- A number of CCP disclosures show record highs since reporting began in Sep 2015
- Including B3, CCIL, CDCC, ECC, Eurex, ICE Europe F&O, LCH RepoClear and SwapClear …
- Continue reading for charts and details
Background
Under the CPMI-IOSCO Public Quantitative Disclosures, CCPs publish over two hundred quantitative data fields covering margin, default resources, credit risk, collateral, liquidity risk, back-testing and more.
CCPView has 7 years of these quarterly disclosures for 44 Clearing Houses, each with multiple Clearing Services, covering the period from 30 Sep 2015 to 30 Sep 2022. This disclosure data provides insights into trends over time at one CCP and comparisons between CCPs.
Let’s take a look at the latest disclosures.
Initial Margin for IRS
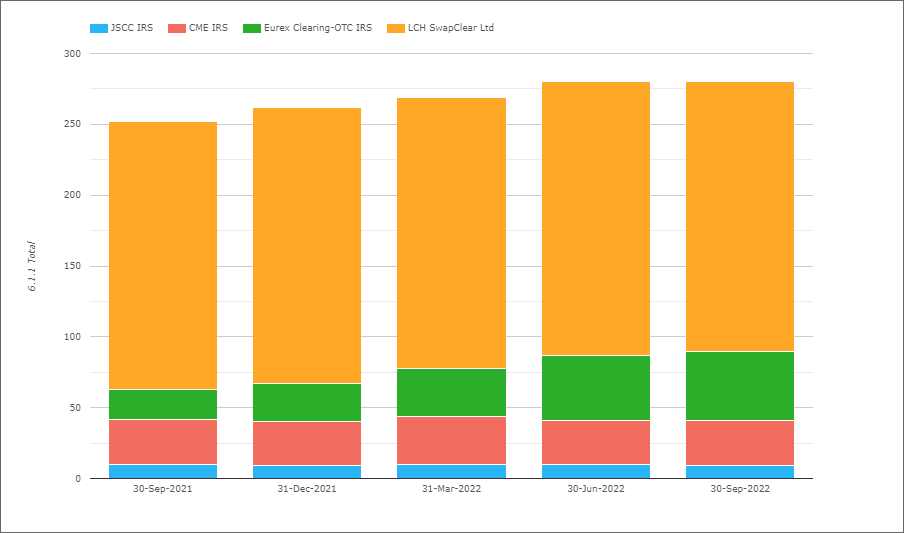
- Total IM for these four CCPs was $281 billion on 30-Sep-2022
- Up $0.66 billion or 0.2% QoQ and $29 billion or 12% higher YoY
- LCH SwapClear with $190 billion or £172 billion on 30-Sep-2022
- Up 8% QoQ and 23% YoY in GBP terms (down 1.6% and 0.5% in USD terms)
- Eurex OTC IRS with $49 billion or €51 billion
- Up €6 billion or 15% QoQ and €33 billion or 180% YoY (in EUR terms)
- CME IRS with $32.4 billion, up 3% QoQ and up 1% YoY
- JSCC IRS with $9 billion or Y1,348 billion, down 1% QoQ and up 19% YoY (in JPY terms).
Total IM for IRS at $281.1 billion, is just above the record high of $280.5 billion on 30-Jun-22.
Eurex OTC IRS continuing to increase significantly QoQ and YoY .
Initial Margin for CDS
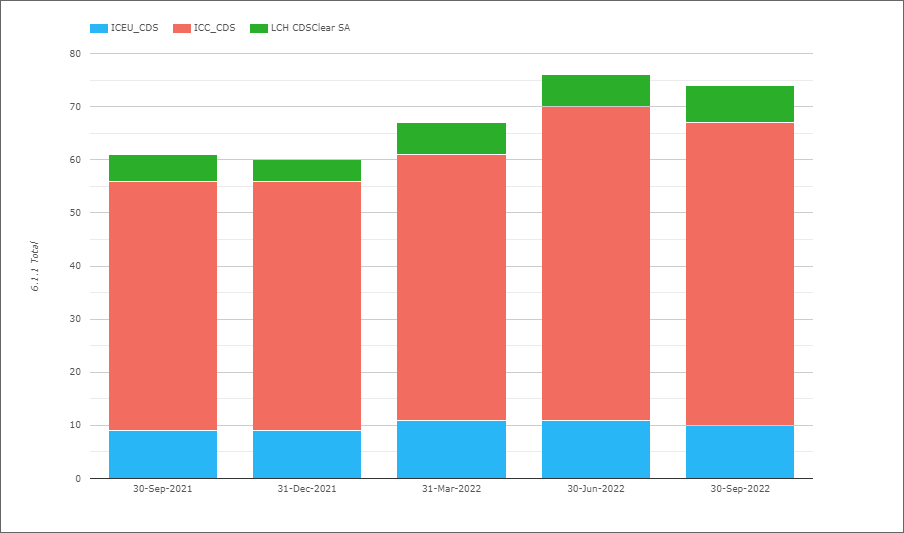
- Total IM for these three CCPs was $74 billion on 30-Sep-2022
- Down $2 billion or 3% QoQ and up $14 billion or 23% YoY
- ICE Credit Clear with $57 billion, down 3% QoQ and up 22% YoY
- ICE Europe Credit with €10.2 billion, down 4% QoQ and up 30% YoY
- LCH CDSClear with €7.25 billion, up 23% QoQ and up 83% YoY
LCH CDSClear increasing significantly QoQ and YoY.
Initial Margin for ETD
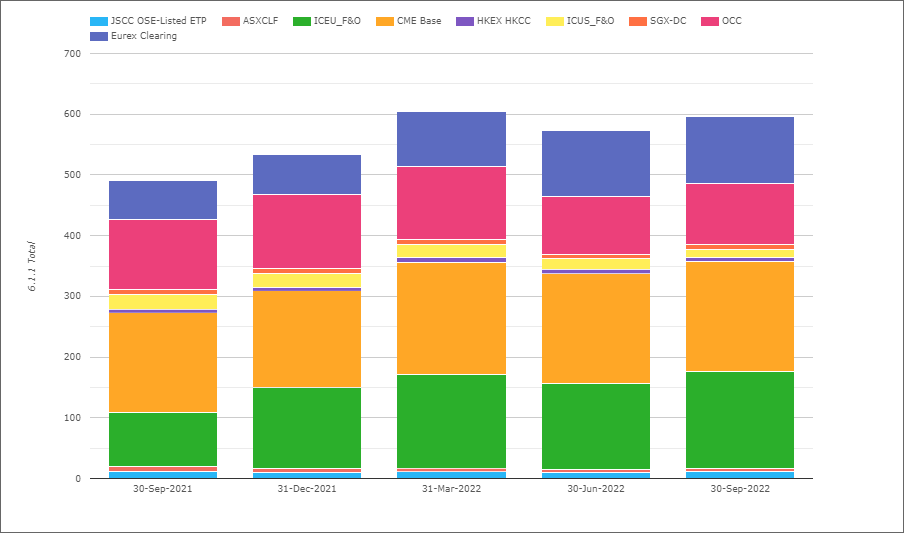
- Total IM for these CCPs was $547 billion on 30-Sep-2022
- Up $19b or 4% QoQ and up $77b or 16% YoY
- (Note the chart shows higher totals as Eurex includes OTC IRS IM, which I exclude)
- CME Base with $180 billion, down 1% QoQ and 3% YoY.
- ICE Europe F&O with $161 billion, up 14% QoQ and 4.5% YoY
- OCC with $100 billion, up 6% QoQ and down 17% YoY.
- Eurex with $62 billion, down 2% QoQ and 32% YoY.
- ICE US F&O $14 billion, down 17% QoQ and 34% YoY.
- JSCC OSE Listed ETP with $10.7 billion, up 2% QoQ and down 12% YoY
- HKEX HKCC with $6.5 billion, down 10% QoQ and up 21% YoY
- SGX-DC $8.4 billion, up 20% QoQ and 22% YoY
- ASX CLF $4.5 billion, down 11% QoQ and 13% YoY
ICE Europe F&O and SGX-DC with >10% QoQ increases.
ICE US F&O and HKEX HKCC with >10% QoQ decreases.
Other Disclosures of Interest
Next let’s do a quick scan of 30-Sep-22 disclosures, highlighting a few historically significant ones, with a number of new record highs:
- B3 (Brasil Bolsa Balcao) – 4.4.6 Actual largest aggregate credit exposure (in excess of IM) to any single participant, PeakDayAmount was $230 million, up from $28 million and the highest in our 4Y lookback period, with the prior high being $161 million on 29-Mar-2018
- CCIL (Clearing Corporation of India) – Rupee Derivatives (MIBOR) – 4.1.4 Prefunded -Aggregate Participant Contributions Required was $152 million, up from $113 million and a record high, while 4.4.3 Estimated largest stress loss (in excess of IM) from the default of any single participant PeakDayAmount, was $113 million, up from $76 million and also a record high
- CDCC (Canadian Derivatives Clearing Corporation)– 6.1.1. Client Gross IM required was $2.35 billion, up from $2.1 billion and a new record high
- CDS (Canadian Depository for Securities) – 6.5.1.1 Number of time over the past 12m that margin coverage held against any account fell below the actual mark-to-market exposure of that account was 29, up from 25, 19 & 15 at prior quarters.
- ECC (European Commodity Clearing) – 6.1.1. Client Gross IM required was $53.85 billion, up from $46.5 billion and $44 billion in prior quarters
- ECC (European Commodity Clearing) – 6.7.1 Maximum total variation margin paid to the CCP on any business day was $7billion and 6.8.1 maximum aggregate initial margin call on any given business day was $15.9 billion, compared to $5 billion and $19.8 billion in prior quarters
- Eurex Clearing – 6.1.1. Client Gross IM required was €34.2 billion, up from €29.1 billion and 6.1.1. House Net IM required was €41.25 billion, up from €37.4 billion, both record highs
- Eurex Clearing – 7.3.5 Estimated largest same-day payment obligation in EUR that would be caused by the default of a single particpant in extreme but plausible market conditions was €17 billion, up from €10.3b, €13b, €8.7b in prior quarters and in USD it was $6 billion, up from $1.9b, $3.7b, $2.1b, both record highs.
- Eurex Clearing – 14.1.1 Total client positions as a share of notional values or of the settlement value of securities transactions held in individually segregated accounts was 20.25%, up from 17.5% and 15.2% in prior quarters and a record high, with omnibus now down to 79.75% from 96% on 30-Sep-2015.
- ICE Europe F&O – 7.3.4 Actual largest intraday and multiday payment obligation of a single participant over the past 12-months, peak day amount was $7.8 billion, up from $5.5 billion and the highest on record
- ICE Europe F&O – 16.1.1 Total cash (but not securities) received from participants, regardless of how held, received as initial margin was $107 billion, up from £90 billion and a record high
- LCH Ltd – RepoClear – 6.5.1.1 Number of times over the past 12-months that margin coverage on any account fell below the actual mark-to-market exposures was 128, up from 2 in the prior quarter and 6.5.4 where breaches of initial margin coverage occurred, size of uncovered exposure, peak size was $1 billion, a new high, the prior high being $553 million in the 30-Jun-2021 quarter
- LCH Ltd – RepoClear -6.8.1 Maximum aggregate IM call on any given day in the period was $3.1 billion, a new high, up from $1.75 billion with the prior high $2.4 billion in 29-Dec-the 2017 quarter
- LCH Ltd – SwapClear – 6.5.1.1 Number of times over the past 12-months that margin coverage on any account fell below the actual mark-to-market exposures was 13,432, up from 8,117, 4,365 and 1,664 in prior quarters; a record high, while 6.5.4 peak size of uncovered exposure was $771 million, just below the prior high of $774 million in 30-Jun-2021 quarter.
- …..
- …..
There are a lot more Clearing Services and Disclosures but I will stop there and leave it to those of you with your own CCPView access to analyze further changes.
As well as a Web UI, we also offer an API to programatically access this data.
IOSCO Quantitative Disclosures
CCPView has disclosures from 44 Clearing Houses, each with many Clearing Services, covering Equities, Bonds, Futures, Options and OTC Derivatives with over 200 quantitative data fields each quarter and quarterly figures from September 2015 to 2022.