Clearing houses published in December their latest CPMI-IOSCO Quantitative Disclosures for Q3 2025.
Key takeaways
On 30 September 2025:
- Initial margin (IM) for nine selected IRS CCPs was $362 billion – down 0.8 percent QoQ, but up 4.3 percent YoY.
- IM for cleared CDS was $70.9 billion – up 0.6 percent QoQ, and up 11.7 percent YoY, but well below the peak of $77 billion in Q2 2022.
- IM for major ETD CCPs was a new record of $627 billion – up 7.7 percent from the prior quarter’s peak of $582 billion, and up 22 percent YoY. OCC was a prominent factor in the increase.
- For major CCPs, we also highlight eye-catching changes in quantitative disclosures other than IM, including for CME, DTCC, Eurex, HKEX, ICE, LCH, OCC.
Background
Under the CPMI-IOSCO Public Quantitative Disclosures, central counterparties (CCPs) publish over 200 quantitative data fields covering margin, default resources, credit risk, collateral, liquidity risk, back-testing, and more.
CCPView has more than 8 years of these quarterly disclosures for 44 clearing houses, each with multiple Clearing Services, covering the period from 30 September 2015 to 30 September 2025. This disclosure data provides insights into trends over time at one CCP, and comparisons between CCPs.
Let’s look at the latest disclosures. I also include charts of cleared open interest (OI) or notional outstanding to compare their dynamic with that of IM.
IM for IRS
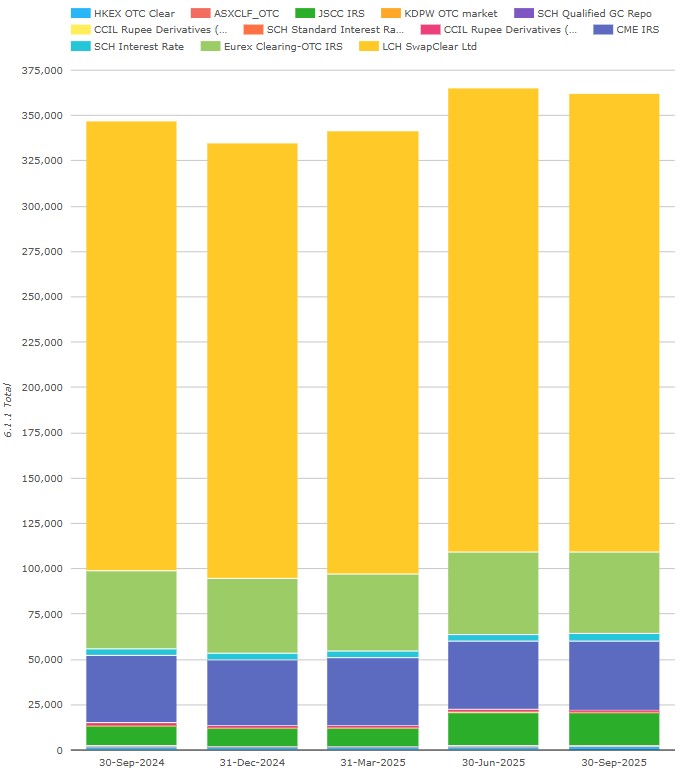
Chart 1a: IRS IM by CCP ($ millions). Source: CCPView
Chart 1a includes IRS IM from five other CCPs along with the four major CCPs (which are consistently 98 percent of the total IM).
All nine CCPs disclosed in total $362 billion on 30 September 2025 – down 0.8 percent or $3.0 billion from the Q2 2025 record, but up $15.1 billion or 4.3 percent YoY. The main cause of the QoQ decline in total IM was the decline in the GBP FX rate versus USD, which more than offset the QoQ increase in GBP IM at LCH SwapClear.
- LCH SwapClear reported $252 billion or £188 billion – down QoQ 1.3 percent in USD terms but up 0.7 percent QoQ in GBP terms, and up 1.7 percent YoY in GBP terms, but below its high of £192 billion in Q4 2024.
- Eurex OTC IRS had $45.4 billion or €38.6 billion – in EUR terms, down 0.3 percent QoQ, and down 0.2 percent YoY, and below its high of €59.4 billion in Q4 2022.
- CME IRS disclosed $38.1 billion – up 2.0 percent QoQ, and up 3.3 percent YoY to a new record, exceeding its previous high of $37.6 billion in Q2 2022.
- JSCC IRS revealed $18.0 billion or ¥2.66 trillion – in JPY terms, down 1.2 percent QoQ from the Q2 high of ¥2.69 trillion, but up 71 percent YoY.
The five other CCPs were:
- Shanghai Clearing (from China), with $3.87 billion.
- HKEX OTCClear (from Hong Kong). This was the only one of these five CCPs with a material QoQ increase in IM at $2.10 billion – up 15 percent QoQ, and up 19 percent YoY.
- CCIL (from India), with $1.42 billion from MIBOR and MIFOR, combined.
- ASX (from Australia), with $259 million.
- KDPW (from Poland), with $229 million.
For comparison, we show notional volumes over the same five quarters.
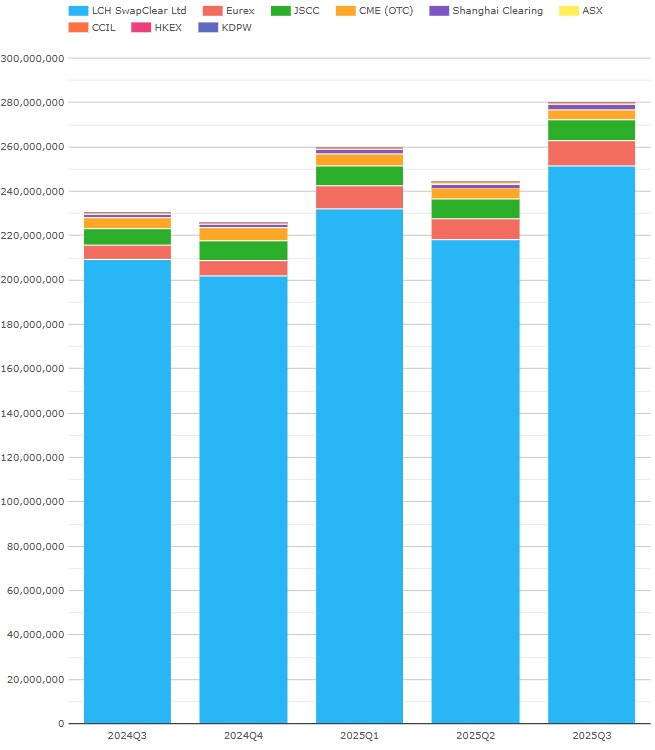
Chart 1b: IRS notional volumes by CCP ($ millions). Source: CCPView
Chart 1b shows that IRS volumes for our nine CCPs were $280 trillion in Q3 0225 – up 15 percent QoQ, and up 22 percent YoY.
- On big four QoQ growth, both SwapClear and Eurex grew volumes by about 15 percent, while Eurex (not shown) grew open interest by about 10 percent compared to 7 percent at SwapClear. Both CCPs had almost flat IM, as noted earlier. This suggests that aggregate portfolio risk has not yet shifted to Eurex, despite volumes moving because the go-live of Active Account Requirement (AAR) in June 2025 has shifted volumes, as noted in our recent blog on Q3 CCP competition.
- Of the smaller five CCPs, most had decreases or limited percentage increases in IRS volume. The exception was Shanghai Clearing, which grew IRS volumes QoQ by 32 percent and YoY by 93 percent. This was helped by SwapConnect starting of clearing in Q3 2024 – also discussed in the blog linked above.
IM for CDS
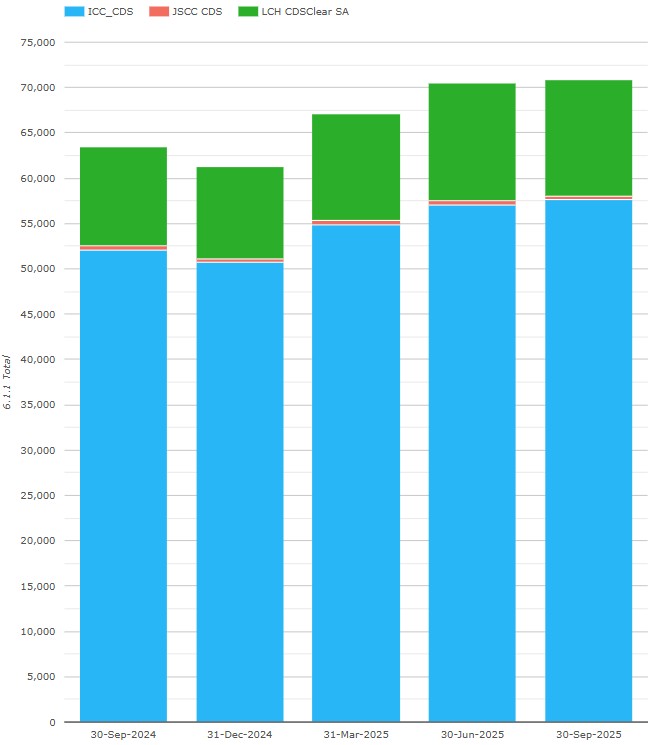
Chart 2a: CDS IM by CCP ($ millions). Source: CCPView
Chart 2a shows that IM at major CDS CCPs totaled $70.9 billion on 30 September 2025 – up 0.6 percent QoQ, and up 11.7 percent YoY, but below its peak (not shown) of $77.0 billion in Q2 2022.
- ICE Credit Clear disclosed $57.6 billion – up 0.9 percent QoQ, and up 10.7 percent YoY, just below peak (not shown) of $58.8 billion in Q2 2022.
- LCH CDSClear reported $12.9 billion or €11.0 billion – in EUR terms, down 0.9 percent QoQ from the prior quarter high, but up 12.2 percent YoY.
- JSCC CDS reported $415 million or ¥61.5 billion – in JPY terms, down 2.4 percent QoQ, and down 4.4 percent YoY, well below its ¥184 billion peak in Q1 2020.
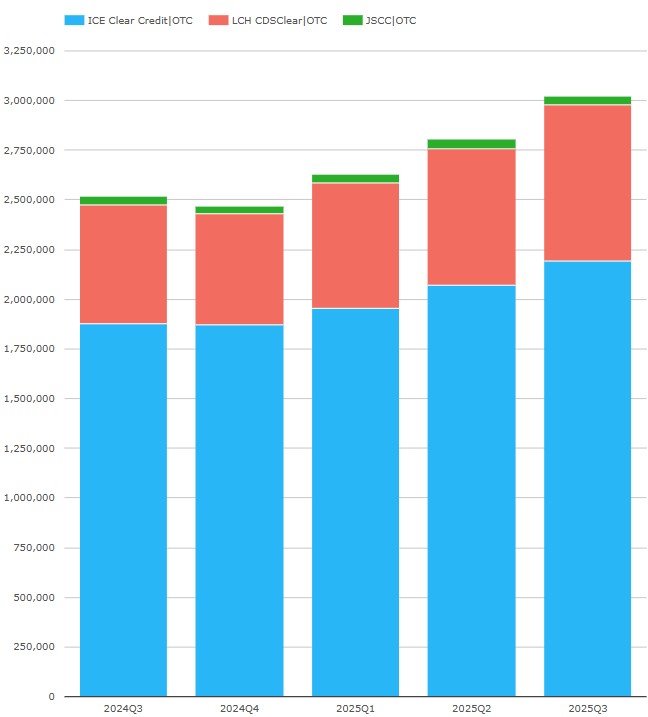
Chart 2b: CDS OI by CCP ($ millions). Source: CCPView
Chart 2b shows that CDS OI reached a third consecutive monthly high at both ICE Clear Credit and LCH CDSClear, while IM barely increased.
Note that the ICE Clear Credit Q2 disclosure of IM was corrected from 50.6 billion to 57.1 billion since we published the prior version of this blog. This addresses the point raised at this stage in our prior blog.
IM for ETD (all asset classes)
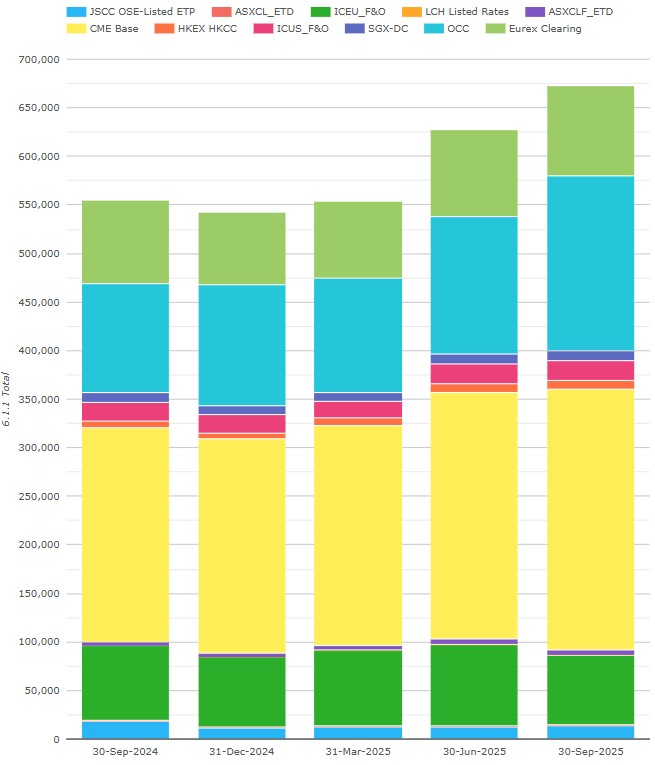
Chart 3: ETD IM by CCP ($ millions) Source: CCPView
IM at our selected ETD CCPs was $627 billion on 30 September 2025 – up QoQ by 7.7 percent ($44.9 billion), and up YoY by 22 percent ($115 billion). This is a new record, exceeding the prior quarter’s peak of $582 billion. (The chart shows higher totals as it includes Eurex OTC IRS IM, which are excluded from the figures noted).
- CME disclosed $269 billion – up 5.7 percent QoQ, and up 22 percent YoY.
- OCC had $180 billion – up 27 percent QoQ, and up 59 percent YoY.
- ICE Europe F&O declared $72.3 billion – down 13.6 percent QoQ, and down 6.3 percent YoY.
- Eurex divulged $47.4 billion – up 7.0 percent QoQ, and up 9.9 percent YoY.
- ICE US F&O showed $20.8 billion – up 2.1 percent QoQ, and up 5.2 percent YoY.
- JSCC OSE Listed ETP reported $13.4 billion – up 5.9 percent QoQ, but down 26 percent YoY.
- SGX-DC had $10.4 billion – up 11.4 percent QoQ, and up 9.3 percent YoY.
- HKEX HKCC declared $8.4 billion – down 9.7 percent QoQ, and up 37 percent YoY.
- ASX CLF ETD and ASX CL ETD combined divulged $5.93 billion – down 3.9 percent QoQ, and up 18 percent YoY.
- LCH Listed Rates reported IM of $29 million – up about 380 percent QoQ from $6 million, after first clearing in Q3 2024.
For comparison, we look at the corresponding quarterly rates ETD notional volumes, in table form for visibility of the smaller players.
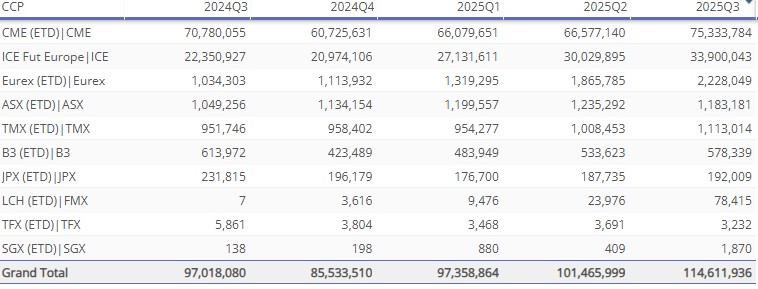
Table 1: rates ETD notional volumes by CCP ($ millions). Source: CCPView
Table 1 shows that the volume increases align with the margin increases in chart 3 for many of the CCPs. Notably LCH/FMX volumes were up about fourfold QoQ, while CME SOFR futures (not shown) declined. Let’s keep an eye on FXM for the next few quarters.
Other disclosures of interest
We can use a CCPView feature to highlight metrics that change significantly more than 10 percent. Let’s use this to scan Q2 2025 disclosures for the major clearing houses.
- CME Base reported KCCP (4.2.1) of 78 – up QoQ from 37, and down YoY from 177.
- CME reported maximum total variation margin paid to the CCP on any business day came down to $12.8 billion from the prior quarter record of $30.8 billion.
- CME reported its peak in Q3 2025 of the top five clearing members’ fraction of client transactions as 79 percent – up QoQ from 70 percent.
- DTCC GSD (providing US Treasury bond cash and repo clearing as discussed in my ION Markets Blogs) reported the top five clearing members’ percentage of client transactions increased to an average over the quarter of 45 percent from 36 percent and a peak in the quarter in increased to 51 percent from 43 percent. Simply put, this is a significant increase in concentration in the UST repo client clearing business.
- DTCC MBSCC (providing mortgage-backed securities clearing) disclosed KCCP (4.2.1) back down at 14 after jumping up to 88 in the prior quarter.
- DTCC NSCC (providing equities and corporate bond clearing) reported total IM (6.1.1) at $13.7 billion after a record $19.7 billion in the prior quarter.
- Each of the three DTCC services (GSD, MBSCC, NSCC) disclosed profits (15.2.3) up QoQ more than 10 percent. Specifically, each of GSD and MBSC have shifted from negligible profits in Q3 2022 to $125 million in Q3 2025.
- Eurex OTC IRS clearing excesses of marked-to-market exposure above margin coverage (6.5.1.1) reduced to 385 – down QoQ from 484.
- Eurex group maximum VM (6.7.1) and IM (6.7.2) fell further to €4,640 million and €2,213 million respectively – down from €9,703 million and €6,729 million respectively in the prior quarter.
- HKEX SEOCH (the Securities Exchange of Hong Kong Options Clearing House Ltd) disclosed total IM (6.1.1) of HKD 32,849 million – up 32 percent from HKD 24,982 in the prior quarter.
- HKEX HKSCC (Hong Kong Securities Clearing Corporation) showed average daily volumes (23.1.1) and daily notional value (23.1.2) as follows:
- ETD saw 15,677 contracts with a notional value of HKD 230 billion – up QoQ from 12,206 contracts and HKD 183 billion, respectively.
- Shanghai Stock Exchange trades saw 12.2 billion shares with a notional value of CNY 20.6 billion – up QoQ from 7.14 billion shares and CNY 10.5 billion, respectively. This is HKEX’s Shanghai Connect initiative.
- Shenzhen Stock Exchange trades were 10.3 billion shares and CNY 22.3 billion respectively – up QoQ from 5.90 quadrillion shares and CNY 11.1 billion, respectively. This is HKEX’s Shenzhen Connect initiative.
- ICE ClearCredit CDS clearing service showed average client clearing member concentration (19.1.3.2/4) at 46 percent to the top five and 54 percent to the top ten – down QoQ from 83 percent to the top five and 100 percent to the top ten.
- ICE Europe Futures exchange showed KCCP (4.2.1) at 205 – up QoQ from 157.
- LCH SwapClear disclosed its number of direct members that clear for clients (19.1.2) as 62 – down from the prior quarter peak of 69.
- LCH ForexClear showed its number of direct members (18.1.1.2) as 19 – up QoQ from 17.
- LCH CDSClear SA’s maximum total daily VM paid (6.7.1) and maximum daily aggregate IM call (6.8.1) were €516 million and €1.39 billion respectively – up QoQ from €338 million and €1.23 billion, respectively.
- OCC’s mean over 12 months largest aggregate stress loss (4.4.3) was $7,224 million – up QoQ from $6,932 and up YoY from $4,888 million. Their maximum aggregate IM call on any day in the period (6.8.1) was $5,147 million – down QoQ from $25,169 million.
- OCC’s USD options average daily volumes (23.3.1) was 60.8 million contracts – up QoQ from 57.2 million contracts and up YoY from 48.7 million contracts.
There are many more disclosures for non-major clearing houses, but we will stop there for today and leave those of you with CCPView access to analyze further.
End note
Flip back to the start of the blog to recap the takeaways.
CCPView has disclosures from 44 clearing houses, each with many Clearing Services covering equities, bonds, futures, options, and OTC derivatives – with over 200 quantitative data fields with supporting notes each quarter covering Q3 2015 to Q3 2025.
The disclosures tab can be used to select a subset of CCPs and disclosures, chart the quantitative disclosures over multiple quarters, and highlight QoQ changes above a percentage which you can configure. In addition to a Web UI, we offer an API to access this data programmatically.
If you’re interested in using CCPView, get in touch.