Clearinghouses published at the end of December their latest CPMI-IOSCO Quantitative Disclosures for Q4 2025.
Key takeaways
On 31 December 2025:
- Initial margin (IM) for eight selected cleared rates OTC derivatives CCPs was $358 billion – down 0.7 percent quarter-on-quarter (QoQ), but up 7.5 percent year-on-year (YoY). This was powered by JSCC’s 67 percent increase. IM decreased slightly QoQ despite a 7 percent increase in notional cleared.
- IM for cleared CDS was $70.5 billion – down 0.45 percent QoQ, but up 15 percent YoY. ICE Clear Credit had the largest QoQ and YoY IM increases. IM declined by 0.45 percent QoQ, while cleared CDS open interest (OI) declined by 8.4 percent.
- IM for 10 selected ETD CCPs was a $613 billion – down by 2.3 percent QoQ, and up by 22 percent YoY. The CCPs were split 5 to 5 between increases and decreases QoQ, and 6 to 4 between increases and decreases YoY.
- For major CCPs, we also highlight eye-catching changes in other quantitative disclosures, including for CME, DTCC, HKEX, ICE, LCH, OCC.
Background
Under the CPMI-IOSCO Public Quantitative Disclosures, central counterparties (CCPs) publish over 200 quantitative data fields covering margin, default resources, credit risk, collateral, liquidity risk, back-testing, and more.
We focus on IM for cleared rates and credit swaps and for ETD, including charts of cleared volumes or open interest (OI) to allow comparison of their dynamic with that of IM. We also highlight eye-catching non-IM disclosures for major CCPs.
IM for cleared rates swaps
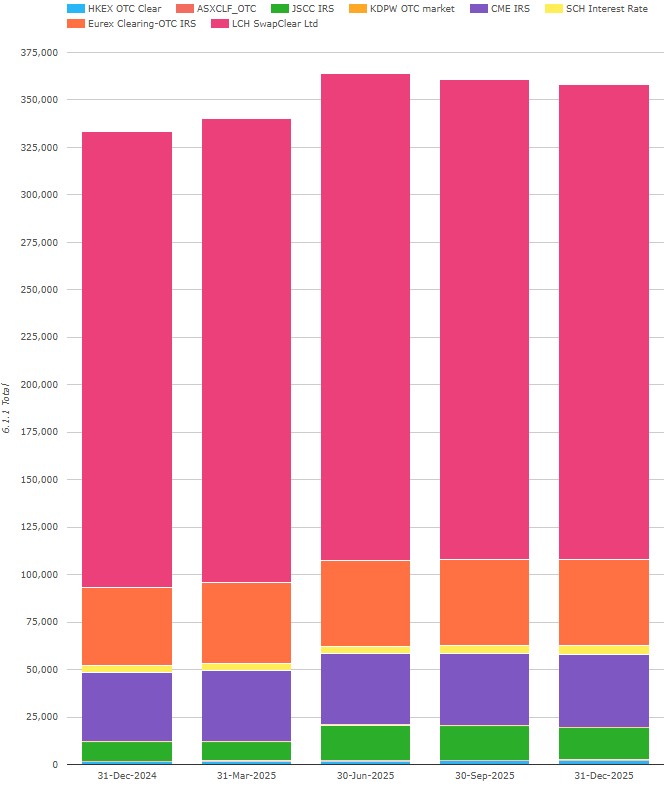
Chart 1a: IRS IM by CCP ($millions). Source: CCPView.
Chart 1a includes cleared rates swaps IM from the four major CCPs. These are consistently 98 percent of the total IM) along with four other CCPs.
All eight CCPs disclosed a total of $358 billion on 31 December 2025 – down 0.7 percent or $2.43 billion QoQ, but up $24.9 billion or 7.5 percent YoY.
- LCH SwapClear reported $250 billion or £186 billion – in GBP terms, down 1.1 percent QoQ, and down 2.8 percent YoY from its high of £192 billion in Q4 2024.
- Eurex OTC IRS had $45.3 billion or €38.5 billion – in EUR terms, down 0.3 percent QoQ, and down 2.3 percent YoY, and well below its high of €59.4 billion in Q4 2022.
- CME IRS disclosed $38.059 billion – a hair down QoQ from its record $38.062 billion in Q3 2025, and up 5.1 percent YoY.
- JSCC IRS revealed $16.9 billion or ¥2.64 trillion – in JPY terms, down 0.7 percent QoQ, but up 67 percent YoY, and below the Q2 high of ¥2.69 trillion.
For the four other CCPs were:
- Shanghai Clearing (from China) with $4.85 billion – up 25 percent QoQ and up 30 percent YoY.
- HKEX OTC Clear (from Hong Kong) with $2.10 billion – flat QoQ and up 36 percent YoY.
- ASX (from Australia) with $427 million – up 65 percent QoQ and up 47 percent YoY.
- KDPW (from Poland) with $246 million – up 7.4 percent QoQ and up 8.4 percent YoY.
For comparison, we show notional volumes over the same five quarters.
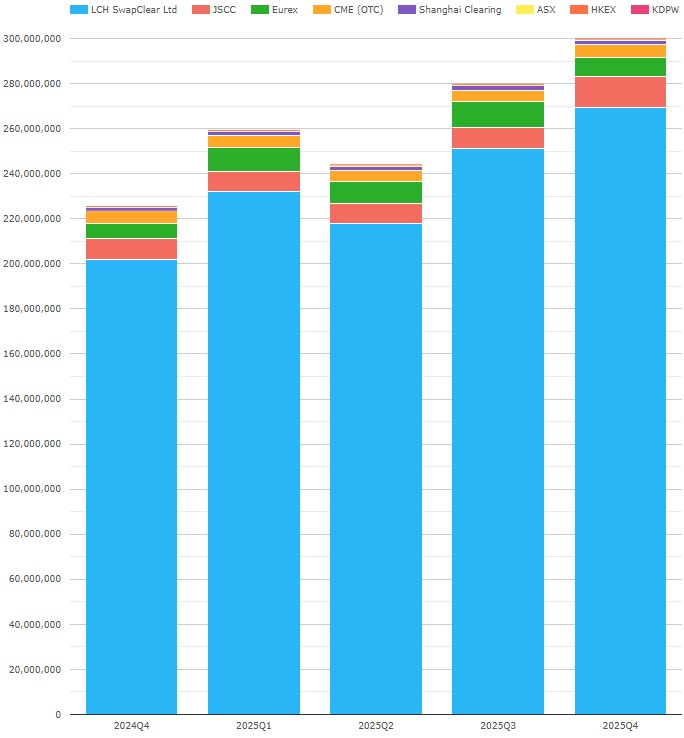
Chart 1b: IRS notional volumes by CCP ($ millions). Source: CCPView.
Chart 1b shows that IRS volumes for our eight CCPs totaled $300 trillion in Q4 0225 – up 7.2 percent QoQ, and up 33 percent YoY.
- SwapClear volumes were $269 trillion and grew by the same QoQ and YoY percentages as total volumes.
- JSCC volumes jumped up QoQ by 47 percent, overtaking Eurex, whose volumes declined by 27 percent QoQ.
- CME volumes rose by 23 percent QoQ.
- Of the smaller four CCPs, three declined by between 17 and 25 percent QoQ, while ASX’s volumes rose 7.8 percent.
IM for cleared CDS
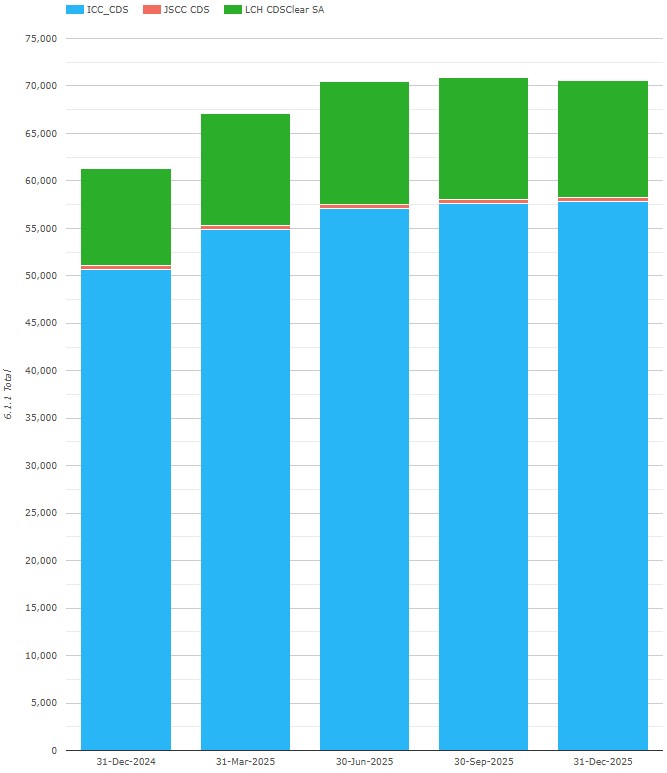
Chart 2a: CDS IM by CCP ($ millions). Source: CCPView.
Chart 2a shows that IM at major CDS CCPs totaled $70.5 billion on 31 December 2025 – down 0.45 percent QoQ, but up 15 percent YoY, below its peak of $77.0 billion in Q2 2022 (not shown).
- ICE Clear Credit disclosed $57.9 billion – up 0.45 percent QoQ, and up 14.2 percent YoY. This is just below its peak (not shown) of $58.8 billion in Q2 2022.
- LCH CDSClear reported $12.3 billion or €10.5 billion – in EUR terms, down 4.4 percent QoQ, but up 6.7 percent YoY. This is just below its peak of €11.1 billion in Q2 2025.
- JSCC CDS reported $370 million or ¥57.9 billion – in JPY terms, down 5.8 percent QoQ, and down 4.8 percent YoY, well below its ¥184 billion peak in Q1 2020 (not shown).
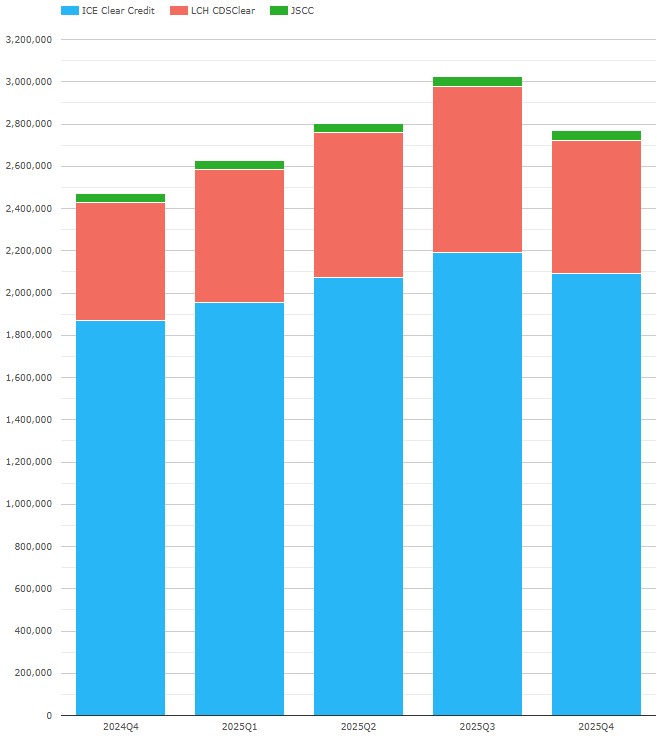
Chart 2b: CDS OI by CCP ($ millions). Source: CCPView.
Chart 2b shows that CDS OI (open interest or notional outstanding) declined to $2.77 trillion – down 8.4 percent QoQ, but up 12.0 percent YoY. By comparison, IM barely declined QoQ (see chart 2a). QoQ declines were seen at ICE Clear Credit (down 4.6 percent) and LCH CDSClear (down 20 percent).
IM for ETD (all asset classes)
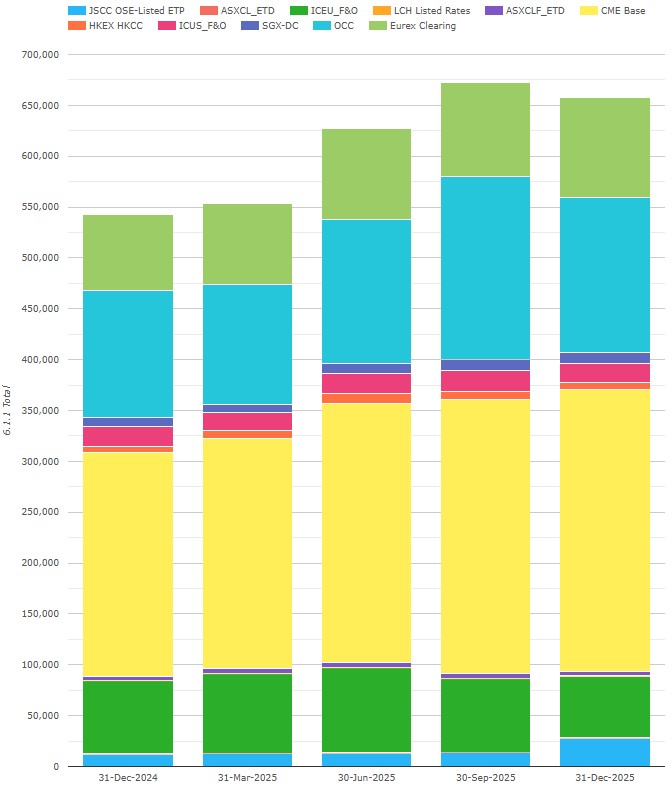
Chart 3: ETD IM by CCP ($ millions). Source: CCPView.
Note: Chart 3 shows totals that include Eurex OTC IRS IM, which is excluded from the following figures.
IM at our 10 selected ETD CCPs was $613 billion on 31 December 2025 – down by 2.3 percent ($14.5 billion) QoQ, and up by 22 percent ($110 billion) YoY. Q4 2025 was down from the record $627 billion set in Q3 2025.
- CME disclosed $277 billion – up 3.1 percent QoQ, and up 26 percent YoY.
- OCC had $152 billion – down 15 percent QoQ, and up 22 percent YoY.
- ICE Europe F&O declared $60.8 billion – down 16 percent QoQ, and down 15 percent YoY.
- Eurex divulged $53.5 billion – up 12.9 percent QoQ, and up 56 percent YoY.
- ICE US F&O showed $18.8 billion – down 9.5 percent QoQ, and down 1.8 percent YoY.
- JSCC OSE Listed ETP reported $27.5 billion – up 105 percent QoQ, but down 132 percent YoY.
- SGX-DC had $10.4 billion – up 0.63 percent QoQ, and up 21 percent YoY.
- HKEX HKCC declared $6.88 billion – down 18.6 percent QoQ, and up 12.2 percent YoY.
- ASX CLF ETD and ASX CL ETD combined divulged $4.93 billion – down 17 percent QoQ, and up 1.0 percent YoY.
- LCH Listed Rates reported IM of $56 million – up 93 percent QoQ from $29 million, and up about nineteen-fold YoY after first clearing in Q3 2024.
For comparison, we look at the corresponding quarterly rates ETD notional volumes, in table form for visibility of the smaller players.
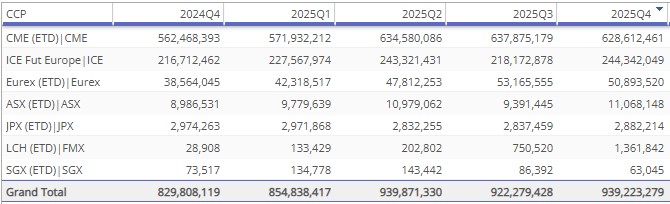
Table 1: rates ETD notional volumes by CCP ($ millions). Source: CCPView
Table 1 shows that seven of the CCPs in Chart 3 had a dynamic in their quarterly volumes aligned with the dynamic in their quarter-ending IM.
Other disclosures of interest
We can use a CCPView feature to highlight metrics that change significantly more than 10 percent. Let us use this to scan Q4 2025 disclosures for the major clearinghouses:
- CME Base reported kccp (4.2.1) back down to 38 – down QoQ from 78 after reporting 177 in Q3 2024.
- CME Base reported above material QoQ increases in cash deposits including 6.2.3 TotalIM_PreHaircut (secured cash deposits at commercial banks, including reverse repo) of $3.6 billion – up 80 percent, and 6.2.4 TotalIM_PreHaircut (unsecured cash deposits at commercial banks) of $9.86 billion – up 97 percent.
- DTCC GSD (providing US Treasury bond cash and repo clearing as discussed in my ION Markets Blogs) reported the 19.3.1 top five clearing members’ percentage of client transactions on average at 73.32 percent – up QoQ from 51.77. This suggests the top five are taking the lion’s share of the ramp-up in buyside clearing ahead of the mid-2027 go live of the SEC UST repo clearing mandate.
- DTCC’s 4.2.1 kccp’s have been dynamic:
- GSD had kccp of 1,430 – up 3 percent QoQ and up 40 percent YoY.
- MBSCC (providing mortgage-backed securities clearing) had kccp of 28 – up 100 percent QoQ but down 66 percent YoY.
- DTCC’s services 15.2.3 profits continued their robust growth:
- GSD $141 million – up 13 percent QoQ and up 70 percent YoY.
- MBSCC $141 million – also up 13 percent QoQ and up 70 percent YoY.
- NCSS $306 million – up 9.6 percent QoQ and up 62 percent YoY.
- HKEX OTC Clear total IM was $2.10 billion – flat QoQ but up 34 percent YoY, while 6.1.1 client gross IM increased to 362 million – up 25 percent QoQ and up 70 percent YoY. Perhaps this is driven by Swap Connect.
- HKEX SEOCH (the Securities Exchange of Hong Kong – Options Clearing House Ltd) disclosed 16.2.20 “percentage of total participant cash held as securities” at 40.73 percent, up QoQ from 19.74, and higher than the previous peak of 32.14 in Q4 2024.
- HKEX HKSCC (Hong Kong Securities Clearing Corporation) showed 23.1.1 average daily volumes and 23.1.2 daily notional value as follows:
- ETD saw 2,285 contracts down 85 percent QoQ and down 86 percent YoY.
- ICE ClearCredit CDS clearing service showed 19.1.3.2/4 average client clearing member concentration at 85 percent to the top five – up QoQ from 46 percent.
- ICE Europe Futures exchange showed kccp (4.2.1) at 251 – up QoQ from 205 and up YoY from 140.
- LCH SwapClear average daily notional volume of transactions peaked for the following currencies:
- COP at $467 million – up QoQ from $267 million, the previous high.
- NZD at $3,39 billion – up QoQ from $1.96 billion , the previous high.
- LCH Listed Rates 6.1.1 total IM was $41 million – up QoQ from $21 million. $34 million of this was client IM. This is mainly FMX SOFR futures, which continue their compounding growth.
- OCC’s USD options average daily volumes (23.3.1) was 66.6 million contracts – up 9.5 percent QoQ and up 29 percent YoY.
There are many more disclosures for non-major clearinghouses, but we will stop there for today and leave those of you with CCPView access to analyze further.
End note
Flip back to the start of the blog to recap the takeaways.
The CCPView disclosures tab has quarterly disclosures data from 30 September 2015 to 31 December 2025 for 44 clearinghouses, each with multiple clearing services, covering equities, bonds, futures, options, and OTC derivatives – with over 200 quantitative data fields with supporting notes.
You can select a subset of CCPs for comparison or disclosures to focus on, chart the numerical disclosures to show trends over multiple quarters, and highlight QoQ changes above a configurable percentage. We also offer an API to access the data programmatically.
If you are interested in using CCPView, get in touch.