Clearing Houses just published their CPMI-IOSCO Quantitative Disclosures, lets look at what’s new:
- Initial margin for IRS is now down from record highs of Mar 2020
- Initial margin for CDS similarly down
- Initial margin for ETD up QoQ and down YoY
- Cash Deposited at Central banks continues to increase (ASC, CME, OCC, …)
- Commensurate drops in marketable collateral convertible to cash
- LCH Clearnet percentage income from reinvestment of assets with an increasing trend
- A lot more detail below
Background
Under the CPMI-IOSCO Public Quantitative Disclosures, CCPs publish over two hundred quantitative data fields covering margin, default resources, credit risk, collateral, liquidity risk, back-testing and more.
CCPView has over 5 years of these quarterly disclosures for 42 Clearing Houses, each with multiple Clearing Services, covering the period from 30 Sep 2015 to 31 Mar 2021. This disclosure data provides insights into trends over time at one CCP and comparisons between CCPs.
Initial Margin for IRS
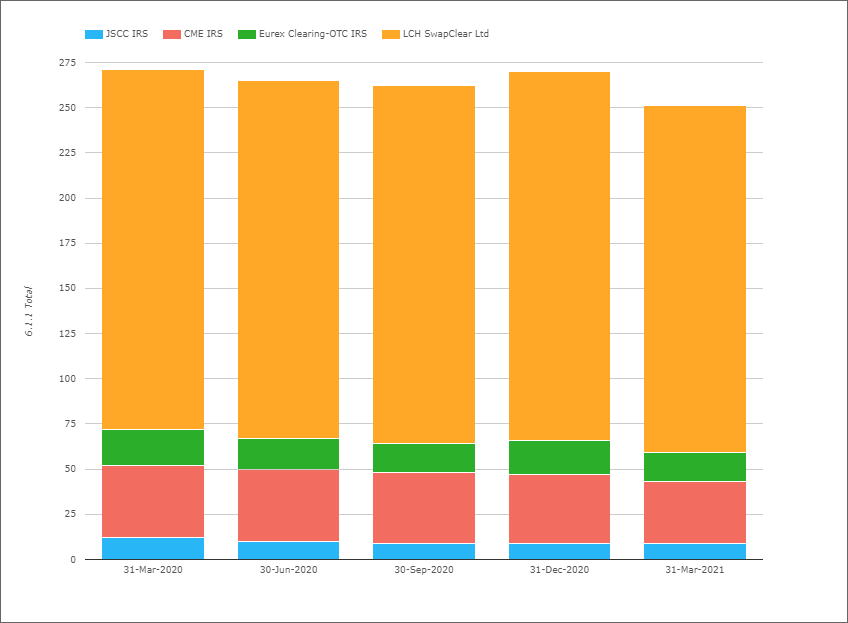
- Total IM for these four CCPs was $251 billion on 31-Mar-2021
- $20 billion or 7% lower than the 31-Mar-2020 high of $271 billion
- Also down 7% from from the $270 billion on 31-Dec-2020
- LCH SwapClear with $192 billion or £139 billion on 31-Mar-2021
- Is down 6% QoQ in USD terms or 6.7% in GBP terms
- While YoY, LCH SwapClear is down 3.5% in USD terms and 14% in GBP terms
- CME IRS with $33.6 billion, down 10.6% QoQ and down 16.5% YoY
- Eurex OTC IRS with $16.3 billion or €13.9 billion
- Down 12.7% QoQ in USD terms or 8.7% in EUR terms
- Down 18% YoY in USD terms or 24% in EUR terms
- JSCC IRS with $9.1 billion or Y1,006 billion
- Down 4% QoQ in USD terms but up 3% in JPY terms
- Down 23% YoY in USD terms and down 22% in JPY terms
IM for IRS is finally materially lower than the record highs we saw on 31-Mar-202, the Covid quarter, which is what we would expect, granted that risk positions of members and clients will not be exactly the same.
Initial Margin for CDS
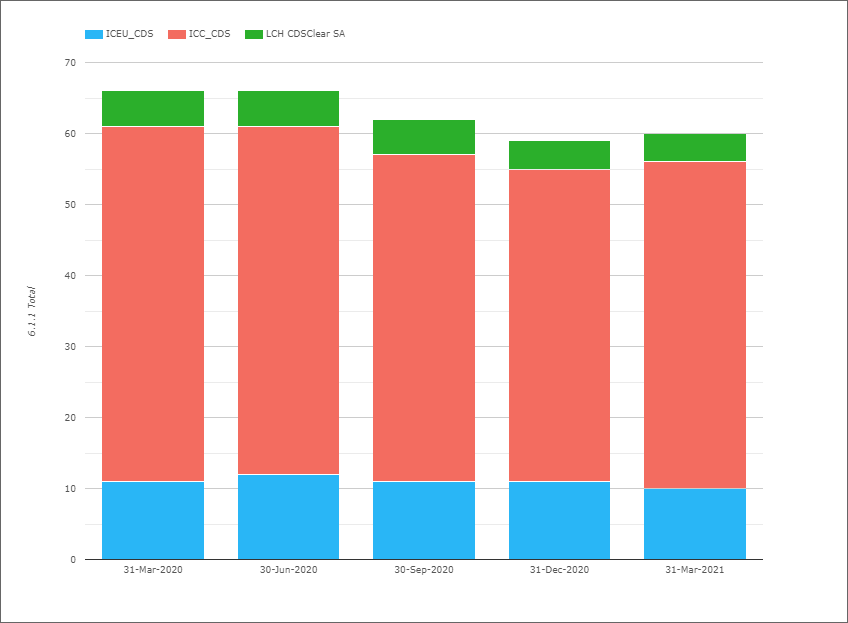
- Total IM for these three CCPs was $60 billion on 31-Mar-2021
- Down 10% from the high of $67 billion on 31-Mar-2020
- Up 1.5% from $59 billion on 31-Dec-2020
- ICE Credit Clear with $45.8 billion, up 4% QoQ and 7% YoY
- ICE Europe Credit with $10 billion, down 8% QoQ and 18% YoY.
- LCH CDSClear with $4.3 billion, down 2% QoQ and 12% YoY.
Overall CDS IM flat QoQ, though ICE Credit Clear gaining, while the European ones down, most likely linked to shift in volumes following Brexit that we have commented on before.
Initial Margin for ETD
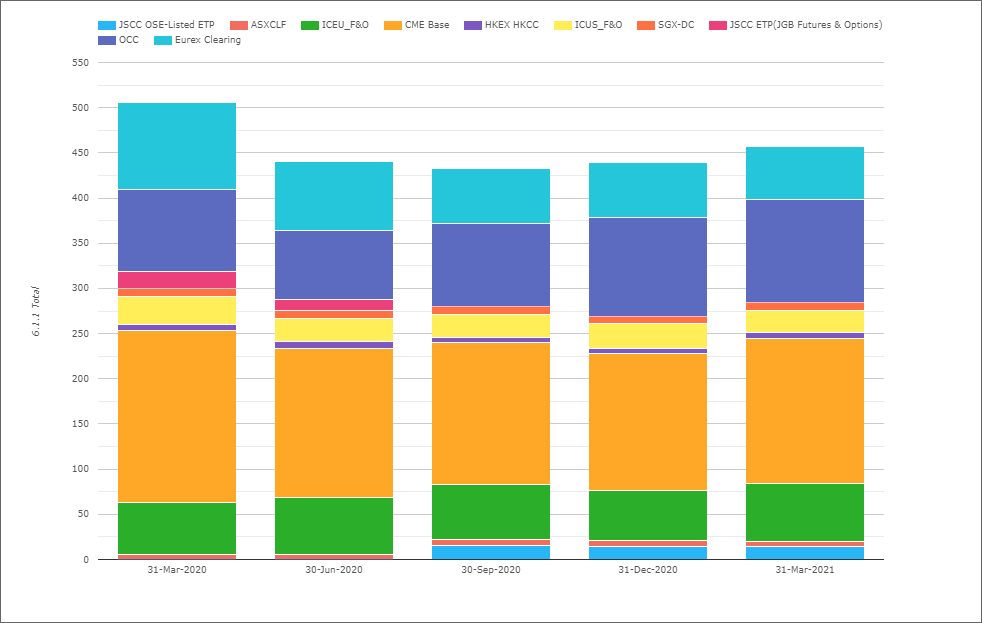
- Total IM for these CCPs was $441 billion on 31-Mar-2021
- Up 5% QoQ and down 9% YoY from 31-Mar-20
- (Note the chart shows slightly higher totals as the Eurex Clearing amount in the chart includes OTC IRS IM, which I exclude in my figures here)
- CME Base with $161 billion, up 6% QoQ and down 15% YOY.
- OCC with $114 billion, up 4.6% QoQ and up 25.5% YoY.
- ICE Europe F&O with $63.5 billion, up 15% QoQ and up 11% YOY.
- Eurex with $43 billion, up 1.5% QoQ and down 43% YOY.
- ICE US F&O $24.7 billion, down 7.3% QoQ and 19.6% YOY.
- JSCC OSE Listed ETP with $14.1 billion, flat QoQ
- SGX-DC $8 billion, up 2.6% QoQ and down 11.7% YoY
- ASX CLF $6.3 billion, down 11% QoQ and up 8% YoY
- HKEX HKCC with $6.3 billion, up 9.3% QoQ and down 13% YoY
ETD IM rising QoQ with increases at all the CCPs, except ICE US F&O, JSCC OSE Listed ETP and ASX CLF.
Other Disclosures of Interest
Next let’s do a quick scan of 31-Mar-2021 disclosures highlighting a few with a change tolerance >20% outside the 3 year range of values:
- ASXCLF – 7.1.2 Qualifying liquid resources Cash deposited at central bank of issue was A$2.1 billion versus A$84 million in the prior quarter, while Secured cash deposited at commercial banks (inc reverse repo) dropped to A$5.3 billion from A$7.9 billion
- B3 – 18.3.2 Percentage of IM posted by the largest 5 clearing members (average in quarter for a clearing service with > 25 members) was 58.5%, up from 50% in the prior quarter and a low of 44.5% in 31-Dec-2018
- BME – Power, 19.1.1 Number of Clients increasing to 248 from 198 in the prior quarter
- CC&G – Equities, 6.1.1 Total IM required Eur 3.8 billion, up from Eur 2.4 billion, with mot of the increase in Client IM
- CCIL – Forex Forwards 6.1.1 Total IM required $3.5 billion, up QoQ from $1.96 billion
- CDCC – 4.1.4 Prefunded Aggregate Participants to Default Fund C$2.86 billion up QoQ from C$2.3 billion and 4.4.7 Estimated largest aggregate stress loss in excess of IM that would be caused by default of any two participants in extreme market conditions C$3 billion up QoQ from C$1.58 billion
- CME – Base 7.1.2 Qualifying liquid resources (a) Cash deposited at central bank of issue was $111.5 billion up QoQ from $76 billion and far higher than the low of $16.7 billion on 28-Jun-2019, while 7.1.8 Qualifying liquid resources (g) highly marketable collateral held in custody and investments readily convertible to cash with pre-arranged funding arrangements in extreme market conditions fell to $31.3 billion from $74,3 billion
- DTCC MBSD – 4.1.5 Prefunded Aggregate Participants to Default Fund Post-Haircut Posted $23.5 billion up QoQ from $12.7 billion, 4.4.3 Estimated largest aggregate stress loss in excess of IM that would be caused by default of any single participant in extreme market conditions $2.965 billion up QoQ from $2.2 billion, 6.1.1 Total IM required $20.6 billion up from $13 billion
- ……
- ….. skipping D to H letters, o/w this is going to become a very long lists of bullet points
- ……
- ICE Clear US – 7.1.4 Qualifying liquid resources (c) secured cash deposited at commercial banks (inc reverse repo) $5.9 billion up QoQ from $4.7 billion while (g) highly marketable collateral held in custody and investments readily convertible to cash with pre-arranged funding arrangements in extreme market conditions fell to $2.2 billion from $2.95 billion
- KRX – Listed Securities 6.8.1 Maximum aggregate IM call on any given day over the period of $708 million higher than $555 form the prior quarter
- LCH – Clearnet.Ltd 15.3.1 Percentage of total income that comes from fees related to provision of clearing services was 48.8% down QoQ from 54.5%, while 15.3.2 Percentage of total income that comes from reinvestment (or rehypothecation) of assets provided by clearing members was 33.7% up QoQ from 28.2%. Interesting and deserves a chart:
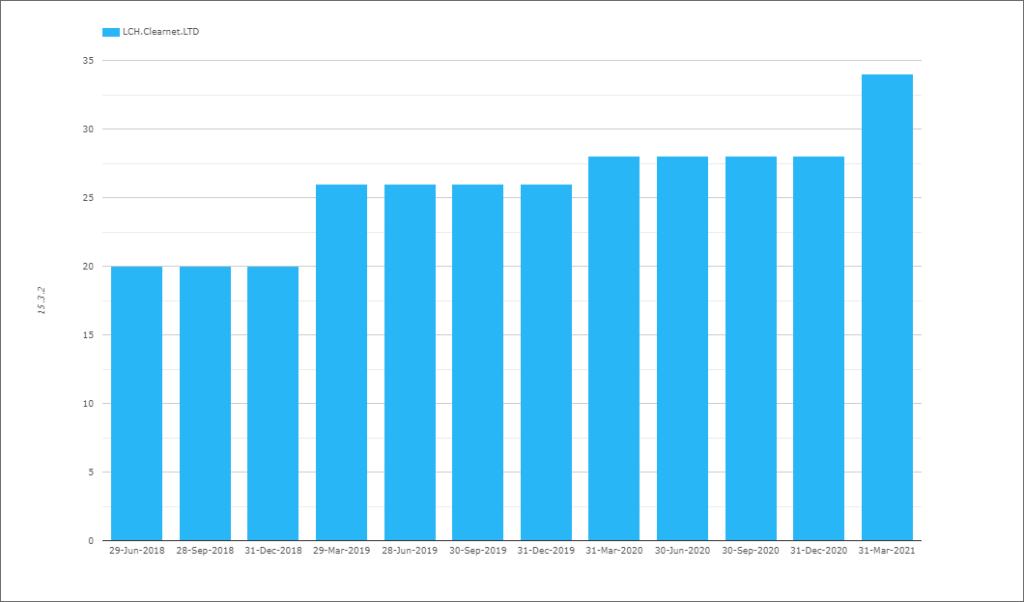
Showing the last 3 years of history with annual step increases from from 20% to 26% to 28% and now 33.7%.
- LME – 4.1.4 Prefunded Aggregate Participants to Default Fund $1.5 billion up from $1.28 billion, $1 billion and $840 million in prior quarters
- OCC – 7.1.2 Qualifying liquid resources (a) Cash deposited at central bank of issue was $7.65 billion up from $6.2 billion and $5.7 billion from prior to quarters
- Nasdaq – Financial Markets, 6.8.1 Maximum aggregate IM call on any given day over the period of $485 million up from $125 million in the prior quarter
- …..
There are a lot more Disclosures and Clearing Services but I will stop there and leave it to those of you with your own CCPView access to analyze further changes.
More Disclosures
CCPView has disclosures from 42 Clearing Houses, each with many Clearing Services, covering Equities, Bonds, Futures, Options and OTC Derivatives with over 200 quantitative data fields each quarter and quarterly figures from September 2015 to Mar 2021; there is a lot of interesting data to analyze.
Please contact us if you are interested in subscribing to CCPView.