Clearing Houses have published their latest CPMI-IOSCO Quantitative Disclosures:
- Initial margin for ETD at $571 billion is up 12% QoQ and 29% YoY
- Initial margin for IRS at $269 billion is up 3% QoQ and 7% YoY
- Initial margin for CDS at $66 billion is up 10% QoQ and 10% YoY
- LME Disclosures provide insight into the Nickel crisis
- Other CCP disclosures with record highs
Background
Under the CPMI-IOSCO Public Quantitative Disclosures, CCPs publish over two hundred quantitative data fields covering margin, default resources, credit risk, collateral, liquidity risk, back-testing and more.
CCPView has over 6 years of these quarterly disclosures for 43 Clearing Houses, each with multiple Clearing Services, covering the period from 30 Sep 2015 to 31 Mar 2022. This disclosure data provides insights into trends over time at one CCP and comparisons between CCPs.
Let’s take a look at the latest disclosures.
Initial Margin for IRS
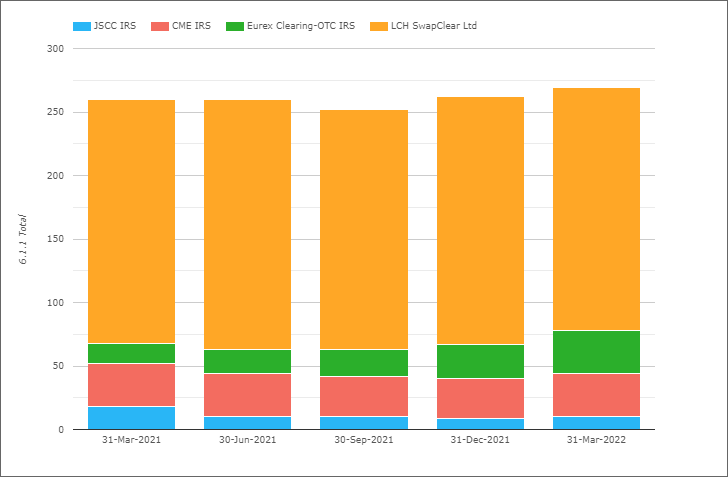
- Total IM for these four CCPs was $269 billion on 31-Mar-2022
- $8 billion or 3% higher QoQ and $18 billion or 7% higher YoY
- LCH SwapClear with $191 billion or £146 billion on 31-Mar-2022
- Up 1% QoQ and 7% YoY in GBP terms ( and down 2% and 0.5% in USD terms)
- Eurex OTC IRS with $34.5 billion or €31.05 billion, is for the first time higher than CME
- Up €7 billion or 32% QoQ and €17 billion or 124% YoY (in EUR terms)
- CME IRS with $33.5 billion, up 10% QoQ and down 0.4% YoY
- JSCC IRS with $9.8 billion or Y1,194 billion, up 16% QoQ and up 19% YoY (in JPY terms).
Total IM for IRS at $269 billion, is close to the record high of $271 billion on 31-Mar-20.
Eurex OTC IRS is now the second largest CCP for IRS (in terms of amount of IM).
Initial Margin for CDS
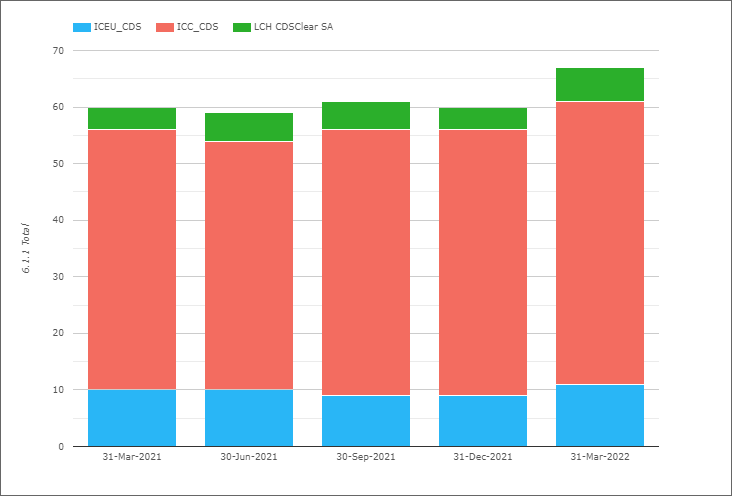
- Total IM for these three CCPs was $66 billion on 31-Mar-2022
- Up $6 billion or 10% QoQ and the same YoY
- ICE Credit Clear with $49.8 billion, up 6% QoQ and 9% YoY
- ICE Europe Credit with €9.6 billion, up 20% QoQ and 13% YoY
- LCH CDSClear with €5.1 billion, up 42% QoQ and up 40% YoY
IM increasing at each CCP in the quarter.
Initial Margin for ETD
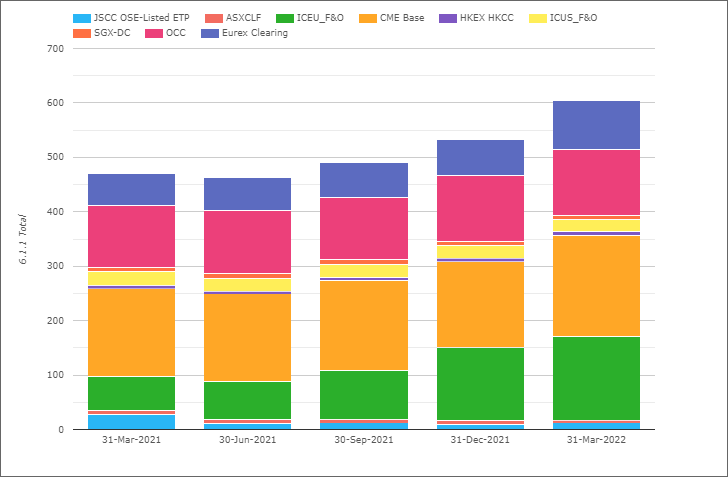
- Total IM for these CCPs was $571 billion on 31-Mar-2022
- Up $63b or 12% QoQ and up $130b or 29% YoY
- (Note the chart shows higher totals as the Eurex figure includes OTC IRS IM, which I exclude)
- CME Base with $185 billion, up 16% QoQ and up 15% YoY.
- ICE Europe F&O with $154 billion, up 15% QoQ and up 142% YoY!
- OCC with $121 billion, flat QoQ and up 6% YoY.
- Eurex with $56 billion, up 43% QoQ and up 31% YoY.
- ICE US F&O $21.7 billion, down 6% QoQ and down 12% YoY.
- JSCC OSE Listed ETP with $12.2 billion, up 16% QoQ and down 14% YoY
- HKEX HKCC with $8.2 billion, up 43% QoQ and 31% YoY
- SGX-DC $6.9 billion, down 18% QoQ and down 14% YoY
- ASX CLF $5.2 billion, down 16% QoQ and 17% YoY
ETD IM rising QoQ by $63b or 12% in the quarter, largely due to the increased price volatility in markets, particularily commodities, with large QoQ IM increases at CME Base, ICE Europe, Eurex, JSCC and HKEX.
LME Disclosures
Let’s turn now to Commodity markets and the London Metal Exchange (LME).
On March 8, 2022, LME suspended trading and canceled trades in the Nickel market after prices doubled to over $100,000 per tonne; a Clearing crisis with few if any comparables in modern times. What does Disclosures data show, both for the period before the crisis and at the end of the quarter?
First Default Resources on 31-Dec-21:
- 4.1.1 Prefunded – Own Capital Before was $22.75 million
- 4.1.4 Prefunded – Aggregate participant contributions were $1.09 billion
- 4.1.8 Committed – Aggregate participant contributions to address a default also $1.09 billion
- 4.1.9 Commited – Aggregate participant contributions to replenish the DF also $1.09 billion
- Making the Total DF Resources equal to $3.36 billion, of which $1.1 billion was pre-funded
Other disclosures of interest from 31-Dec-21 or earlier:
- 4.4.3 Estimated largest stress loss (in excess of IM) from the default of any single participant, PeakDayAv, was $688 million on 31-Dec-21, only just below the record historical high of $712 million
- 4.4.6 Actual largest aggregate credit exposure (in excess of IM) to any single participant, PeakDayAv, was $51.7 million
- 4.4.7 Estimated largest stress loss (in excess of IM) from the default of any two participants, PeakDayAv, was $1.28 billion
- 4.4.8 Number of business days that 4.4.7 exceeded actual pre-funded resources (in excess of IM) was 0 and so the Amount Exceeded also 0
- So not too bad, though 4.4.7 a little higher than pre-funded DF resources, is a concern
The same disclosures on 31-Mar-22:
- 4.4.3 Estimated largest stress loss (in excess of IM) from the default of any single participant PeakDayAv, was $1 billion
- 4.4.6 Actual largest aggregate credit exposure (in excess of IM) to any single participant PeakDayAv, was $2 billion
- 4.4.7 Estimated largest stress loss (in excess of IM) from the default of any two participants PeakDayAv, was $1.9 billion
- 4.4.8 Number of business days that 4.4.7 exceeded actual pre-funded resources (in excess of IM) was 1 and the Amount Exceeded was $600 million
A huge jump in 4.4.6 from $51.7 million to $2 billion and 4.4.8 with a $600 million deficit.
LME published Notes on key data points from Q1 2022, available here, which specifies that this $600 million shortfall was met by calling for additional default funds (from commited) on the evening of March 7th.
For Disclosure 6.8.1 Maximum aggregate initial margin call on any given day, the Notes state:
- On 7 March, LME Clear called $7.05bn in (principally) variation margin to cover the changes in member portfolio value. This reflects the size and speed of the price move in nickel over the course of the day. The previous record day for margin calls before this quarter was $1.8bn. All margin calls were settled by clearing members.
The background section states that Nickel prices on March 7th close had moved up by 78% over the previous 2 business days, prior to which the largest upward 2-day price move was 26%. Giving us some insight into the contentious decision to suspend trading at 8:15 am on March 8th, as Nickel prices doubled.
LME taking the view that the Nickel market had become disorderly and not only suspending trading but canceling all trades that day to revert to March 7th close, as there was concern that multiple clearing members would have defaulted had LME made margin calls on March 8th, leading to a systemic crisis.
We don’t know the theoretical figure of there margin calls, but persumably it was higher than the $7 billion call the prior day. So two consecutive calls with a cummulative amount greater than $15 billion, would have been more than 3 times total default resources (prefunded and committed)! So while certainly a contentious decision and the subject of litigation, one can understand LME’s decision.
The real issue is not so much what actions were taken on the day, as these will have followed the Exchange rule book, but how LME allowed trading in one of it’s markets to reach a point where it threatened losses far higher than its CCPs total default resources.
The answer to that, we will have to wait for the FCA and Bank of England reviews.
Other Disclosures of Interest
Next let’s do a quick scan of 31-Mar-22 disclosures, highlighting a few historically significant ones:
- ASXCLF – 6.8.1 Maximum aggregate initial margin call on any given day, was $243 million, the highest since the quarter ending Mar2019 with $255 million
- B3 – 4.4.7 Estimated largest stress loss (in excess of IM) from the default of any two participants PeakDayAv, was $671 million, the highest on record (prior high $619 million in the Dec2019 quarter).
- CDCC – 4.4.4 Number of days that 4.4.3 (estimated largest stress loss (in excess of IM) from the default of any single participant, PeakDayAv) exceeded actual pre-funded default resources was 1 with an excess of $96.5 million (compared to committed participant resourves of $2.2 billion)
- DTCC NSCC – 6.7.1 Maximum total variation margin paid to the CCP on any given day, was $6.2 billion, the highest since Mar2020 quarter ($7.3 billion)
- ICE Clear Credit – 4.1.5 Prefunded Aggregate Particpant Contributions – Post-Haircut Posted were $4.8 billion, up from $4.1 billion and $3.5 billion in prior quarters, while 4.4.3 Estimated largest stress loss (in excess of IM) from the default of any single participant, PeakDayAv, was $1.2 billion, up from $686 million and $327 million in prior quarters.
- ICE Clear Europe F&O – 6.6.1 Average total variation margin paid to the CCP was $5.1 billion, up from $4.6 billion, $2.4 bilion and < $2 billion in all the prior quarters, while 6.8.1 Maximum aggregate initial margin call on any given day over the period was $7.7 billion, a record high, up from $5.6 billion, $2.4 billion and $2 billion in prior quarters
- …
There are a lot more Clearing Services and Disclosures but I will stop there and leave it to those of you with your own CCPView access to analyze further changes.
As well as a Web UI, we also offer an API to programatically access this data.
IOSCO Quantitative Disclosures
CCPView has disclosures from 43 Clearing Houses, each with many Clearing Services, covering Equities, Bonds, Futures, Options and OTC Derivatives with over 200 quantitative data fields each quarter and quarterly figures from September 2015 to March 2022.
Please contact us if you are interested in subscribing to CCPView.