Following our blog in April 2024, we further explore the volume expansions and market transitions in JPY IR derivatives.
Key takeaways
- In each of the last four completed quarters, cleared volumes in JPY OIS and TONA futures have each surpassed their previous record.
- JPY cleared IRD peaked at ¥2.75 quadrillion in Q1 2025, while the last four quarters were all above ¥2.24 quadrillion.
- Euroyen ZTIBOR ceased fixing at the end of 2024, further curtailing JPY IRS trading which was already low volume after JPY LIBOR cessation at the end of 2021.
- JPY TONA futures peaked at ¥112 trillion in Q3 2024, while the last four quarters were all above ¥95 trillion.
- Market share of cleared JPY IRD swung by 20 percent from JSCC to LCH in the two years to Q2 2025, led by a surge in LCH-clearing buy-side JPY swaps trading.
- SGX newly listed offshore TONA futures contracts and exceeded 20 percent market share in Q2 2025, its fourth quarter of activity.
- JPY arguably has more rates CCP competition than most other currencies.
- JPY swaptions and JPY-USD cross-currency swaps surged similarly to their cleared cousins, while JPY exotics activity largely halted.
Cleared OTC interest rate derivatives (IRD) volumes
As noted in our quarterly CCP IRD volumes blog, JPY IRD volumes exploded in 2024 and 2025. I wanted to look over a longer period to see the combined effect of the JPY-specific dynamics.

Chart 1: cleared JPY IRD (notional JPY millions). Source: CCPView.
Chart 1 shows that JPY cleared IRD peaked at ¥2.75 quadrillion in Q1 2025, with the last four quarters all above ¥2.2 quadrillion.
- In Q2 2025, OIS were ¥2.36 quadrillion – up 41 percent YoY from ¥1.67 quadrillion.
- Q1 OIS were ¥2.74 quadrillion – up 166 percent YoY from ¥1.03 quadrillion.
Chart 1 also shows the longer-range volume growth – Q1 2025 volumes were more than five times higher than Q1 2021, the first quarter after LIBOR cessation. There were some key events during this period:
- LIBOR cessation at the end of 2021 brought a sharp transition from IRS to OIS trading.
- IRS trading in ZTIBOR (Euroyen TIBOR) and DTIBOR (Japanese TIBOR) rapidly dropped to below 1 percent of JPY swaps volume.
- In March 2024, the Bank of Japan ended negative rates, which had been in place since 2016 to counteract deflation. Rates were raised twice more: in July 2024 to 0.25 percent, and in January 2025 to 0.5 percent.
- ZTIBOR (Euroyen TIBOR) ceased publication at the end of 2024.
- Around and after the US-election in November 2024, much higher volumes were seen in all major currencies.
Given IRS was already below 1 percent, ZTIBOR cessation requires an IRS-only chart to examine the volume effect.
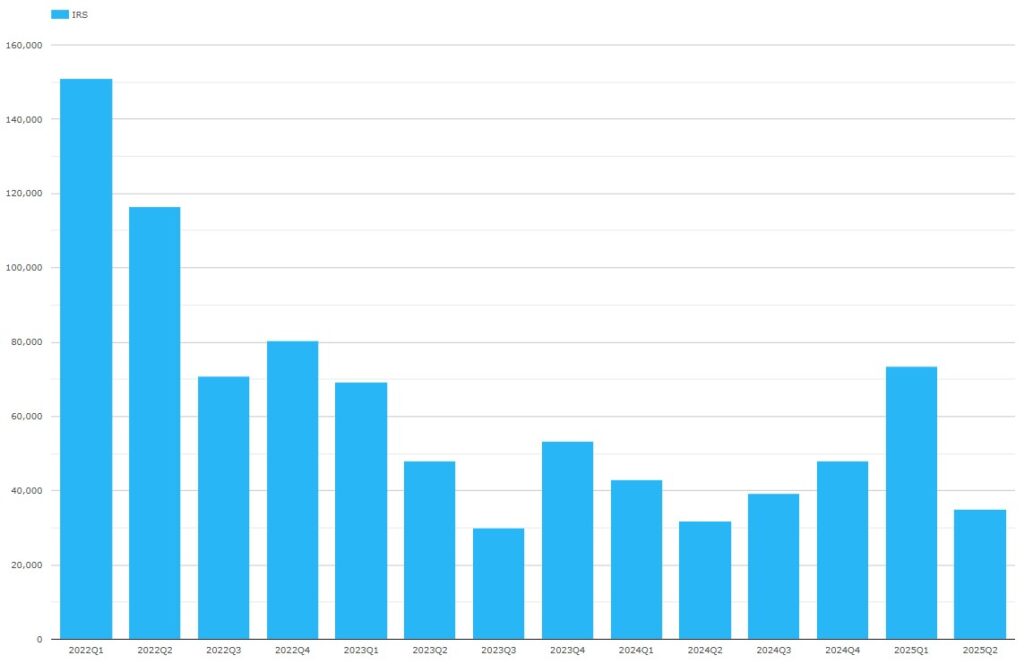
Chart 2: cleared TIBOR IRS (notional JPY millions). Source: CCPView.
Chart 2 shows a decline in TIBOR IRS volumes up to the cessation date at the end of 2024. Then 2025 happened.
- Q2 TIBOR IRS were ¥5.12 trillion – up 3.9 percent YoY from ¥4.92 trillion.
- Q1 TIBOR IRS were ¥11.3 trillion – up 77 percent YoY from ¥6.37 trillion.
The IRS increases are smaller than those in OIS in chart 1, suggesting that ZTIBOR cessation muted the upward pressure on volumes from other factors.
IR futures
Starting with TONA futures, we see the following.
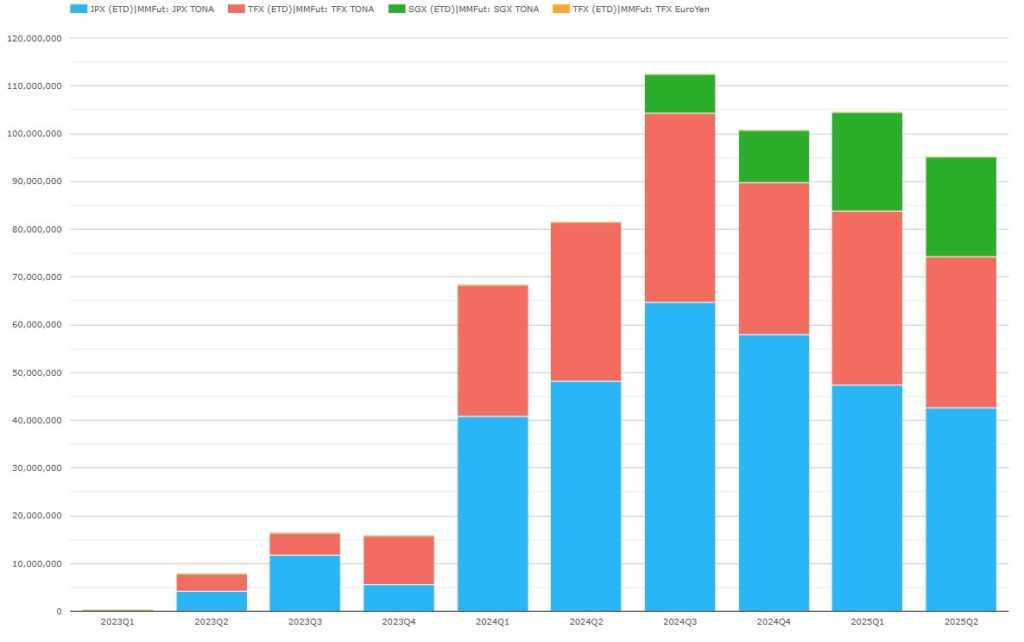
Chart 3: JPY TONA futures volumes by CCP (notional JPY millions). Source: CCPView.
Chart 3 shows that, on top of the Q1 2024 “skyrocketing” reported in our last blog, TONA futures took another big jump in the last four completed quarters. Q3 2024 was the peak quarter to date with ¥112 trillion. The three more recent quarters shaded down from there, but still surpassed earlier quarters.
Q2 2025 TONA volumes totaled ¥95.1 trillion – up 17 percent YoY from ¥81.3 trillion in Q2 2024.
- JPX led with ¥42.7 trillion – down 11.5 percent YoY from ¥48.2 trillion.
- TFX was next with ¥31.5 trillion – down 4.8 percent YoY from ¥33.1 trillion.
- SGX was a new entrant with ¥20.9 trillion – from a standing start a year earlier.
Now we come to JGB futures.
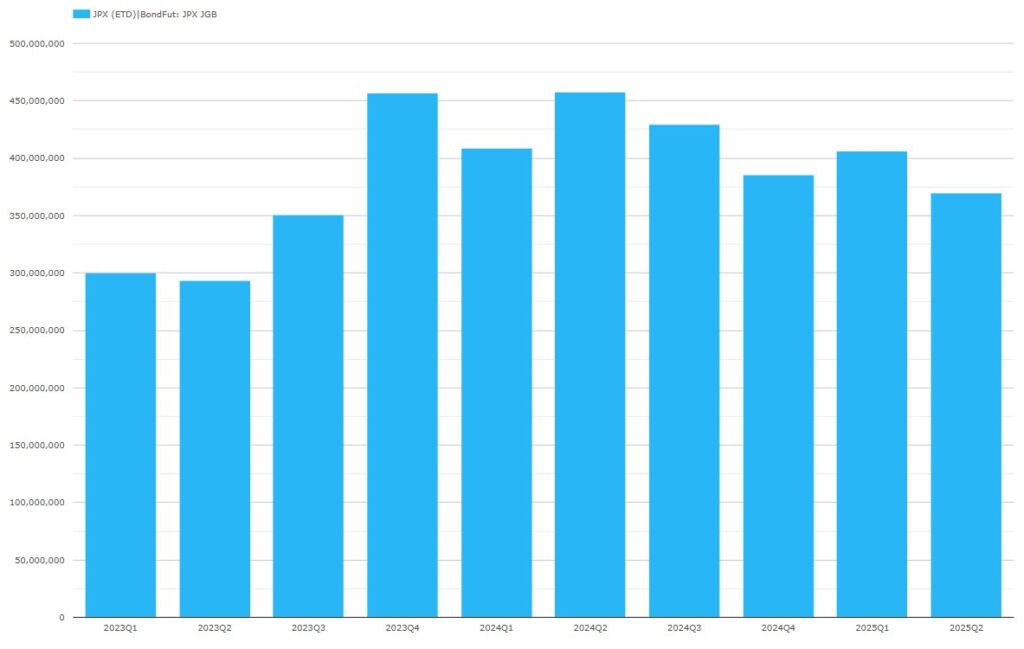
Chart 4: JPY JGB futures volumes by CCP (notional JPY millions). Source: CCPView.
Chart 4 illustrates that JGB futures volumes have declined in the last four quarters after the Q2 2024 historic peak of ¥458 trillion notional.
- Q2 2025 JGB volumes (all at JPX) totaled ¥370 trillion – down 19 percent YoY from ¥458 trillion in Q2 2024.
CCP market share
For many currencies, a single CCP dominates OTC IRD clearing is globally, that is it consistently achieves over 90 percent of cleared volumes in the currency. LCH SwapClear is the dominant CCP for the six major currencies, except for JPY, as well as for the non-major currencies of EMEA and APAC, except for CNY and INR. CME is the dominant CCP for Americas non-major currencies. This leaves only three currencies not dominated by one CCP – CNY, INR, and JPY. I will skip the details of the similar story for IR futures clearing of single CCP dominance, but JPY is also one of the exceptions there too.
The rare competitive nature of JPY leads me to dig into CCP share more deeply. Let us begin with IRD.


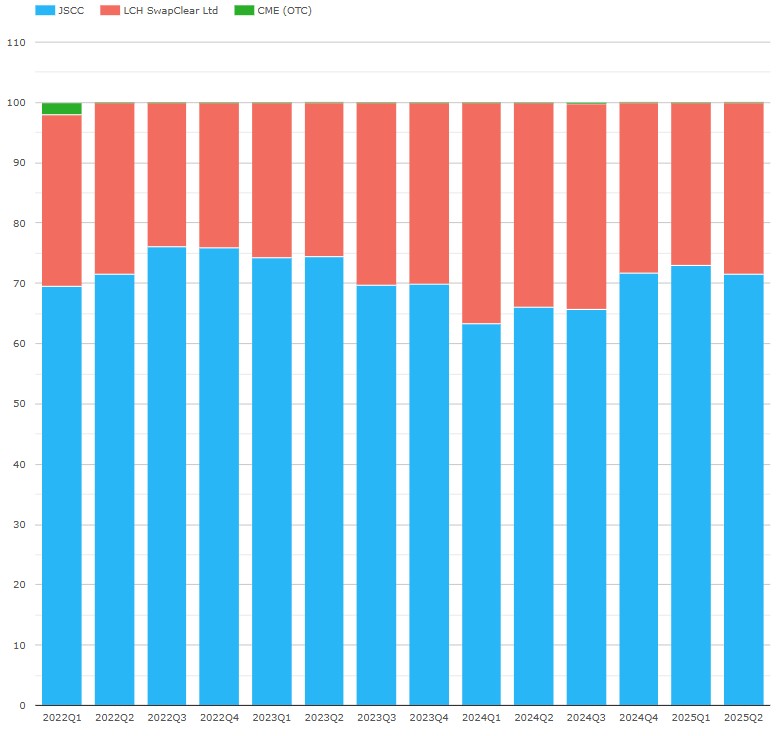
Chart 5: JPY cleared IRD CCP volume share for all tenors and in two tenor subgroups (notional percentage). Source: CCPView.
The “All tenors” subchart in Chart 5 shows that JSCC and LCH together dominated cleared volumes, while CME continues to see sporadic volumes. We can see big share shifts, which the subcharts help to explain. Comparing market shares between Q2 2023 and Q2 2025:
- The “All tenors” subchart shows a 20 percent swing to LCH (JSCC share dropped from 73 percent to 53 percent).
- The “Up to two years” subchart shows a 25 percent swing to LCH (JSCC share dropped from 68 percent to 43 percent).
- The “Over two years” subchart shows a 3 percent swing to LCH (JSCC share dropped from 74.4 percent to 71.5 percent).
Two other factors help us understand:
- CCPView can be used to show that tenors up to two years moved from 27 percent to 66 percent of the all-tenor volume over the same two-year period. This helps explain why the 25 percent shift in short tenors nearly all translates to the overall shift in share.
- CCPView can be used to show that LCH SwapClear JPY client activity rose from 22 percent to 47 percent of the all-CCP JPY volume over the same period. So, LCH-clearing buy-side firms led the JPY swaps volume growth and the shift to LCH.
It might be relevant that, until recently, CFTC did not allow US buy-side firms to clear at JSCC, as this meant that any US buy-side JPY trading surge could only have cleared at LCH. On September 12th, CFTC responded to JSCC’s petition by granting an exemption allowing US buy-side firms to clear at JSCC. JSCC’s press release here outlines the gist of the exemption. We shall see going forward how much this affects CCP market shares.
For the sake of brevity, I skip DV01-based market shares as they show a similar market share pattern, except with higher shares for JSCC. This is due to the concentration of longer tenors with higher DV01 at JSCC.
Next, we look at money market futures competition.
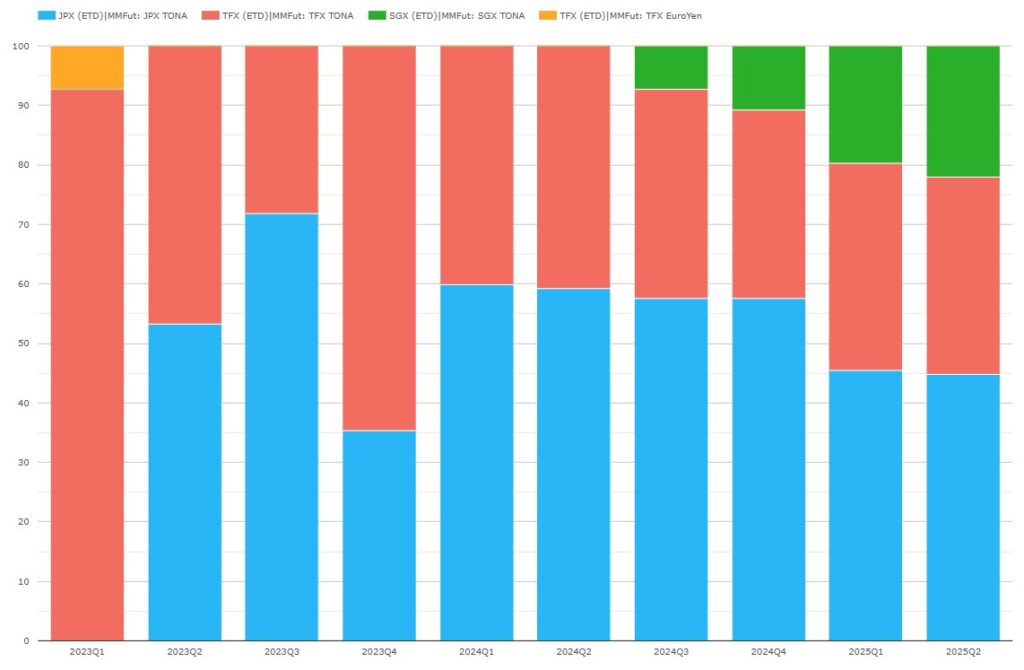
Chart 6: JPY TONA futures volume share by CCP (notional percentage). Source: CCPView.
Chart 6 shows that in Q2 2025, JPX led with a 45 percent share, followed by TFX with 33 percent and SGX with 22 percent. Achieving more than 20 percent market share after only four quarters of trading is a creditable achievement for SGX, perhaps the first exchange to provide offshore TONA futures trading with such success. It may have helped that the SGX launch coincided with the Bank of Japan policy change.
Overall, JPY arguably has more rates CCP competition than most currencies. JSCC and LCH each have over 20 percent of cleared OTC notional, while JPX, TMX, and SGX each have over 20 percent of TONA futures cleared notional.
Uncleared JPY products
Let us look at uncleared JPY products – starting with JPY interest rate options (comprising swaptions, caps, and floors).
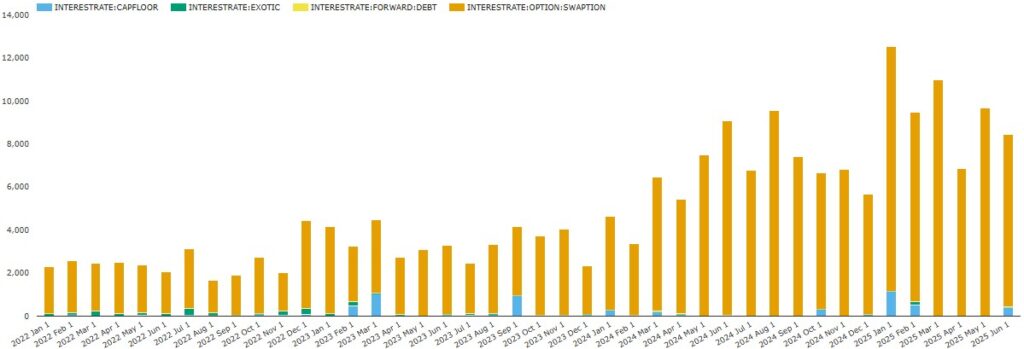
Chart 7: JPY interest rate option volumes (notional JPY billions). Source: SDRView.
Chart 7 shows that:
- Swaptions peaked in January 2025 at ¥11.4 trillion, with March and May also exceeding the prior record set in August 2024 of ¥9.52 trillion. Each month of 2025 comfortably exceeded ¥6 trillion.
- Caps and floors remain sporadic – only three months out of the first six in 2025 had trades, but the ¥1.15 trillion in January 2025 is a new record, exceeding the prior monthly record of ¥1.02 trillion from March 2023.
Next, we look at JPY-USD cross-currency swaps.
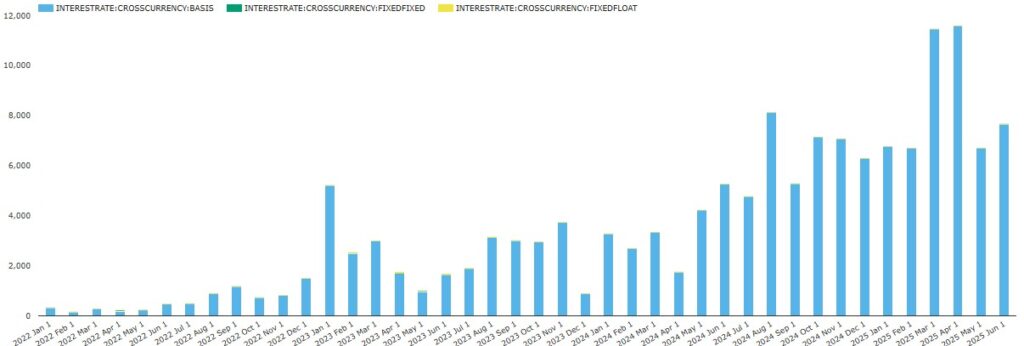
Chart 8: JPY-USD cross-currency swap volumes (notional JPY billions). Source: SDRView.
Chart 8 shows that JPY-USD cross-currency swaps (almost exclusively basis swaps) peaked in April 2025 at ¥11.6 trillion, with March 2025 also exceeding the prior record set in August 2024 of ¥8.02 trillion. Each of the first six months of 2025 comfortably exceeded ¥6 trillion.
Finally, it will not hurt to look at JPY exotics.
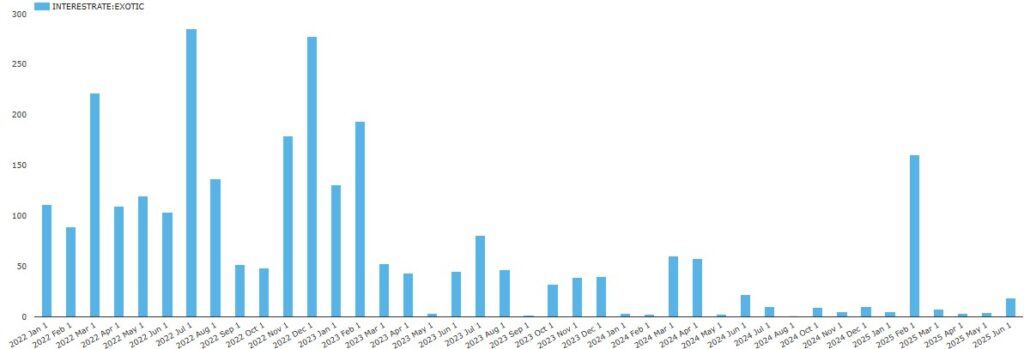
Chart 9: JPY exotics volumes (notional JPY billions). Source: SDRView.
Chart 9 shows that exotics trading has been largely on hold recently.
- Other than the ¥160 billion in February 2025, JPY exotics have been below ¥20 billion each month from July 2024 onwards.
- This compares with the recent peak of ¥285 billion in July 2022, a year when most months exceeded ¥100 billion.
Perhaps participants shifted exotics trading resources to liquid products, given the demands of Bank of Japan rate rises.
End note
- If you wish, flip back to the top to re-read the key takeaways.
- Contact us if you are interested in using CCPView.