Spreads and Butterflies – what is trading?
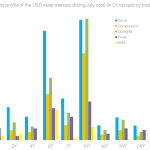
Clarus curate and augment a version of the SDR data that is unique. What does that tell us about the market that an ordinary SDR feed does not? Curve Trades Curve trades have a different price impact to outright trades. This is because they are delta-neutral. It is also common to manage risk across a […]
July 2016 Swaps Review – MXN Clearing and JPY SEF Compression
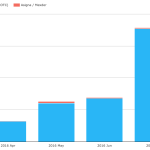
Continuing with our monthly review series, let’s take a look at Interest Rate Swap volumes in July 2016. First the highlights: On SEF USD IRS in July 2016 volume was 20% lower than June (YTD high) USD OIS Volumes were also down from May and June USD Swap Curve was up 10 to 15 bps below 4 years EUR & GBP volumes were […]
Exploring Seasonality in a Time Series with R’s ggplot2
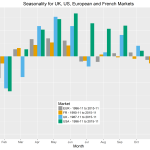
Inflation index values are decomposed into trend, seasonality and noise. Certain types of graph help identify seasonality. Graphs can be created simply and quickly in R. Simple graphs can be refined for stronger visual impact. Recently, I have been looking at inflation indices and studying their seasonality. The best way to see the overall trend and seasonality in this […]
Exploring Commodity Data on the SDRs
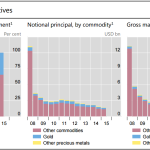
Today we go to the far reaches of the Swap Data Repositories and explore commodities. You probably know that SDRView normalizes and enriches the Interest Rate, Credit, and Foreign Exchange asset classes. We’re quite fluent in that. Further, we have done some studies on the Equity asset class in the recent past. That leaves us […]
SDR Data via Microservices
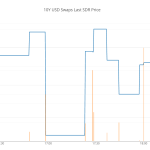
SDR Prices can be retrieved directly from Clarus using very simple code This allows our users to efficiently bring the data into any suitable environment This means that SDR data is available via an API This API is also simple to implement and simple to access. As I said last time, I’m not a coder. Fortunately, our developers help me […]