This blog reviews 2025 volumes and market share of interest rate OTC derivatives reported by clearinghouses (CCPs).
We focus on “core swaps” including cleared IRS, OIS, and basis swaps, using CCPView to filter and aggregate daily volumes and open interest data published by CCPs.
Key takeaways
On core swaps in 2025:
- The six major currencies’ total volumes grew by 24 percent to $989 trillion. GBP and JPY volumes both grew by over 72 percent.
- Major currencies’ total OI at the end of 2025 grew by 24 percent to $260 trillion, over 10 percent faster than in prior years. GBP OI grew by 58 percent.
- EMEA currencies’ total volumes grew by 24 percent to $26 trillion. ILS more than doubled in volume.
- AsiaPac currencies’ total volumes grew by 29 percent to $39 trillion. NZD more than quadrupled in volume to become the largest by volume.
- LatAm currencies’ total volumes declined by 21 percent to $13 trillion. COP grew by 28 percent.
Read on for the charts and data created in CCPView.
Major currencies
We begin with USD core swaps (SOFR or FedFunds OIS, LIBOR IRS, and basis swaps).
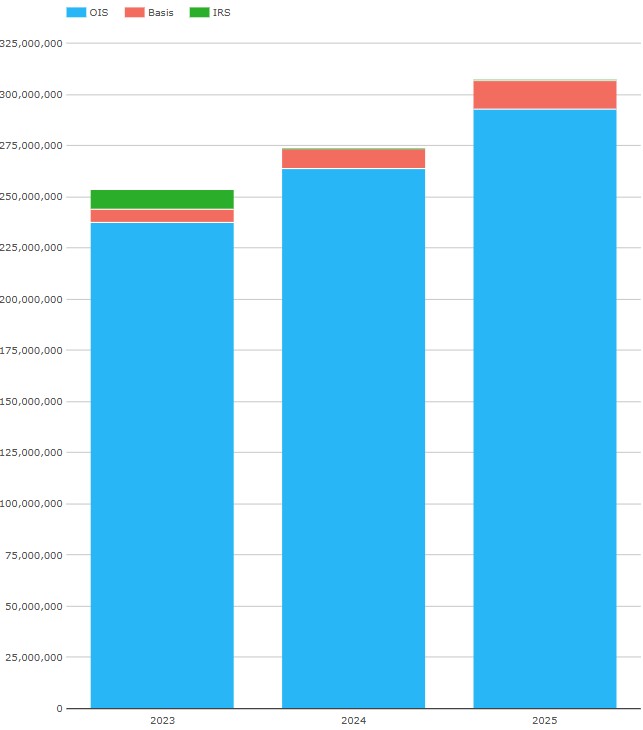
Chart 1: USD core swaps volumes (single sided gross notional, USD millions). Source: CCPView
- Chart 1 shows that total USD core swaps increased to $307 trillion – up 12.3 percent from 2024, which was up 8.0 percent from 2023.
- OIS (SOFR, FedFunds) volumes rose to $293 trillion – up 10.9 percent from 2024, which was up 11.2 percent from 2023.
- Basis swaps (SOFR versus FedFunds) volumes rose to 14.4 trillion – up 53 percent from 2024, which was up 40 percent from 2023.
- IRS (LIBOR) volumes declined to $204 billion – down 58 percent from 2024, which was down 95 percent from 2023. There was zero IRS activity every day in the second half year except for CME activity on 15 September.
We turn to USD market shares.
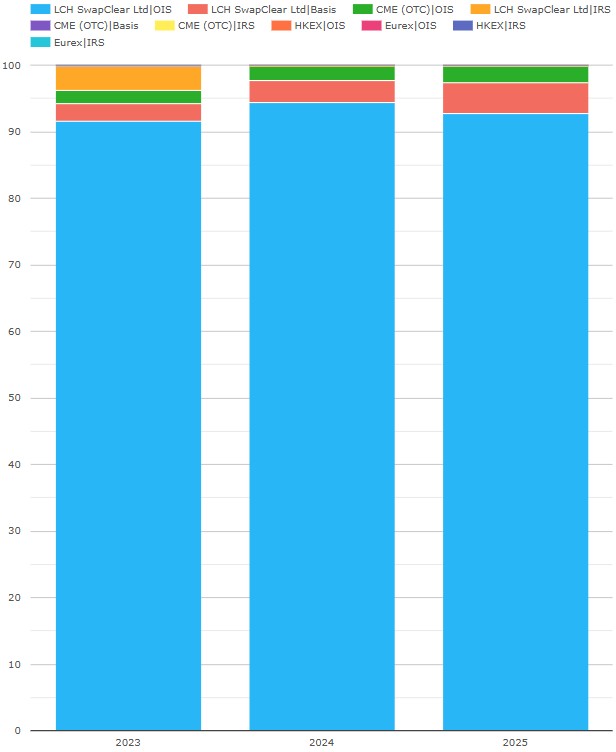
Chart 2: USD core swaps volume market share (percentage of USD notional). Source: CCPView
- LCH SwapClear (blue, red, and orange) had a 97.4 percent share in 2025 – down from 97.9 percent and 97.7 percent in the prior two years.
- CME (mostly green) had a 2.6 percent share in 2025 – up from 2.1 percent and 2.3 percent in the prior two years. Reversing the slow decline.
- Notably, basis swaps grew to 4.7 percent of 2025 USD core swaps volumes – up from 3.4 percent and 2.7 percent in the prior two years.
In summary, USD OIS grew steadily, basis swaps grew faster, while LIBOR IRS disappeared.
Secondly, we have EUR core swaps (€STR OIS, Euribor IRS, basis swaps).
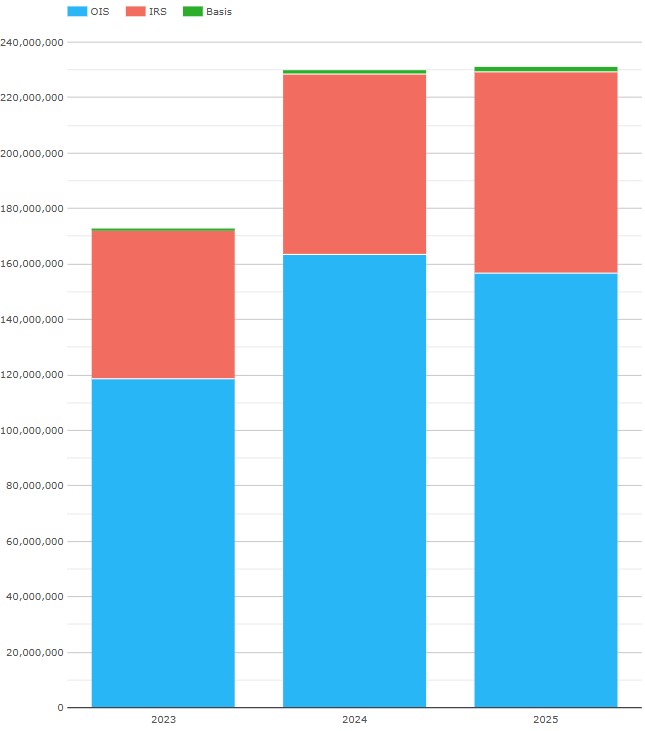
Chart 3: EUR core swaps volumes, single-sided gross notional in EUR millions. Source: CCPView
Chart 3 shows that total EUR core swaps increased slightly to $231 trillion – up 0.67 percent from 2024, which was up 33 percent from 2024.
- OIS (€STR) volumes declined to €157 trillion – down 4.1 percent from 2024, which was up 38 percent from 2023.
- IRS (Euribor) volumes rose to €72.5 trillion – up 11.5 percent from 2024, which was up 22 percent from 2023.
- Basis swaps (€STR versus Euribor) volumes increased to €2.17 trillion – up 58 percent from 2024, which was up 37 percent from 2023. This increase from a low base is notable because, in EUR basis swap hedging, the tradition is to trade a pair of one OIS and one IRS rather than a basis swap.
In summary, EUR swaps growth paused, while basis swaps grew disproportionately.
We now turn to market share of EUR core swaps volumes.
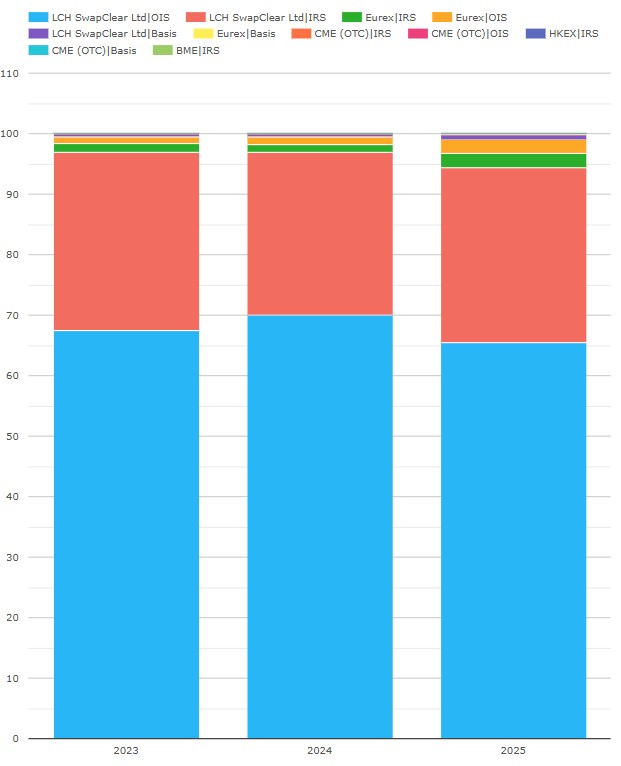
Chart 4: EUR core swaps volume market share (percentage of EUR notional). Source: CCPView
- LCH SwapClear (blue, red, and purple) had a total 2025 share of 95.2 percent – down from 97.4 percent in each of the prior years.
- Eurex (green, orange, and yellow) had a total 2025 share of 4.8 percent – up from 2.6 percent in each of the prior years.
- CME (invisible) had a share of 0.018 percent in 2025 – down from 0.024 percent in 2024, which was up from 0.006 percent in 2023.
- Product-wise, there was a swing of 2.6 percent from IRS to OIS, after a swing of 3 percent the other way in 2024.
The 2.2 percent swing to Eurex may well be driven by the ESMA Active Account Requirement (AAR), which went live on 24 June 2025. For more on AAR, see our prior blogs here and here.
Next, we go to GBP core swaps (SONIA OIS).
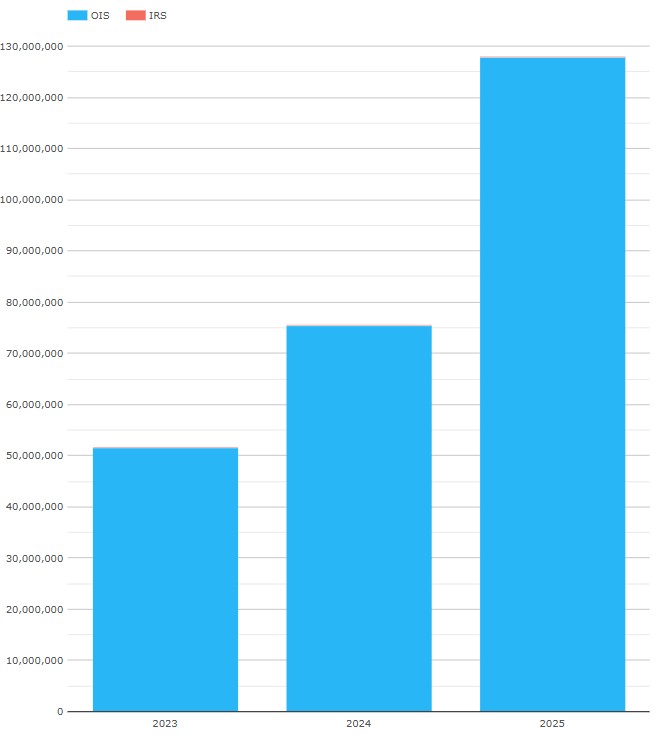
Chart 5: GBP core swaps volumes (single sided gross notional, GBP millions). Source: CCPView
Chart 5 shows the total dominance by SONIA OIS of GBP core swaps.
- OIS (SONIA) volumes leapt to £128 trillion in 2025 – a new record, up all of 70 percent from 2024, the prior record year, which was itself up 46 percent from 2023.
- IRS (LIBOR) had zero volumes in 2025 – down from £5.0 billion in 2024, and £3.3 billion in 2023.
- Basis swaps were zero in all three years.
In 2025, GBP was a currency with a single vanilla interest rate swap product and index, no basis risk to hedge, and volumes jumping.
LCH SwapClear had a 99.99 percent GBP core swaps market share – up from 99.88 percent in 2024, which was down 99.95 percent from 2023. Eurex and CME both cleared GBP SONIA swaps in small volumes in most weeks of 2025.
Next, we review JPY core swaps (TONA OIS, TIBOR IRS, basis swaps).
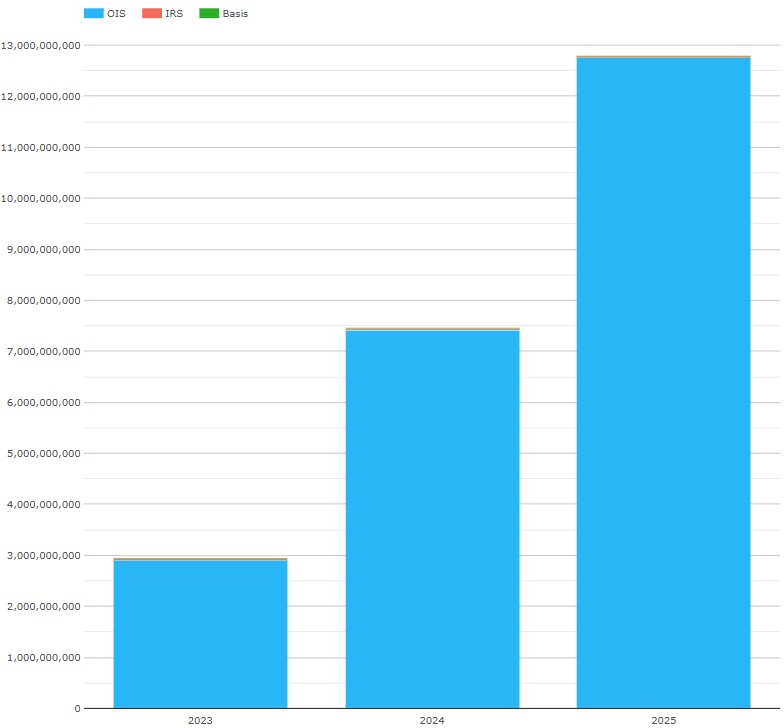
Chart 6: JPY core swaps volumes (single sided gross notional, JPY millions). Source: CCPView
Chart 6 shows JPY core swaps volumes jumped to ¥12.79 quadrillion in 2025 – up 72 percent from 2024, which was up 153 percent from 2023.
- OIS (TONA) grew massively to ¥12.76 quadrillion in 2025 – up 72 percent from 2024, which was up 155 percent from 2023.
- IRS (TIBOR) rose to ¥29.9 trillion in 2024 – up 23 percent from 2024, which was down 13 percent from 2023.
- Basis swaps (TONA versus TIBOR) declined to ¥5.07 trillion – down 72 percent from 2024, which was up 11.2 percent from 2023.
In summary, JPY swap volumes leapt up.
Turning next to JPY core swaps market share:
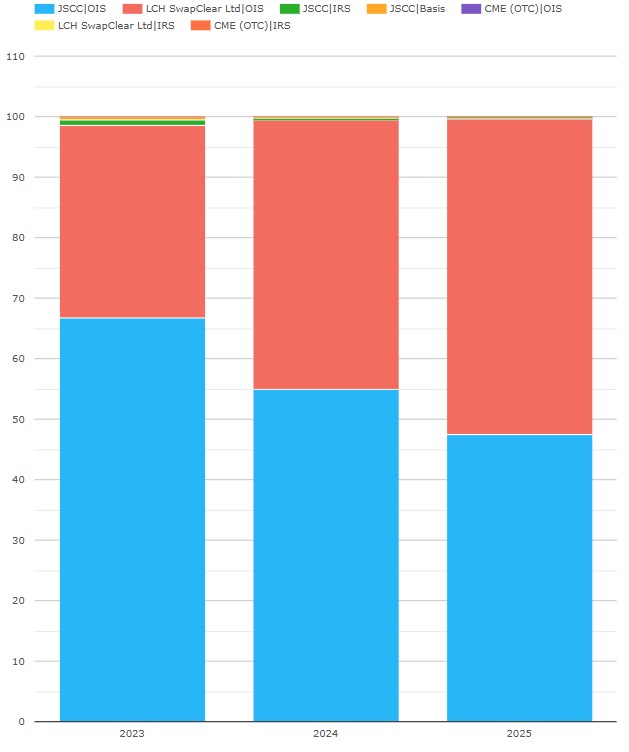
Chart 7: JPY core swaps volume market share (percentage of JPY notional). Source: CCPView
- LCH SwapClear had a 52 percent share in 2025, its highest ever share – up from 45 percent in 2024 and 32 percent in 2023.
- JSCC saw a 48 percent share in 2025 – down from 55 percent in 2024 and 68 percent in 2023.
- CME took a 0.011 percent share in 2025 – down from 0.031 percent in 2024, but up from 0.0061 percent in 2023.
We covered the large JPY market share swings in our recent Q3 CCP competition blog. The fact that JSCC onboarded its first US hedge fund in November suggests a market share comeback is intended.
The next currency is AUD.
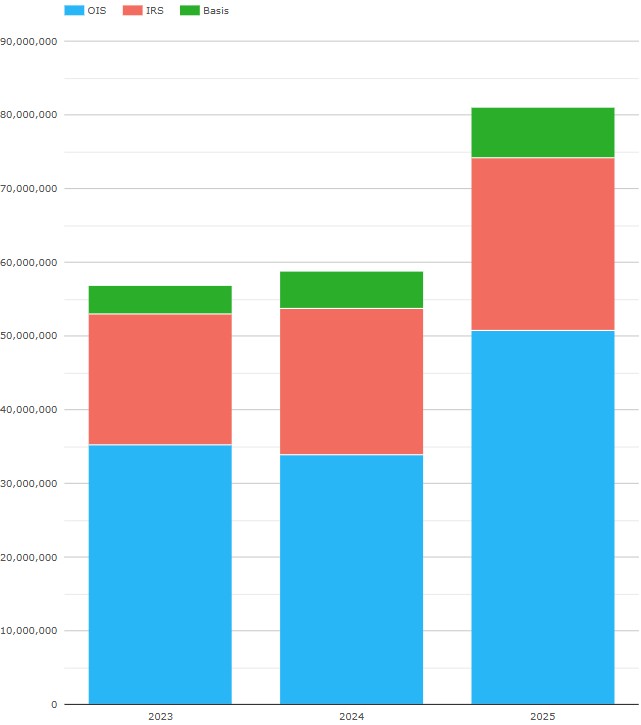
Chart 8: AUD core swaps volumes (single sided gross notional, AUD millions). Source: CCPView
Chart 8 shows AUD core swaps volumes grew to A$81.0 trillion in 2025 – up 38 percent from 2024, which was up 3.3 percent from 2023.
- OIS (AONIA) grew hugely to A$50.7 trillion – up 49 percent from 2024, which was down 3.5 percent from 2023.
- IRS (BBSW) rose to A$23.6 trillion – up 19 percent from 2024, which was up 11.1 percent from 2023.
- Basis swaps (BBSW versus AONIA) were A$6.74 trillion – up 34 percent from 2024, which was up 29 percent from 2023.
Note that we allocate all of ASX’s activity to IRS as we do not have the IRS/OIS breakdown.
Next, we look at AUD market share:
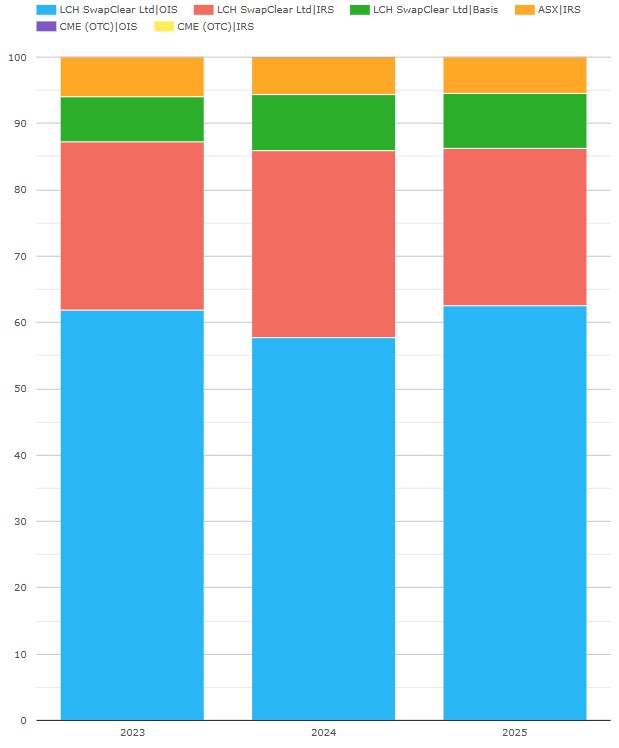
Chart 9: AUD core swaps volume market share (percentage of AUD notional). Source: CCPView
Chart 9 shows us CCP market shares in 2025.
- LCH SwapClear (blue, red, and green) had a 94.6 percent AUD core swaps share – up from 94.4 percent in 2024 and 94.0 percent in 2023.
- ASX saw a 5.4 percent share – down from 5.6 percent in 2024 and 6.0 percent in 2023.
- CME had 0.0036 percent share.
We have reached CAD.
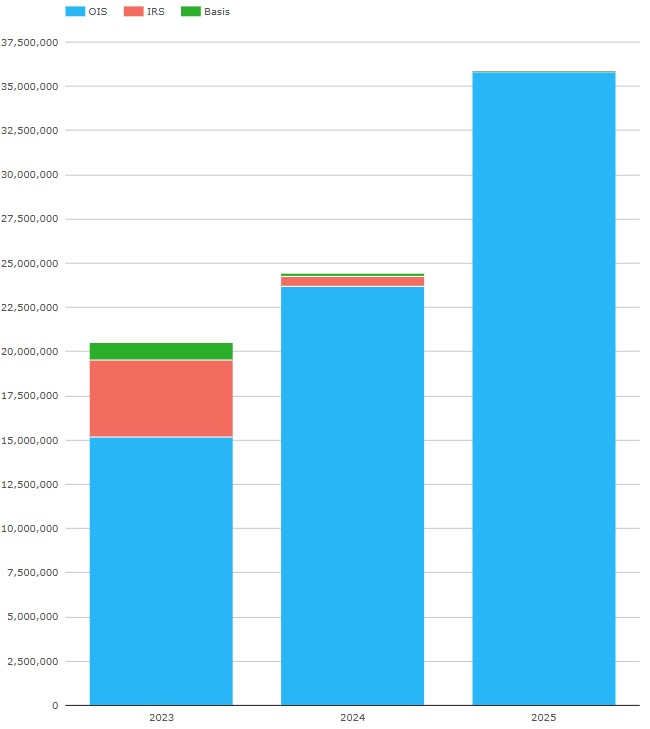
Chart 10: CAD core swaps volumes (single sided gross notional, CAD millions). Source: CCPView
- OIS (CORRA) grew hugely to C$35.8 trillion in 2025 – up 51 percent from 2024, which was up 56 percent from 2023.
- IRS (CDOR) had zero volume in 2025 – down from C$590 billion in 2024, which was down 87 percent from 2023.
- Basis swaps (CDOR versus CORRA) also had zero volume in 2025 – down from C$147 billion in 2024, which was down 85 percent from 2023.
CAD is a second currency with a single vanilla interest rate swap product and index, no basis risk to hedge, and volumes growth above 50 percent.
LCH SwapClear dominated 2025 CAD swaps market share, while CME share was 0.050 percent.
Before moving on we summarize the six major currencies’ core swaps USD-equivalent volumes and OI growth, where OI means open interest, also known as notional outstanding.
Major currencies’ core swaps metrics (single sided gross notional, USD millions). Source: CCPView
Eye-balling charts 11a and 11b shows that 2025 saw straight-line volume growth compared with prior years, while OI growth accelerated.
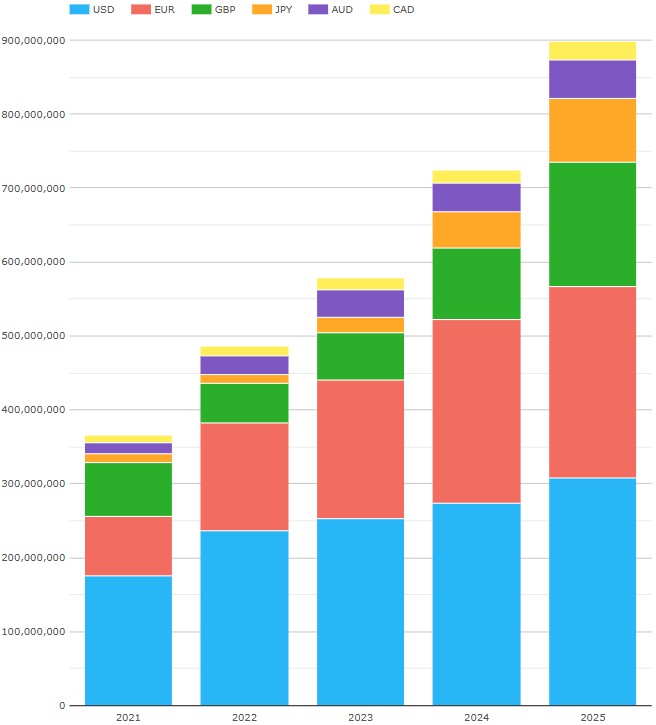
- Chart 11a shows that 2025 major currencies’ volumes were $898 trillion – up YoY 24 percent, while 2024 was up YoY 25 percent and 2023 was up YoY 19 percent. JPY growth and GBP growth both stood out at over 72 percent.
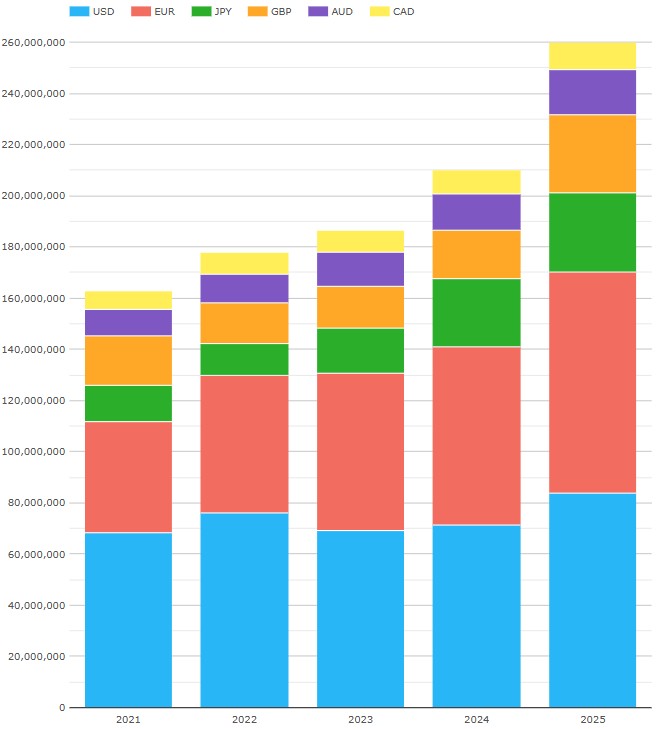
- Chart 11b shows that 2025 year-end major currencies’ OI was $260 trillion – up YoY 24 percent, while 2024 was up YoY 12.5 percent and 2023 was up YoY 5 percent. GBP growth stood out at 58 percent.
EMEA currencies
Now let’s switch to EMEA currencies’ core swaps and volumes by currency.
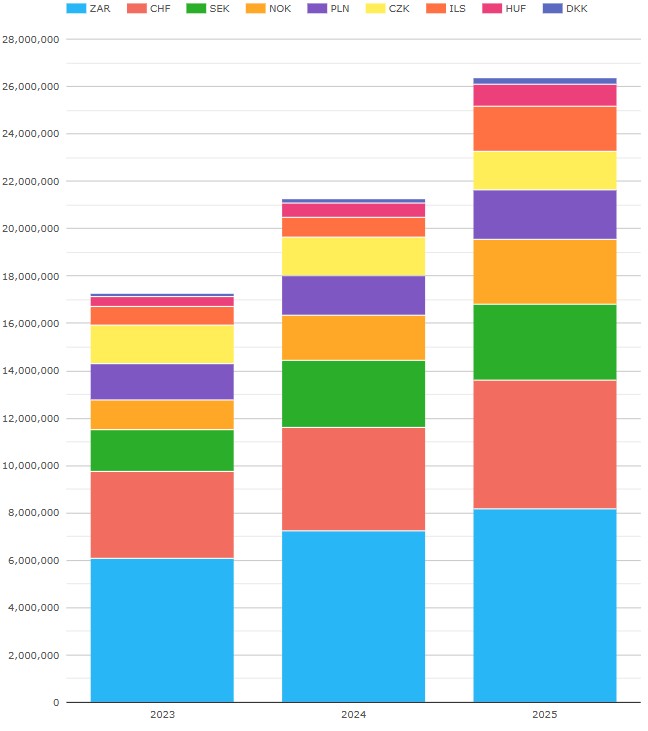
Chart 12: EMEA core swaps volumes (single sided gross notional, USD millions). Source: CCPView
Chart 12 shows that EMEA core swaps (IRS, OIS, basis swaps) volumes were $26.4 trillion in 2025 – up 24 percent YOY.
- ZAR was the largest currency with $8.19 trillion in 2025 – up 12.9 percent YoY.
- CHF was next with $5.42 trillion – up 24 percent YoY.
- SEK had $3.20 trillion – up 14.5 percent YoY.
- NOK with $2.76 trillion in 2025 – up 44 percent YoY.
- PLN with $2.07 trillion – up 22 percent YoY.
- ILS with $1.92 trillion – up 124 percent YoY.
- CZK with $1.63 trillion – up 1.3 percent YoY.
- HUF had $923 billion – up 61 percent YoY.
- DKK saw $275 trillion – up 34 percent YoY.
It turns out that the EMEA currencies’ core swaps market share chart is worth examining.
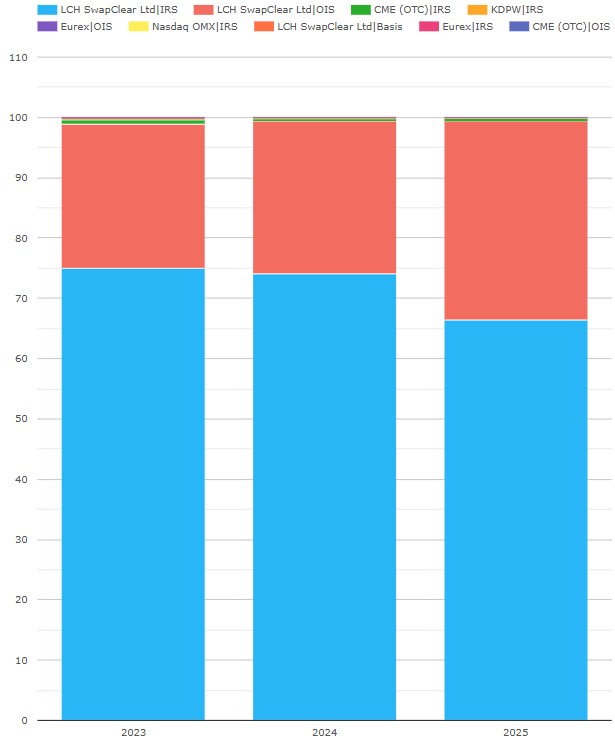
Chart 13: EMEA core swaps volume market share (percentage of USD notional). Source: CCPView
Chart 13 shows us that in 2025 LCH SwapClear maintainedthe 99.4 percent share it had in 2024. The only currencies where LCH had less than a 99 percent share were the following.
- CZK, in which LCH had 98.0 percent, and CME 2.0 percent.
- PLN, in which LCH had 96.9 percent, CME 1.7 percent, KDPW 1.3 percent, and Eurex 0.071 percent.
- HUF, in which LCH had 97.2 percent, and CME 2.8 percent.
The more interesting part is that there was a shift of about 8 percent from IRS to OIS. While there were subtler swing from IRS to OIS in the Scandinavian currencies (SEK, NOK, DKK), the standout contributor to the 8 percent swing was ILS – caused by its mid-2025 cessation in publication of TELBOR (ILS’s IBOR). I will blog separately on RFR adoption progress soon.
AsiaPac currencies
Now let’s switch to AsiaPac currencies’ core swaps.
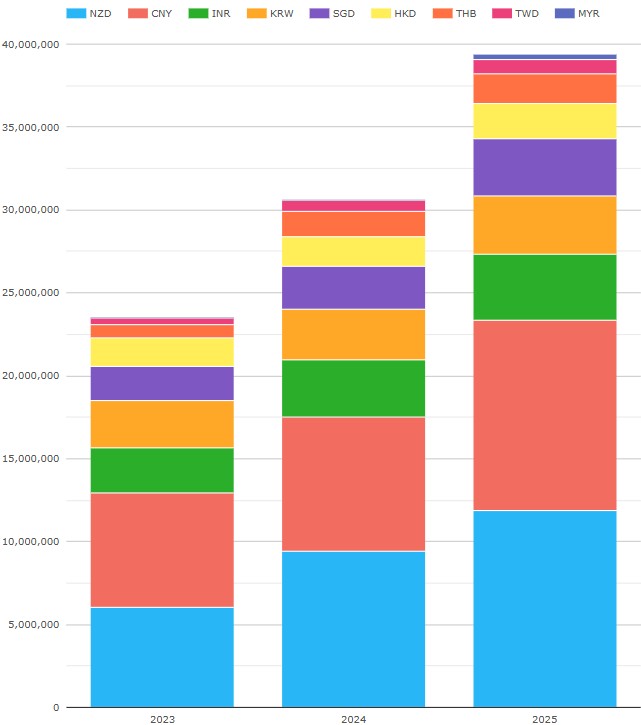
Chart 14: APAC core swaps volumes (single sided gross notional, USD millions). Source: CCPView
Chart 14 shows that APAC core swaps (IRS, OIS, basis swaps) volumes were $39.4 trillion in 2025 – up 29 percent YOY.
- NZD overtook CNY as the largest currency with $11.9 trillion – up 353 percent YoY.
- CNY was only just second with $11.5 trillion – up 43 percent YoY.
- INR was third with $3.95 trillion – up 14.7 percent YoY.
- KRW was next with $3.51 trillion – up 15.0 percent YoY.
- SGD had $3.45 trillion – up 125 percent YoY.
- HKD had $2.18 trillion – up 22 percent YoY.
- THB had $1.77 trillion – up 182 percent YoY.
- TWD had $871 billion – down 92 percent YoY.
LCH SwapClear had a 76.8 percent share of AsiaPac swaps 2025 volumes – down from 81.0 percent. The main driver was CNY, where Shanghai Clearing had 69 percent (up YoY from 60 percent), LCH 31 percent (down YoY from 40 percent), and HKEX 0.018 percent (down YoY from 0.054 percent). For more details, see our recent Q3 CCP competition blog.
The only other currencies where LCH had less than 100 percent share were:
- INR, where LCH had 69 percent (down YoY from 72 percent) and CCIL 31 percent (up YoY from 28 percent), while CME INR swaps volumes went to zero in 2025.
- HKD, with LCH 99.6 percent (up YoY from 99.1 percent), HKEX 0.4 percent (down YoY from 0.8 percent), while CME HKD swaps volumes went to zero in 2025.
And before we leave AsiaPac, let’s look at cross currency swaps, all at HKEX.
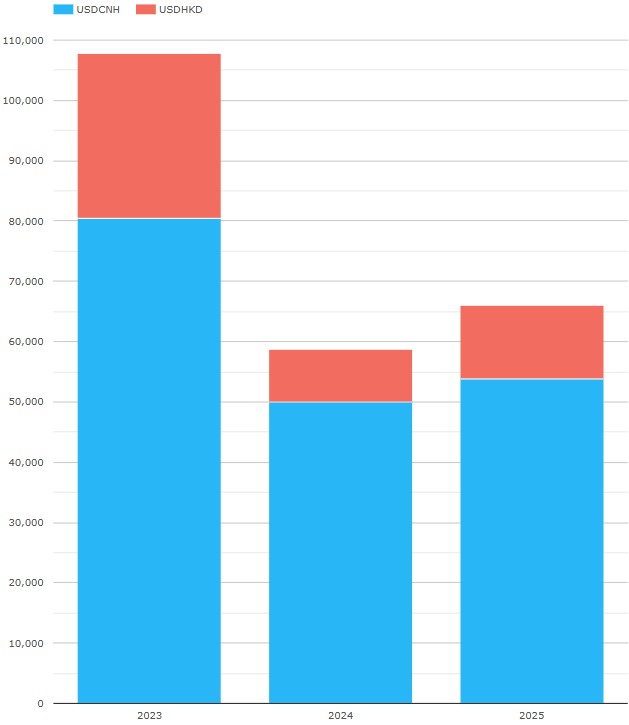
Chart 15: global cross currency swap volumes (single sided gross notional, USD millions). Source: CCPView
- USDCNH cross currency swaps had 2025 volumes of $53.9 billion – up 7.7 percent YoY.
- USDHKD had $12.2 billion – up 39 percent YoY.
LatAm currencies
Finally, we look at LatAm currencies’ core swaps.
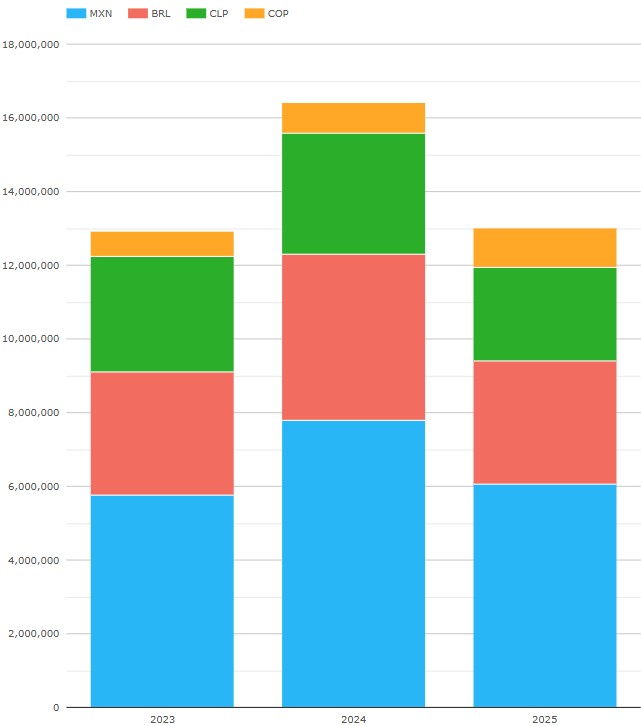
Chart 16: LatAm core swaps volumes (single sided gross notional, USD millions). Source: CCPView
Chart 16 shows that volumes of LatAm core swaps (IRS, OIS, zero coupon swaps) were $13.0 trillion in 2025 – down 21 percent YOY.
- MXN was the largest currency with $6.06 trillion – down 22 percent YoY.
- BRL was $3.35 trillion – down 26 percent YoY.
- CLP was $2.54 trillion – down 22 percent YoY.
- COP was $1.07 trillion – up 28 percent YoY, the only growing currency.
CME had over 95 percent of each currency in 2025. CME gained 1.5 percent of BRL, lost 0.9 percent of CLP, and lost 2.4 percent of COP – all of these to or from LCH SwapClear. MXN shares remained flat with CME at 95.7 percent, LCH 2.9 percent and Asigna / MexDer at 1.4 percent.
That’s it
Skip back to the top to reread the key takeaways if you like.
We used 17 charts for a complete overview, while there is other data to look at, for example:
- Quarterly, monthly, weekly, and daily aggregation.
- IR Futures in the major currencies.
- US Treasury volumes.
- Credit Derivatives and FX Derivatives.
Please contact us for information on CCPView or more details on any of the above.