This blog reviews Q1 2026 cross-currency swap volumes and platform market shares, following on from our recent blog on a similar theme for the whole of 2025.
We focus on US-reported cross-currency basis swaps in USD versus the five other major currencies. We use SDRView to aggregate volumes, DV01, and trade count by month and quarter.
Key takeaways
In Q1 2026, major currency cross-currency basis swaps had their highest ever quarterly volumes. Comparing Q1 2026 year-on-year (YoY) with Q1 2025:
- Notional volumes were up 36 percent, trade counts increased by 12 percent, and trade sizes increased by 22 percent.
- JPY overtook EUR as top currency by notional volume after a 51 percent increase.
- GBP took back third place by notional volume from CAD via a 67 percent increase.
- AUD outgrew the five-currency group in notional volume with 40 percent increase.
- Notional volumes shifted from D2D platforms to off-platform by 0.7 percent of the total.
- Tullet Prebon led D2D platforms with 54 percent of DV01 traded.
- D2D platform shares of DV01 traded shifted by between 1 and 2 percent each towards Tullett Prebon and ICAP and away from Tradition and BGC.
- The only individual currency not led by Tullett Prebon was JPY, in which Tradition’s lead decreased with a 12 percent shift to Tullett Prebon.
Read on for the charts and data created in SDRView.
Volume context
Based on the analysis in our recent blog, we limit this blog to cross-currency basis swaps in the 5 major currencies which were over 85 percent of the 2025 cross-currency swap notional volumes (which included non-major currencies’ basis swaps and fixed-float and fixed-fixed swaps)). We also exclude compression package types to narrow the focus on risk trading activity.
Cross-currency basis swap volumes by major currency
We start with notional volumes.
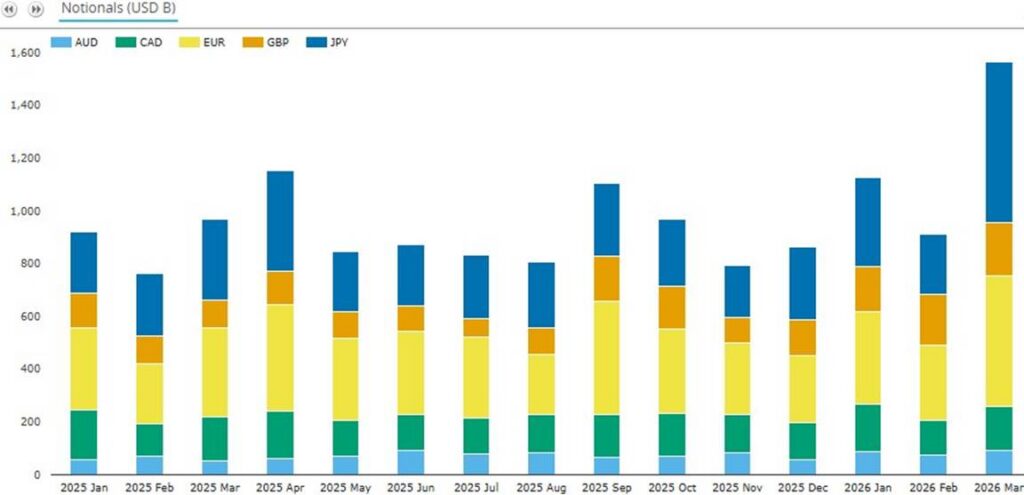
Chart 1: Volumes of SDR-reported cross-currency basis swaps by major currency (notional USD billions). Source: SDRView
Chart 1 shows that major currency cross-currency basis swap volumes in March 2026 were $1.56 trillion – their highest ever month, comfortably exceeding the prior record of $1.15 trillion set in April 2025.
Q1 2026 notional volumes were $3.60 trillion – their highest quarter, up 36 percent YoY and up 37 percent quarter-on-quarter (QoQ).
- JPY had the highest notional volumes with $1.17 trillion – up 51 percent YoY and up 60 percent QoQ.
- EUR was next with $1.13 trillion – up 29 percent YoY and up 33 percent QoQ.
- GBP had $570 billion – up 67 percent YoY and up 45 percent QoQ.
- CAD had $479 billion – up 0.3 percent YoY and up 6.8 percent QoQ.
- AUD had $253 billion – up 41 percent YoY and up 21 percent QoQ.
- We would like to hear suggestions on what has caused such disparate YoY growth percentages.
We see slower growth when we look at the same activity by trade count.
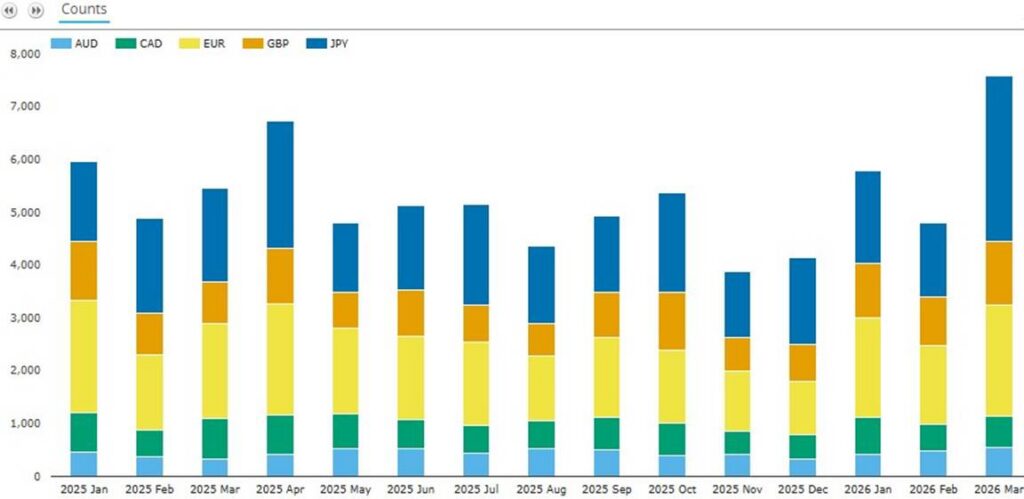
Chart 2: Volumes of SDR-reported cross-currency basis swaps by major currency (trade count). Source: SDRView
Chart 2 shows that cross-currency basis swap major currency trade count in March 2026 was 7,592 – its highest ever month, comfortably exceeding the prior record of 6,739 set in April 2025. Q1 2026 overall trade count was 18,190 also its highest ever quarter – up 11.5 percent YoY and up 36 percent QoQ.
- JPY had the highest trade count with 6,317 – up 24 percent YoY and up 32 percent QoQ.
- EUR was next with 5,483 – up 2.7 percent YoY and up 55 percent QoQ.
- GBP had 3,150 – up 17 percent YoY and up 29 percent QoQ.
- CAD had 1,779 – down 11.4 percent YoY and up 17 percent QoQ.
- AUD had 1,461 – up 25 percent YoY and up 29 percent QoQ.
The much lower YoY trade count increases than notional volume increases imply a marked increase in trade sizes (which we obtained by dividing notional volumes by trade counts).
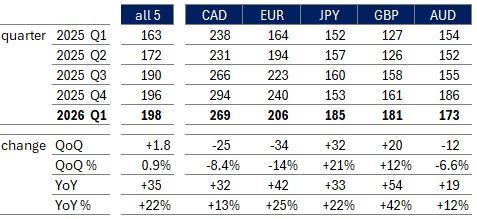
Table 1: Average trade size of SDR-reported cross-currency basis swaps ($ millions). Source: SDRView
Table 1 shows that Q1 2026 average trade notional across the five currencies was $198 million – up YoY by $35 million (22 percent) and up QoQ by 1.8 million (0.9 percent). In Q1 2026 (compared YoY with Q1 2025):
- CAD had the largest average trade notional at $269 million – up 13 percent.
- EUR was next with $206 million – up 25 percent.
- JPY had average trade size of $185 million – up 22 percent.
- GPB had the fastest-growing average trade size at $181 million – up 42 percent.
- AUD had average trade size of $173 million – up 12 percent.
- The surprisingly large CAD average trade notional can be better understood by noting (from SEFView figures) that both AUD and CAD have a comparatively shorter dated average maturity which will lessen the effect of average trade size on average trade risk. I’ll leave those of you with SEFView access to explore the tenor profiles by currency.
On- or off-platform
What is the short-term trend between D2D platforms and off-platform?
Chart 3: Platform type shares of SDR-reported major currency cross-currency basis swaps volume (percentage of notional). Source: SDRView
Chart 3 shows that shares between D2D platforms and off-platform (NA) were close to those in Q1 2025. (Note: no trades were reported for D2C platforms or single dealer platforms). If we compute shares at quarter level from downloaded notional volumes, Q1 D2D platforms’ share was 50.5 percent in Q1 2026 – slightly down YoY from 51.2 percent.
D2D market share
Now we see whether market share has shifted among D2D platforms. We use DV01 traded rather than notional as our metric given broker revenue is usually based on risk traded.
To find more reference information about each platform, google “MIC code XXXX”, where XXXX is the four-character platform ID referenced below.
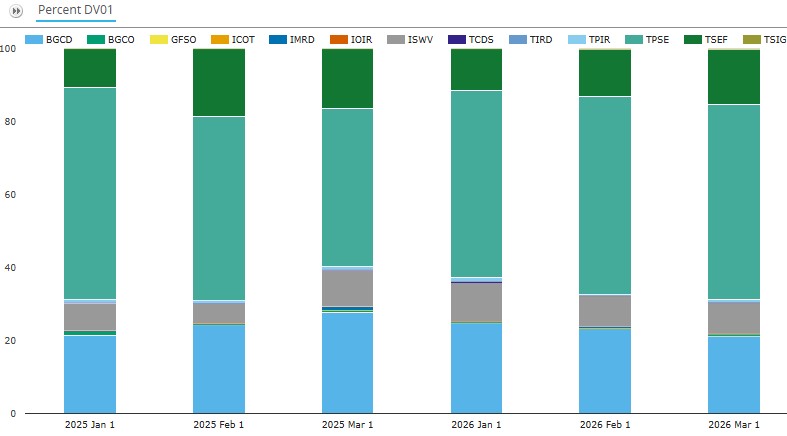
Chart 4: Platform shares of SDR-reported D2D platform cross-currency basis swaps risk traded (percentage of DV01). Source: SDRView
Chart 4 shows the shares of D2D platform cross-currency basis swap DV01 traded in the first three months of 2025 and 2026. The shares fluctuated a little month-by-month but, looking at quarter level, Q1 2026 D2D platforms’ shares were as follows:
- Tullett Prebon (led by TPSE) had the largest share with 54.0 percent – up YoY from 52.0 percent.
- BGC (led by BGCD) had 23.3 percent – down YoY from 24.9 percent.
- Tradition (led by TSEF) saw 13.1 percent – down YoY from 14.8 percent.
- ICAP (led by ISWV) took 9.5 percent – up YoY from 8.3 percent.
In summary, in 2025 Tullett Prebon gained 2.0 percent, ICAP gained 1.3 percent, Tradition lost 1.7 percent, and BGC lost 1.6 percent.
Now let’s look at platform shares by currency.
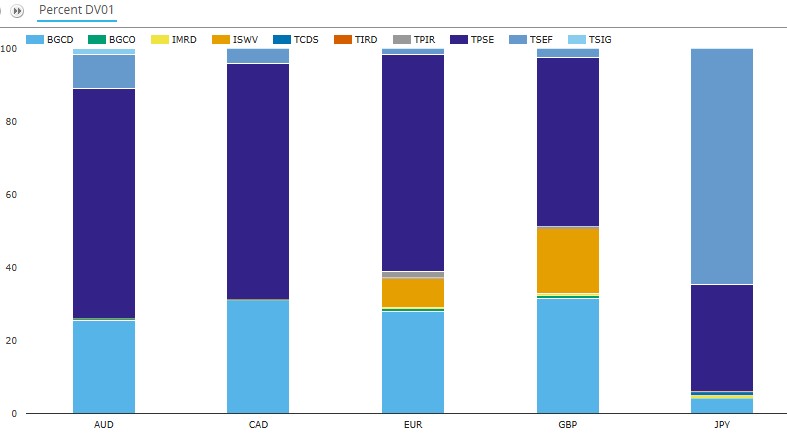
Chart 5: Q1 2025 platform shares of D2D platform cross-currency basis swap risk traded (percentage of DV01). Source: SDRView
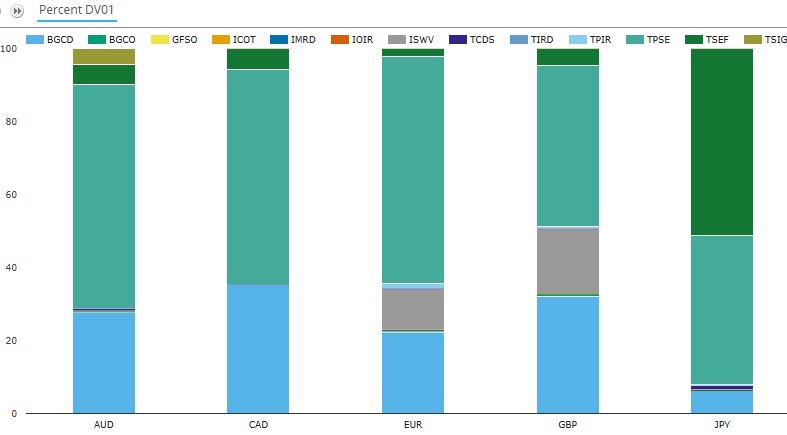
Chart 6: Q1 2026 platform shares of D2D platform cross-currency basis swap risk traded (percentage of DV01). Source: SDRView
Note: the color coding is inconsistent between Charts 5 and 6 because BGC’s GFSO and ICAP’s ICOT and IOIR had cross-currency basis swaps reported in Q1 2026 but not in Q1 2025.
Charts 5 and 6 illustrate that in Q1 2026 compared with Q1 2025:
- Tradition’s lead in JPY decreased by 13.5 to 51.2 percent, while Tullett Prebon’s second-place share increased by 11.9 to 42.2 percent.
- Tullett Prebon’s lead in EUR increased by 2.2 to 63.6 percent, while BGC’s second-place share decreased by 6.1 to 22.5 percent.
- Tullett Prebon’s lead in GBP decreased by 2.0 to 44.8 percent, while BGC’s second-place share increased by 0.5 to 32.8 percent.
- Tullett Prebon’s lead in CAD decreased by 5.9 to 58.8 percent, while BGC’s second-place share increased by 4.2 to 35.4 percent.
- Tullett Prebon’s lead in AUD increased by 1.3 to 66.1 percent, while BGC’s second-place share increased by 2.0 to 27.9 percent.
End note
Skip back to the top to reread the key takeaways if you like.
We used six charts and one table for a complete overview, but there is a lot more data in SDRView and SEFView.
Please contact us for information on our data products, or for more details on any of the above analysis.