
Liquidity
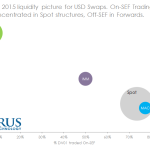
Clarus tools help our users monitor liquidity risk across Swaps markets. In this blog, we quantify how much risk has traded this year across a broad range of swap subtypes, and across venues. We show how our clients can use SDRView to stay on top of the risks they are running. Liquidity Concerns According to […]
Technical Analysis in Swaps
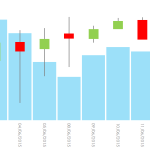
Following on from last week’s look at the volatility in EUR swaps markets, I wanted to switch my attention to see the knock-on effect in USD swap markets. So let’s look at some of the Technical Analysis that is possible via our suite of SDRView tools. Is That an Outright or a Spread Sir? One […]
The Issue with Anonymous Order Books in Swaps

The conversation seems to be heating up again about the topic of anonymous order books for the OTC swap market. The topic has been out there for well over a year, however really had not been in the press or acknowledged by the CFTC until SEFCON V in November 2014. It remains un-addressed. The CFTC […]
Swap Equivalents via Waves
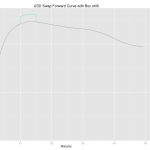
In a recent paper, “Calculating Delta Risks and Hedges via Waves (2015)“, Hagan deals with an old practical problem–determining risk and hedges on an interest rate book. In older systems a delta hedge report is often implemented by perturbing quotes used to construct the yield curves, restripping the curves and then revaluing the book. As […]
Mechanics of Asset Swaps and Government Bond Swap Spreads
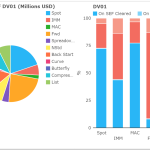
Last week we looked at the US Markets and Spreadovers, that trade as a spread to underlying US Treasury bonds. These are not the only structures that trade in the market. Other currencies and other strategies yield a variety of alternate structures. Matched Maturity Asset Swap In some markets, government bond issuance is nowhere near as frequent as in […]
Mechanics and Definitions of Spreadovers (Swap Spreads)
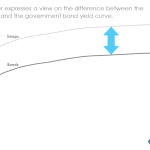
We define the characteristics and mechanics of a Spreadover or Swap Spread (“U.S. Dollar Swap Spread” in CFTC parlance). The inclusion of Spreadovers in our SDR products allows us to look at the volume of Swaps that are traded as a spread to Government Bonds. Spreadover Definition Trading strategy; to take a view on the difference in rates between an Interest Rate Swap and […]
BIS and Clarus Data: The $200 trillion reconciliation
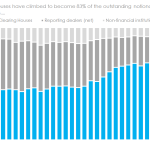
What is the relationship between Clarus data and the Bank for International Settlements (BIS) data? It is a great question to ask. On the whole, BIS data is delayed by nearly six months; Clarus data is available in close to real-time. For Cleared swaps, CCPView data is easily reconciled to the BIS and is shown to be virtually identical. This […]
Data Visualisation for Swaps – a Tufte Approach
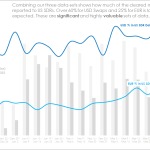
Data visualisation is meant to take something complex and make it simple and easy to understand. When I saw this in a blog recently, I immediately thought “Hey, that’s what Clarus do!” Interest piqued, I’ve begun delving into the fast-evolving field. As a Swaps-trader for over ten years, this aspect of the industry pretty much […]
What percentage of the market is in the US SDR data?
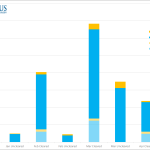
We analyse the SDR data in light of the whole market in the cleared Rates space. SDR data is shown to represent over 60% of total-market volumes at a trade-by-trade level. That’s huge! It’s funny how times change. Next month, the BIS will update their semi-annual review of OTC Derivatives. As recently as 2013 I would have to (manually) […]
OIS Swap Nuances
Overnight Indexed Swaps (OIS) are fixed-float swaps where the floating leg index is a compounded overnight interest rate. For short dated swaps, those less than 1Y, the coupon structure is usually zero coupon. For longer dated swaps, the fixed leg has a similar structure as the fixed leg on a regular LIBOR swap. Some of […]