
Q3 FXD volumes: higher in NDF/cleared spot FX, lower in FX options/cleared forwards
This blog looks at Q3 2026 volumes of FX derivatives (FXD), following the record volumes noted in the Q2 edition. Key takeaways Q3 2026 FXD volumes were a mixed bag: Read on for more analysis, explanation and volume charts and statistics from CCPView and SDRView. Cleared FXD volumes We look at cleared FXD by product type: NDFs, FX […]
Single name CDS activity surges across Big Tech and European Financials
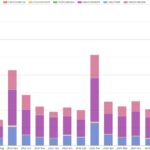
This blog looks at the most active issuer names traded in September 2026 on US-reported single-name credit default swaps (CDS). This follows the March 2026 edition in the series – aligned to the conventional CDS volume peaks near March and September IMM dates. Key takeaways Data coverage I use the “Most Active” tab from SBSDRView to […]
Q3 rates swaps volumes: new USD high, other majors off highs
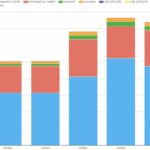
This blog covers Q3 2026 volumes of global cleared rates swaps risk-trading products focusing on OIS, fixed-float IRS, and zero-coupon swaps – including each product for a currency if it had a material volume share. We exclude FRAs (primarily used for reset exposure hedging) and basis swaps (primarily used for interest rate basis hedging). Key takeaways In Q3 […]
Q3 cross-currency volumes were 26% below Q1 while BGC, ICAP, and Tullett Prebon gained market share
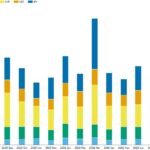
This blog reviews Q3 2026 US-reported volumes and D2D platform market shares of major currency cross-currency swaps risk-trading, continuing the quarterly series from the Q2 edition. Key takeaways In Q3 2026 major currency cross-currency basis swaps: Read on for supporting analysis of charts and data created in SDRView. Blog scope We continue to focus on US-reported […]
Q3 D2D platform rates swaps: Tullett Prebon and electronic platforms gain share
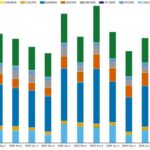
This blog reviews the Q3 2026 D2D platform market share dynamics of major currency rates swaps risk-trading, continuing from the last quarterly edition. Key takeaways We sourced the charts and statistics from SDRView. Background Here we focus on D2D platforms’ bread-and-butter trading activity in cleared OIS and fixed float IRS. We exclude compressions to keep the focus on risk-trading. […]
Large swings in Q2 FX IM optimization shares
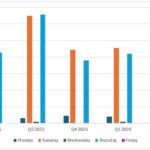
We estimate Q2 2026 FX IM optimization (IMO) hedge volumes and market share, based on US-reported daily NDF volumes sourced from SDRView. Key takeaways Q2 2026 estimates indicate that: If Capitolis can overcome its late mover disadvantage, it should expect further market share gains from LSEG (London Stock Exchange Group) and OSTTRA. Background If you […]
Record Q2 2026 CCP IM for ETD
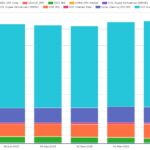
From the end of June 2026 quarterly CPMI-IOSCO Quantitative Disclosures by clearinghouses captured by CCPView, this blog focuses on cleared IM for rates swaps, credit derivatives (CRD), and exchange-traded derivatives (ETD). Key takeaways The Q2 2026 disclosures show different IM dynamics across the three product groups: IM for cleared rates swaps Chart 1: IRS IM by […]
Q2 FCM customer seg: large US banks gave up 4+% combined YoY
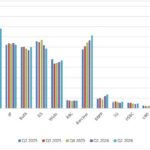
This blog looks at the market shares of customer segregated margin (customer seg) of US-regulated derivatives clearing brokers (FCMs) at the end of Q2 2026. Key takeaways At the end of Q2 2026, the biggest year-on-year (YoY) market share changes were as follows. Clearing broker market shares Derivatives client clearing brokers make most of their […]
Q2 rates compression: D2C platforms share up 5.9% YoY
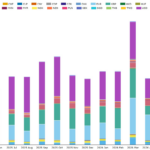
This blog is the Q2 2026 edition of our regular blog on US-reported rates swaps compression. Key takeaways Scope and data context As it was for the prior blog, our scope is US-reported compression of cleared “core” rates swaps, which we define to include OIS, fixed float IRS, and basis swaps and therefore excludes FRAs, […]
Q2 swaption volumes: BGC share down 6.1% YoY
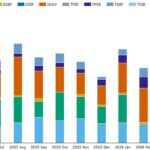
This blog reviews Q2 2026 US-reported swaption volumes and D2D platform market shares – following the Q1 edition of this series. Key takeaways After a Q1 record of $8.10 trillion, G4 currency swaptions US-reported activity returned to 2025-like levels in Q2 of $5.74 trillion “package notional” – down 5.6% year-on-year (YoY) and down 29% quarter-on-quarter […]