Mechanics and Definitions of Spreadovers (Swap Spreads)
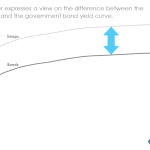
We define the characteristics and mechanics of a Spreadover or Swap Spread (“U.S. Dollar Swap Spread” in CFTC parlance). The inclusion of Spreadovers in our SDR products allows us to look at the volume of Swaps that are traded as a spread to Government Bonds. Spreadover Definition Trading strategy; to take a view on the difference in rates between an Interest Rate Swap and […]
April 2015 Review – Lower Volumes
Continuing with our monthly review series, let’s take a look at Interest Rate Swap volumes in April 2015. First the highlights: April 2015 volumes were the lowest since November 2014 However 2015 YTD volume are up 47% from the same period in 2014 SEF Compression volumes were also down from March FOMC meeting on April 28-29 once again […]
BIS and Clarus Data: The $200 trillion reconciliation
What is the relationship between Clarus data and the Bank for International Settlements (BIS) data? It is a great question to ask. On the whole, BIS data is delayed by nearly six months; Clarus data is available in close to real-time. For Cleared swaps, CCPView data is easily reconciled to the BIS and is shown to be virtually identical. This […]
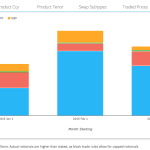
Data Visualisation for Swaps – a Tufte Approach
Data visualisation is meant to take something complex and make it simple and easy to understand. When I saw this in a blog recently, I immediately thought “Hey, that’s what Clarus do!” Interest piqued, I’ve begun delving into the fast-evolving field. As a Swaps-trader for over ten years, this aspect of the industry pretty much […]
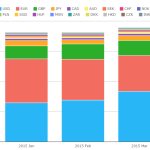
What percentage of the market is in the US SDR data?
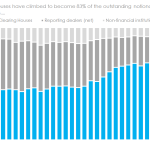
We analyse the SDR data in light of the whole market in the cleared Rates space. SDR data is shown to represent over 60% of total-market volumes at a trade-by-trade level. That’s huge! It’s funny how times change. Next month, the BIS will update their semi-annual review of OTC Derivatives. As recently as 2013 I would have to (manually) […]
Canadian Derivatives Reporting to SDRs
Following on from my earlier articles looking at European Trade Reporting and OTC Derivatives Reporting in Japan, I thought I would look at other jurisdictions starting with Canada. Canadian reporting came into force for Dealers on 31 October 2014 and for Non-Dealers will do so on 30 June 2015. Overview of Requirements Key points: OTC Derivatives […]
March 2015 Review – Bloomberg out in front
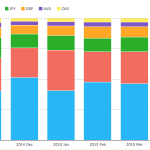
Bloomberg are #1 for SEF liquidity in Q1 2015 whilst Tradeweb saw the highest overall volumes. We saw record USD Swap volumes reported to the SDRs in March 2015, with our review highlighting increasing compression activity. The great month for the industry was rounded-out with over 60% of volumes traded across a SEF. USD IRS On-SEF $1.56trn in notional traded across SEFs during March […]
SDR Alerts, Terminations and Screen Real Estate

One of the challenges we face in a world of mass information is getting our applications to be always open and used on a desktop or mobile device. Even in the Capital Markets domain with six or nine monitors common on a traders desk, it is not easy to achieve this. So much news, information, data […]
The IMM Roll for Swaps – What is it and what are the volumes?
Every quarter, monthly SEF volumes are distorted artificially higher by IMM roll activity. What is it and how can we identify the trades? The History of the IMM Roll The International Monetary Market (IMM) was a division of the CME back in the 1970s. There is a great essay here for the history buffs. In […]
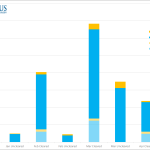
Compression List Trading On SEFs
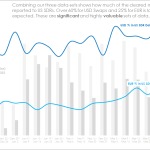
Compression List Trading volumes have continued on their upward trend this year and in this article I will look into the what the data shows both in terms of volumes and also SEF market share. On SEF Compression Lists By Month Lets start with an SDRView Res chart of monthly gross notionals in G4 currencies […]