Central Counterparties recently published their latest CPMI-IOSCO Quantitative Disclosures and in this article I will highlight what the data shows, similar to my article on 1Q 2017 trends.
Background
Under the voluntary CPMI-IOSCO Public Quantitative Disclosures by CCPs, over two hundred quantitative data fields covering margin, default resources, credit risk, collateral, liquidity risk and more are published each quarter with a quarterly lag.
CCPView now has eight sets of quarterly disclosures, from 30 Sep 2015 to 30 Jun 2017 inclusive, which means we can observe both trends over time at one CCP and compare CCPs to each other.
Lets take a look at some of the main disclosures.
Initial Margin for IRS
Starting with the Initial Margin requirement for Interest Rate Swaps.
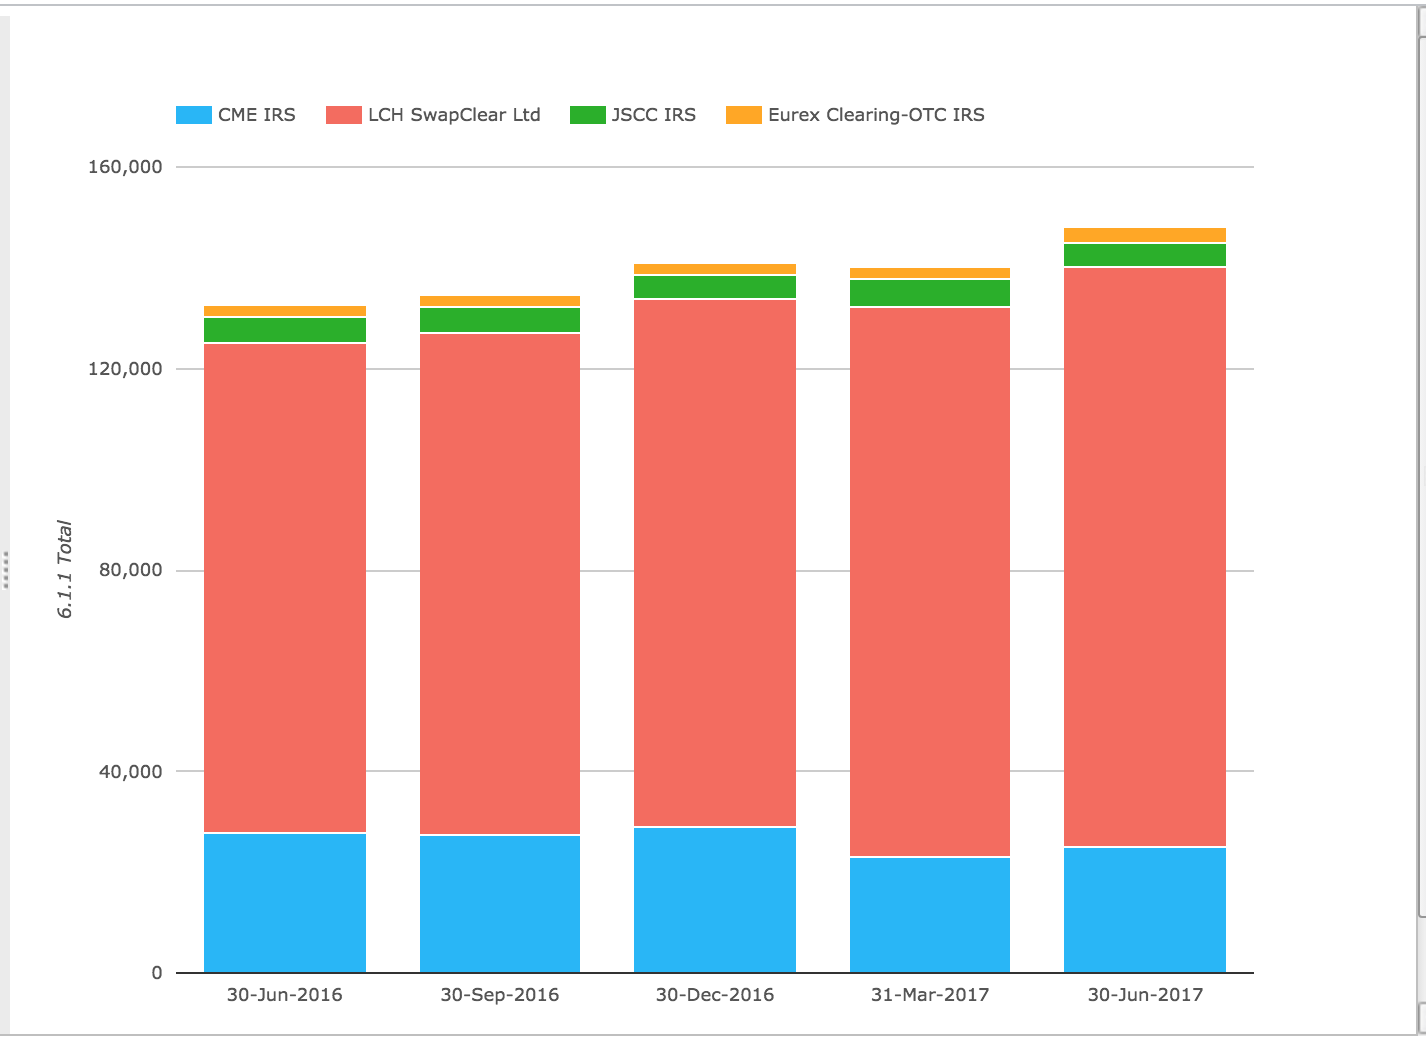
Showing:
- Total IM for these four CCPs was $148 billion on 30-Jun-2017
- This is up from $140 billion on 31-Mar-2017
- And up from $132.5 billion on 30-Jun-2016, a 12% increase (in USD terms)
- LCH SwapClear IM is $115 billion, up from $109 billion in the quarter
- CME IRS IM is $25 billion up 7% from $23 billion in the quarter
- JSCC IRS is down from $5.4 billion to $4.8 billion
- In JPY terms JPY IRS is down 12% at Y532 billion
- Eurex Clearing OTC IRS is up from $2.6 billion to $3.2 billion
- In EUR terms, Eurex is up €400 million or 16% to €2.8 billion
IM continuing to increase for each of these CCPs except for JSCC.
Initial Margin for CDS
Next lets look at the Initial Margin requirement for Credit Default Swaps.
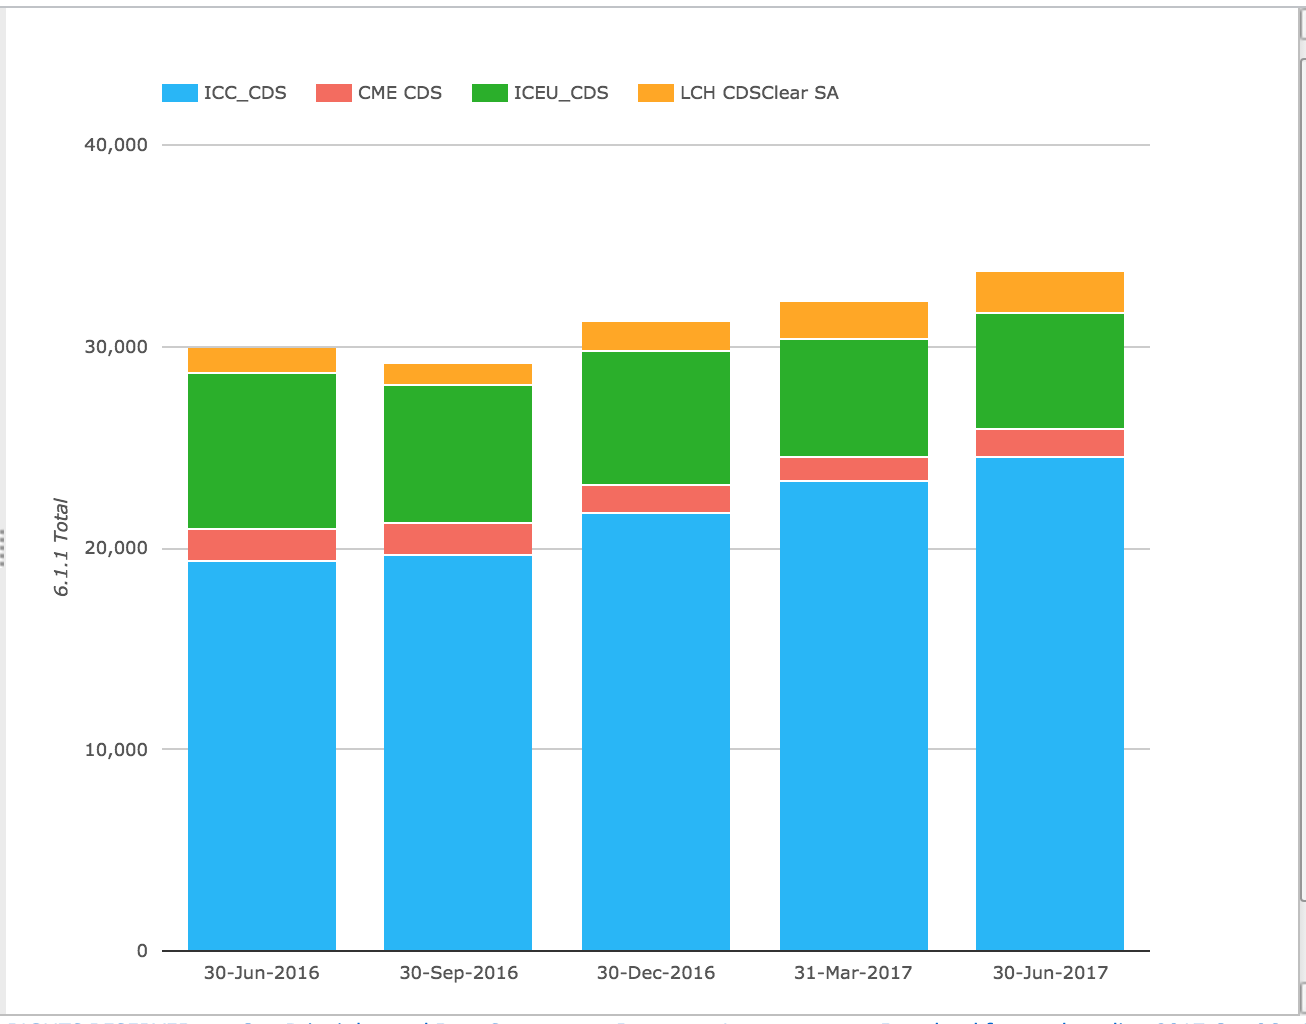
Showing:
- Total IM for these four CCPs was $33.8 billion on 30-Jun-2017
- This is up from $32.2 billion on 31-Mar-2017
- And up from $30 billion on 30-Jun-2016, an increase of 13% (in USD terms)
- ICE Credit Clear by far the largest at $24.5 billion, up from $23.3 billion in the quarter
- ICE Europe Credit next with $5.8 billion, is flat from them prior quarter
- LCH CDSClear with $2.1 billion, up from $1.9 billion
- CME CDS with $1.4 billion, down from $1.2 billion
ICE Credit Clear continuing to increase and with CME announcing its intention to shut down its CDS Clearing business, this USD CDX volume should also migrate to ICE Credit Clear.
Initial Margin for ETD
Next Initial Margin for ETD (Futures & Options).
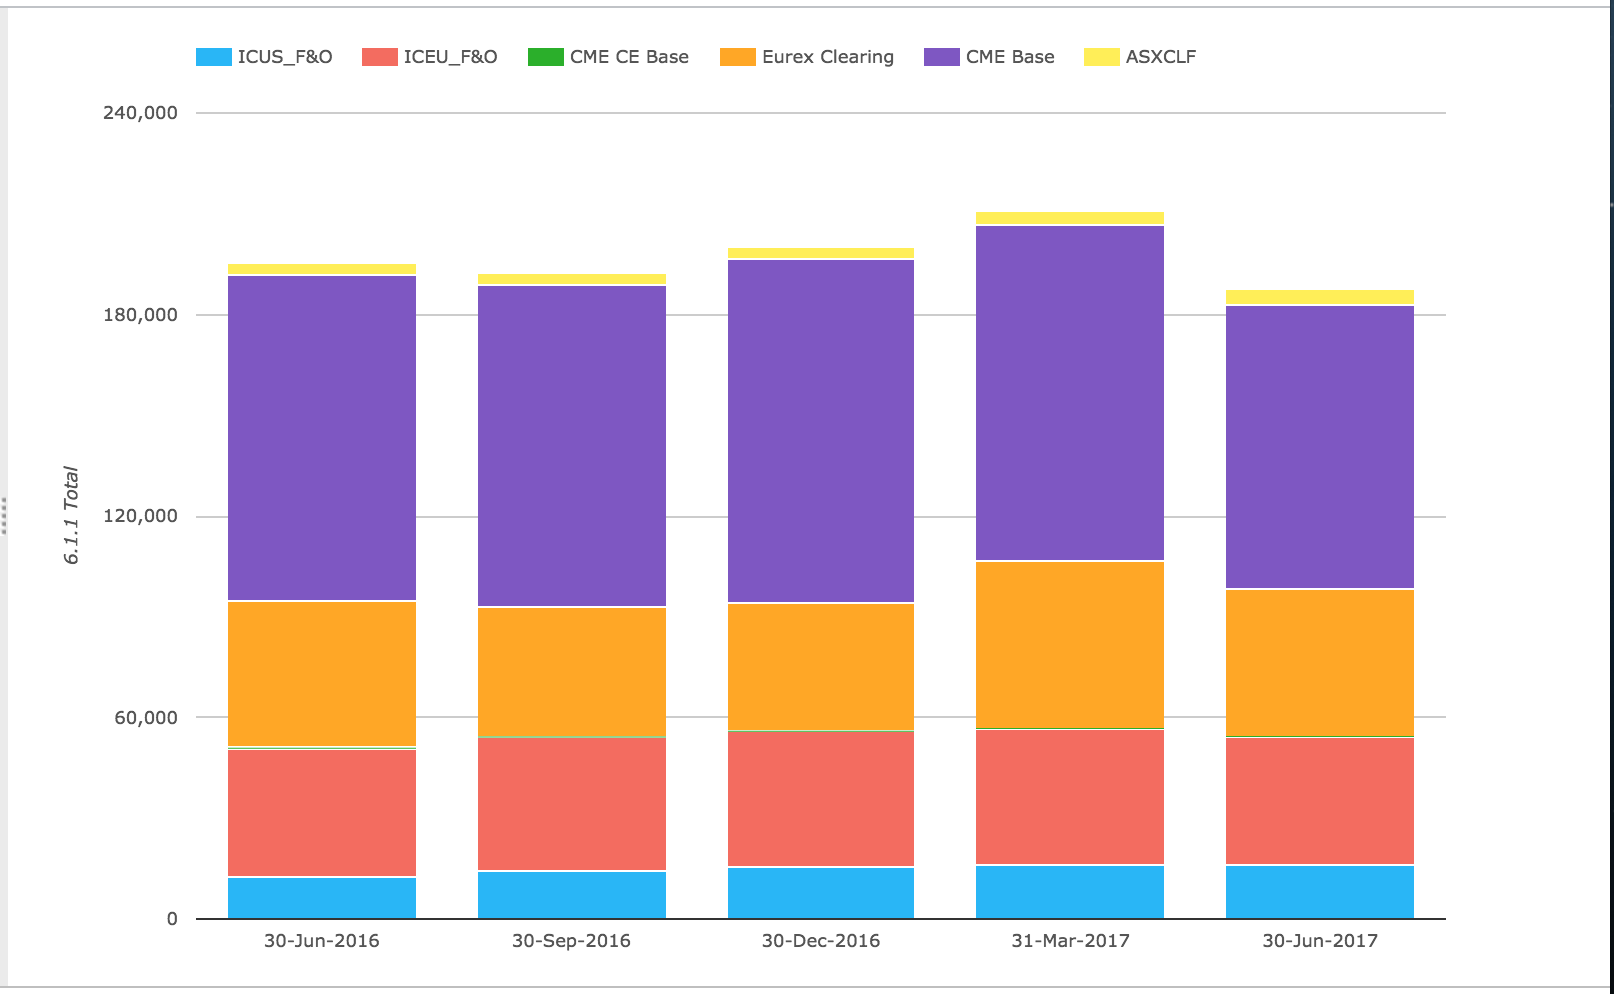
Showing:
- Total IM for these CCPs was $188 billion on 30-Jun-2017
- Down from $211 billion on 31-Mar-2017, a decrease of 11% (in USD terms)
- Down from $195 billion on 30-Mar-2017, a decrease of 4% (in USD terms)
- CME Base is the largest with $85 billion, down from $100 billion over the quarter
- In USD terms this is down 15%, most likely due to lower market volatility
- Eurex Clearing is next with $44 billion, down from $50 billion over the quarter
- In EUR terms this is down 17%, most likely due to lower market volatility
- ICE Europe F&O is $38 billion, down from $40.5 over the quarter
- ICE US F&O is $15.8 billion, down from $16.4 billion
- ASX CLF is $4.6 billion, up from $4.1 billion
So decreases in IM across the board, except for ASX bucking the trend.
VM Calls
The flows of VM between CCPs and their members are an interesting disclosure.
The maximum total variation margin paid to the CCP on any business day and selecting just four CCPs, CME, Eurex, ICE US F&O and LCH SwapClear.
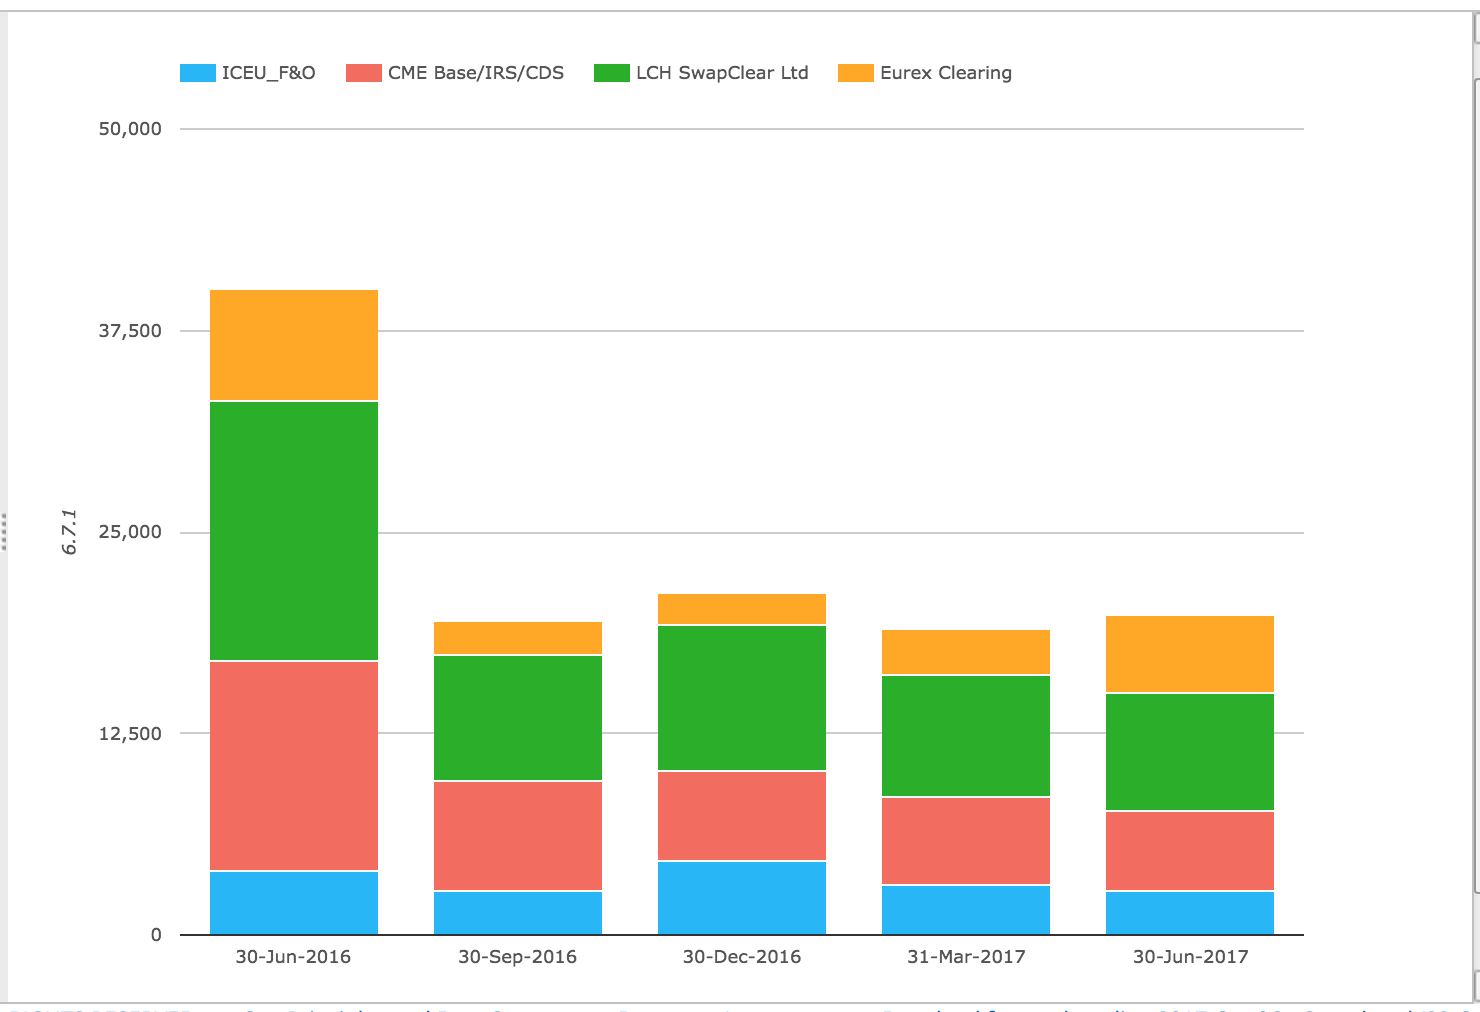
Showing:
- The past four quarters are similar and well down from the quarter ending 30-Jun-2016
- The most recent quarter total is $20 billion, down from $19 billion in the prior
- LCH SwapClear the largest with $7.4 billion on one day in the quarter
- CME next with $4.9 billion
- Eurex Clearing with $4.85 billion
- ICE Europe F&O with $2.7 billion
A glimpse into the size of cash that flows back and forth between CCPs and their members.
Credit Risk
In terms of Credit Risk, one of the interesting disclosures is the estimated largest aggregate stress loss (in excess of initial margin) that would be caused by the default of any two participants and their affiliates in extreme but plausible conditions, expressed as a peak day amount in the previous 12 months.

Showing:
- The most recent quarter was again higher than prior ones
- Eurex Clearing increasing the most, by $900 million to $4 billion
- LCH SwapClear increasing by $360 million to $4.9 billion
- CME Base and ICE Europe F&O un-changed from the prior quarter
No real concern with these amounts as each is well within the Default Resources of the respective CCPs, as given in Disclosures 4.1 (not shown).
Other Disclosures of Interest
A few others to point out (charts not shown):
- LCH SwapClear, number of client accounts has increased from 17,848 to 18,358, a slightly smaller increase than prior quarters
- CME Base Default Resources are down, with pre-funded participant contributions down from $4.6 billion to $3.6 billion, reversing the increase in the last quarter
- CME Base/IRS/CDS, the cash deposited at central banks is up from $31.9 billion to $38.8 billion, while unsecured cash at commercial banks is down a commensurate amount
- Eurex Clearing holds 99.3% of total participant cash deposits as cash at central banks, up from 97.3%
- ICE Europe F&O holds 70% of total participant cash deposits as secured cash at commercial banks (inc. reverse repo)
Many others to look at, but will leave those of you that are interested to do yourself with CCPView.
More Disclosures
CCPView has a lot more CPMI-IOSCO Disclosures covering Interest Rate Derivates, Credit Derivatives, Futures and Options and now Securities, currently from fifteen Clearing Houses each with many Clearing Services and we continue to add more.
With over 200 quantitative data fields and seven sets of quarterly figures from these CCPs, there is no lack of information for analysis and discussion.
If you are interested in this data please contact us for a CCPView subscription.