Clearing Houses 2Q 2020 CPMI-IOSCO Quantitative Disclosures are now available, so lets look at what the data shows. Summary:
- Initial margin for IRS is down 2% QoQ and up 33% YoY
- Initial margin for CDS is flat QoQ and up 51% YoY
- Initial margin for ETD down 13% QoQ and up 58% YoY
- Most CCPs with lower IM QoQ, as expected
- A few with higher IM QoQ: CDCC, CFFEX, ICE Europe
- Significant changes in how CME held the IM received
Background
Under the CPMI-IOSCO Public Quantitative Disclosures, CCPs publish over two hundred quantitative data fields covering margin, default resources, credit risk, collateral, liquidity risk, back-testing and more.
CCPView has 5 years of these quarterly disclosures for thirty-six Clearing Houses, each with multiple Clearing Services, covering the period from 30 Sep 2015 to 30 Jun 2020. This disclosure data provides insights into trends over time at one CCP and comparisons between CCPs.
Initial Margin for IRS
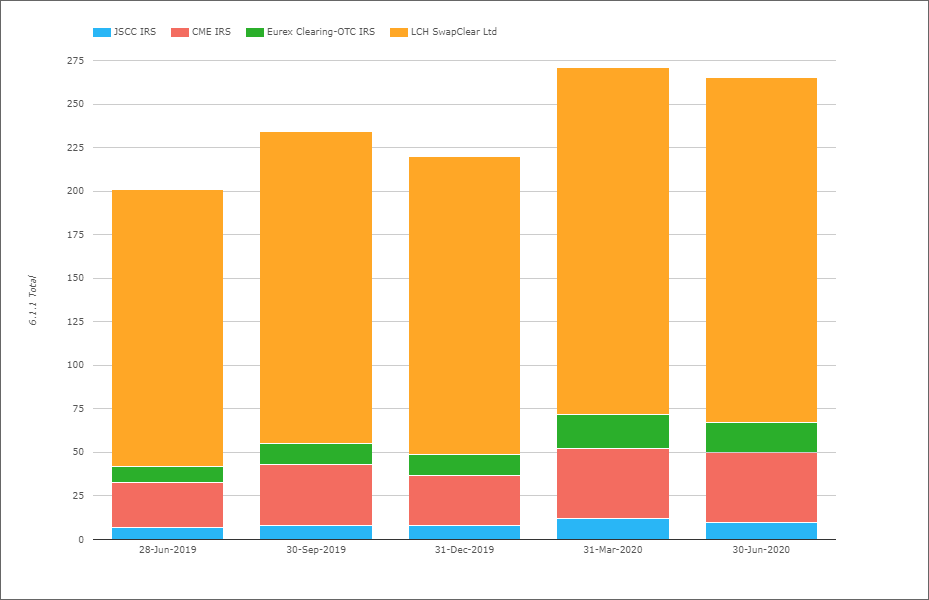
- Total IM for these four CCPs was $266 billion on 30-Jun-2020
- Down 2% from the record $271 billion on 31-Mar-2020
- And up from $201 billion on 28-Jun-2019, an increase of 33% YoY
- LCH SwapClear with $198 billion IM, down 1% QoQ and up 25% YoY
- CME IRS with $40.4 billion, flat QoQ and up 53% YoY
- Eurex OTC IRS with $17.5 billion, down 12.5% QoQ and up 100% YoY
- JSCC IRS with $10.3 billion, down 14% QoQ and up 50% YoY.
LCH and CME IMs remaining similar to their highs on 31-Mar-20; see Swaps Data: Initial Margin Soars in Q1 2020.
Initial Margin for CDS
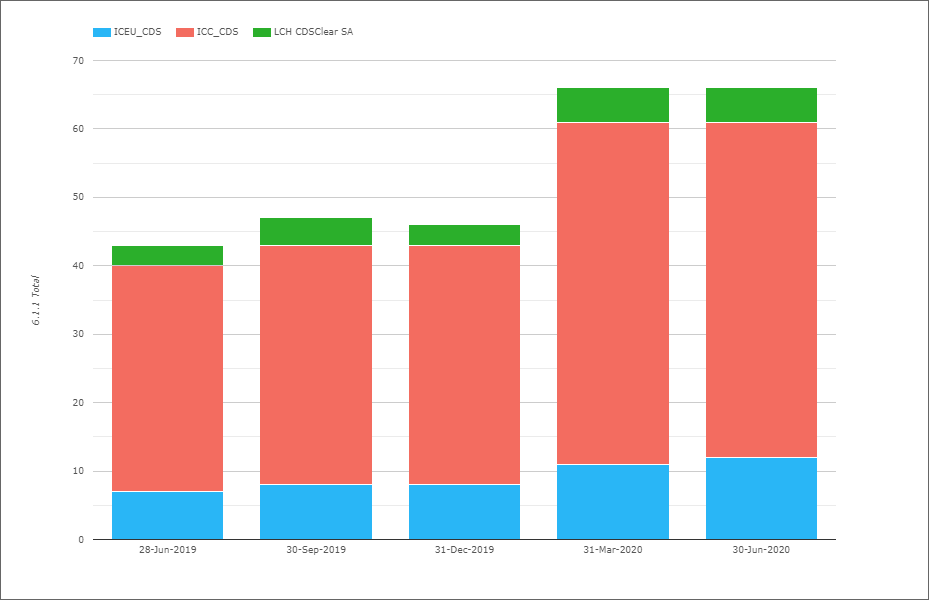
- Total IM was $66.3 billion on 30-Jun-2020, similar to 31-Mar-2020 and up $22 billion or 51% YoY
- ICE Credit Clear with $49 billion, down 4% QoQ and 15% YoY
- ICE Europe Credit with $7.9 billion, up 8% QoQ and up 72% YoY.
- LCH CDSClear with $4.9 billion, down 9% QoQ and up 50% YoY.
CDS IM remaining at the record levels we saw in March 2020, the Covid crisis quarter.
Initial Margin for ETD
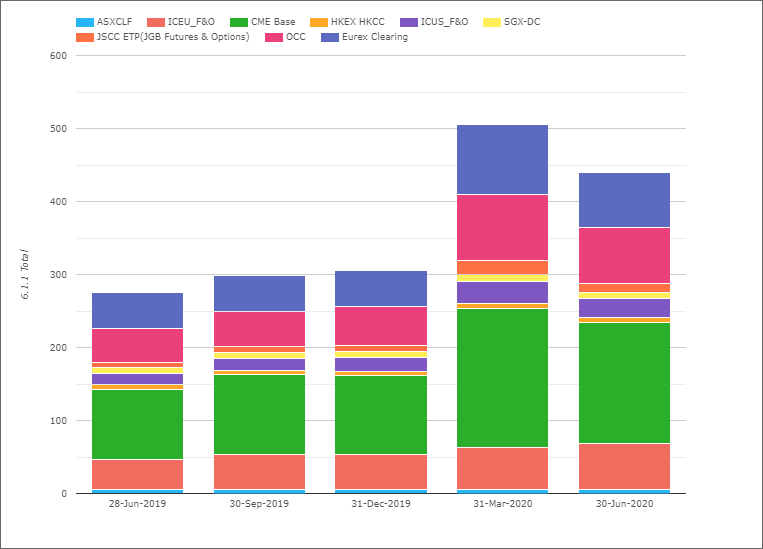
- Total IM for these was $422 billion on 30-Jun-2020
- Down $64 billion or 13% and up $155 billion or 58% YoY
- (Note the chart shows slightly higher totals as the Eurex Clearing amount includes OTC IRS IM, which I exclude in my figures)
- CME Base with $165 billion, down 13% QoQ and up 70% YOY.
- OCC with $76 billion, down 16% QoQ and up 64% YoY.
- ICE Europe F&O with $63 billion, up 10% QoQ and up 53% YOY.
- Eurex with $58 billion, down 23% QoQ and up 45% YOY.
- ICE US F&O $26 billion, down 16% QoQ and 11% YOY.
- SGX-DC $9 billion, up 3% QoQ and up 11% YoY
- HKEX HKCC with $7 billion, down 5% QoQ and up 16% YoY
- ASX CLF $6 billion, up 5% QoQ and 19% YoY
The total IM at the end of the second quarter remaining high and only 13% lower than the record highs we saw at the end of the first quarter, the reasons for which I covered in procyclical margins in the time of covid-19.
The majority of the CCPs with lower margin QoQ, which is expected given the lower volatility as compared to the first quarter. Only ICE Europe F&O, ASX CLF and SGX-DC bucking the trend with QoQ increases of 10%, 5% and 3% respectively.
Year on Year IM increases of 50% for the 4 largest CCPs.
Other Disclosures of Interest
There are lots of disclosures for clearing houses and other measures such as margin, default fund, credit risk, liquidity, margin models, back-testing and more; let’s highlight a few from the many CCPs we cover:
- CC&G Equities – Pre-funded aggregate member contributions to the default fund (4.1.4) decreased by 50% in the quarter from $2.5 billion to $1.25 billion
- CCIL Forex Forwards – Total initial margin required (6.1.1.) was $1.7 billion and disclosure 6.3.1 states “Initial margin stepped up by 50% to 100% for members with low credit rating”
- CCP.A – Maximum aggregate initial margin call on any given business day over the period (6.8.1) increased to $34.8 million from $4.4 million, with a prior high in the past year of $18 million in the 28-Jun-2019 quarter
- CDCC – Total initial margin required (6.1.1) increased to C$21 billion from C$18 billion and Total IM post haircut sovereign government bonds domestic held (6.2.5) increased to C$10.8 billion from C$9.8 billion
- CFFEX – Total initial margin held post haircut (6.2.15) increased to $14 billion from the $11.5 billion in prior quarter and $8.5 billion a year earlier
- CME Base – Client IM post haircut cash deposited at central bank of issue of the currency (6.2.1) decreased to $40 billion from $68 billion, while Client IM post haircut secured cash deposited at comercial banks (including reverse repo) (6.2.3) increased to $8 billion from zero and Client IM post haircut non-cash mutual funds /ucits (6.2.13) increased to $5.7 billion from $450 million
Actually I ended up looking at just the ones starting with C, which does seem to be the most popular starting letter. Of course I could go on highlighting disclosures for CCPs from A to B and D to T, as the current full list is:
- ASX, ATHEXClear, B3, BME, CCG, CCIL, CCP Austria, CDCC, CFFEX, CME, DTCC, EUREX, EuroCCP, HKEX, ICE Clear Credit, ICE Clear Europe, ICE Clear US, ICE NGX, JSCC, KDPW, Keler, LCH LTD, LCH SA, LME, MGEX, Nasdaq, NCC, Nodal, OCC, OMIClear, SCH, SHFE, SGX, SIX, TAIFEX, TFX.
But that is a task for those of you with access to CCPView.
More Disclosures
CCPView has disclosures from thirty six Clearing Houses, each with many Clearing Services, so there is a lot more data to look at covering Equities, Bond, Futures, Options and OTC Derivatives.
With over 200 quantitative data fields and quarterly figures from September 2015 to June 2020, that is a lot of data to analyse.