- USD IRS with record volume in 1Q 2021, LCH share up YoY
- SOFR Swaps at new highs, LCH dominant, CME share higher than in IRS
- EUR IRS volumes up, Eurex share up YoY as it’s gains continue
- €STR Swaps a record month, LCH dominant, Eurex share higher than in IRS
- JPY Swaps volumes up, JSCC and LCH share close to parity
- AUD Swaps remain subdued, 1Q volumes generally trend higher at LCH
- iTraxx Europe, volumes up, market share largely similar
- Single-name in Euro, ICE Clear Credit share gains over ICE Clear Europe
- Swaptions volume at LCH CDSClear and ICE Clear Credit
USD IRS
From CCPView, USD IRS only, so excluding OIS, Basis, ZC, VNS and FRAs.
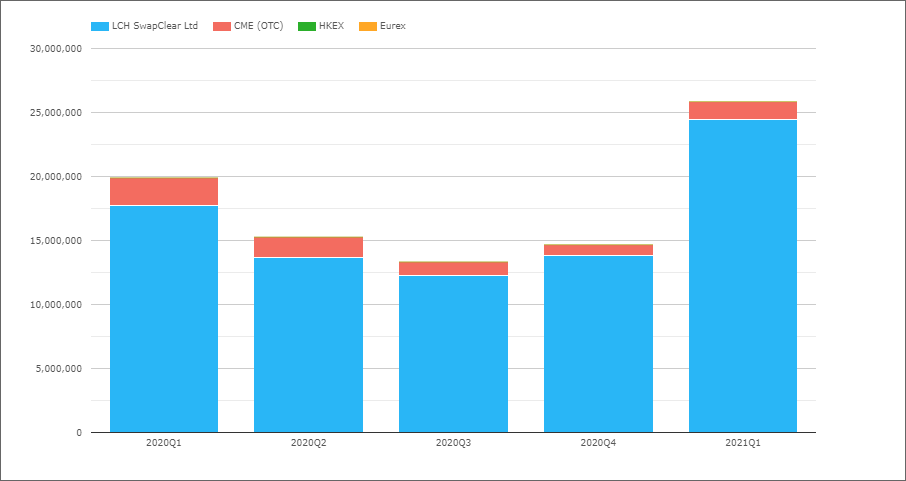
- 1Q 2021 with $25.9 trillion, a record quarter and up 30% from the $19.9 trillion in 1Q2020
- LCH SwapClear with $24.4 trillion, a share of 94.5% in 1Q 2021, similar to 4Q 2020 but up from 89% in 1Q 2020
- CME OTC with $1.4 trillion a share of 5.5%, similar to 4Q 2020 but down from 11% in 1Q 2020
- Comparing Client volumes at LCH SwapClear with CME OTC volumes (assuming all CME volume is client), LCH SwapClear with $10.6 trillion and CME OTC with $1.4 trillion, a share of 88% vs 12%
So we continue to see new record volumes in USD Swaps with March 2021 itself a record month in gross notional terms. However in DV01 risk terms, March 2020 with $9 billion exceeded the $8.4 billion in March 2021.
USD OIS
Overnight Index Swaps that reference FedFunds or SOFR.
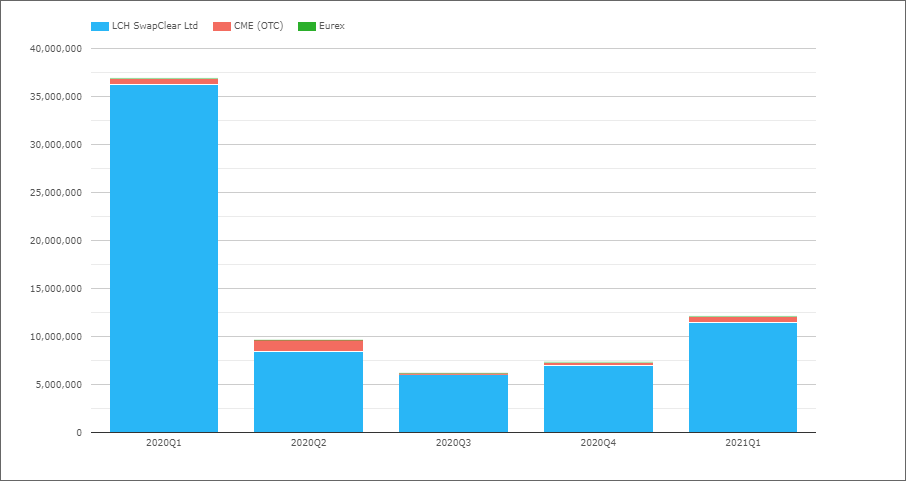
- 1Q 2020 with $12.1 trillion, up from the $7.3 trillion in 4Q 2020, but far below the record $37 trillion in 1Q 2020
- LCH SwapClear with $11.4 trillion a share of 94.4%, down QoQ from 96% and YoY 98.3%
- CME OTC with $675 billion a share of 5.6%, up QoQ from 3.9% and YoY from 1.7%
- Comparing LCH SwapClear client volumes with CME OTC shows $7.8 trillion vs $675 billion or 92.1% vs 7.9%
OIS Swap volumes on the up for three consecutive quarters, but just one third of the record highs in 3Q 2019 and 1Q 2020.
SOFR Swaps
Swaps which reference SOFR, both OIS and Basis.
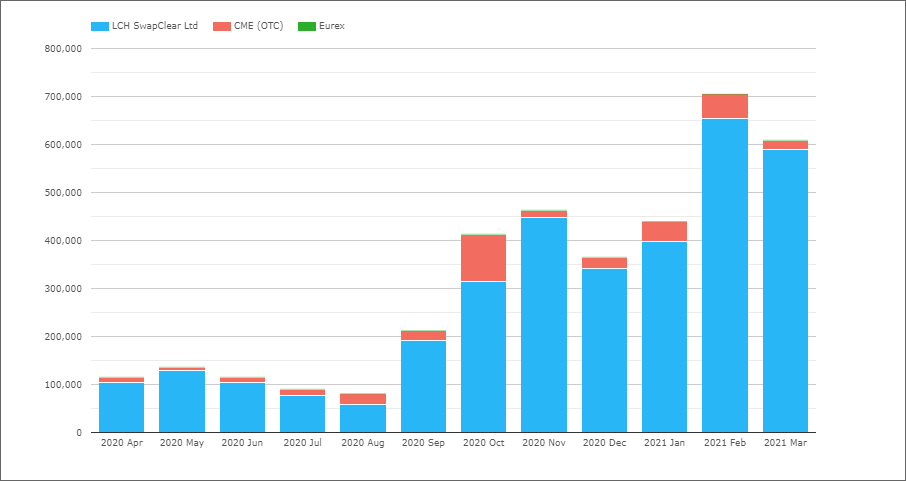
- Feb 2021 with $700 billion, a new record high, with Mar 2021 not far behind with $610 billion single sided gross notional.
- LCH SwapClear with 91% share and CME OTC with 9% over the 12 month period
So while 1Q 2021 shows good growth over 4Q 2020 in gross notional terms, it’s DV01 of $930 million is below the $1.1 billion in 4Q 2020 (the quarter when LCH and CME changed to SOFR discounting and conducted auctions).
CME share in SOFR is materially higher than it’s share in IRS or OIS.
EUR IRS
EUR IRS only, so excluding OIS, Basis, ZC, VNS and FRAs.
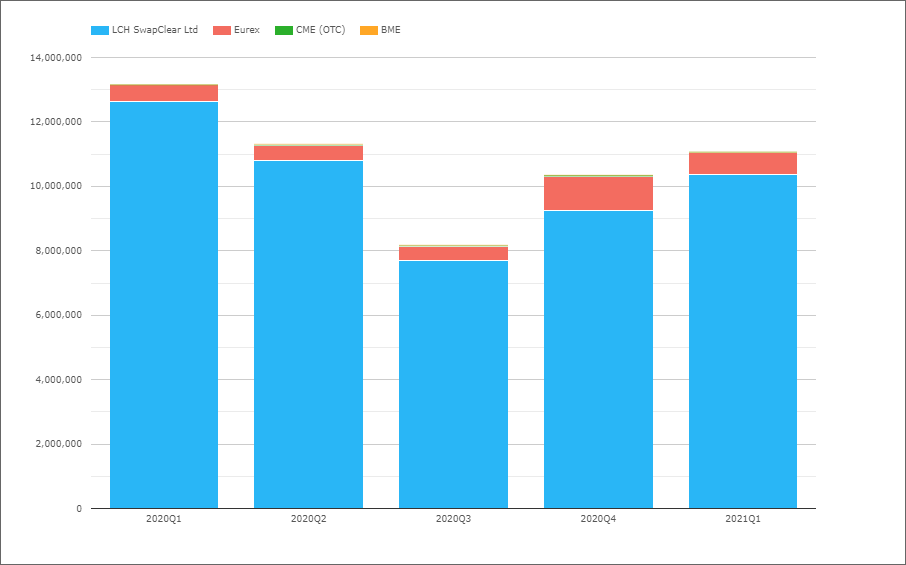
- 1Q 2021 with €11.1 trillion, up from €10.4 trillion in 4Q 2020 but down from €13.1 trillion in 1Q 2020
- LCH SwapClear with €10.4 trillion a share of 93.8%, up QoQ from 89.4% but down YoY from 96%
- Eurex with €680 billion a share of 6.1%, down QoQ from 10.2% but up YoY from 3.9%
- Comparing just Client volumes, we see LCH SwapClear with €4.1 trillion in 1Q 2021, Eurex with €300 billion and CME OTC with €6.6 billion, making the respective shares, 93.1%, 6.7% and 0.1% compared to the 1Q 2020 share of 96.8%, 3.1% and 0.1%.
EUR Swap volumes now with the second consecutive quarter of higher volumes breaking the down trend of the prior three quarters.
Eurex gaining market share with 6.1% in 1Q 2021 up from 3.9% a year earlier. Specific months with much higher share e.g. Nov 2020 with 16.2% and Mar 2021 with 8.9%, so one to watch closely in upcoming months.
EUR OIS
Overnight Index Swaps that reference EONIA or €STR.
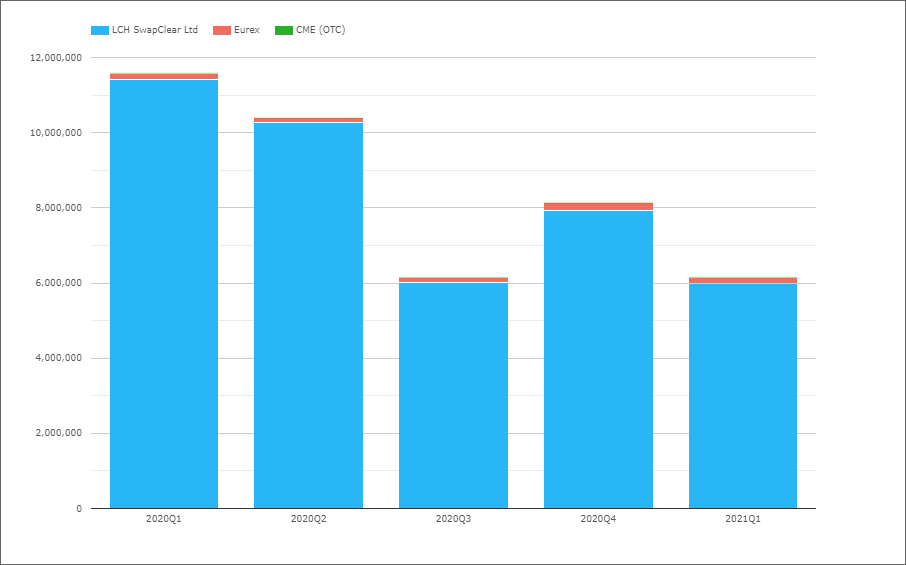
- 1Q 2021 with €6.1 trillion, down from €8.1trillion in 4Q 2020 and €11.6 trillion in 1Q 2020
- LCH SwapClear with €6 trillion a share of 97.4%, similar QoQ but slightly down YoY from 98.6%
- Eurex with €162 billion a share of 2.6%, up QoQ from 2.3% and YoY from 1.4%
- Comparing just Client volumes, we see LCH SwapClear with €3.3 trillion in 1Q 2021, Eurex with €52 billion, making the respective shares, 98.4 % vs 1.6% compared to the 1Q 2020 share of 99.2% vs 0.7%.
While Eurex share in OIS of 2.6% is up the 1.4% a year earlier, it remains much smaller than it’s IRS share of 6.1% in the most recent quarter.
€STR Swaps
Swaps which reference €STR, both OIS and Basis.
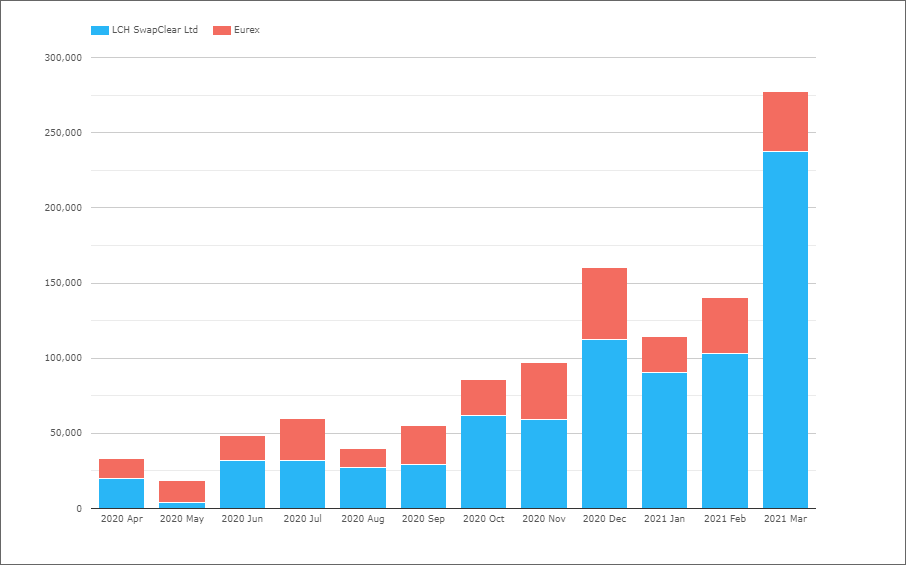
- Mar 2021 a record month with €278 billion of single sided gross notional.
- LCH SwapClear with 71.6% share and Eurex with 28.4% over the 12 month period, with significant variation month to month.
Noteworthy that Eurex share is so much higher in €STR than OIS (Eonia) or IRS (Euribor) swaps. Possibly the fact that €STR is a new reference index for swaps my have something to do with it, but as Eonia is now just fixed at €STR + 8.5bps, that does not seem a compelling enough reason. Could it be inertia with the much larger Eonia risk at LCH meaning participants prefer new OIS to keep referencing Eonia? Or could more recent particpants at Eurex have a preference for €STR over Eonia?
JPY Swaps
JPY Swaps all types, IRS, OIS, Basis, ZC, VNS.
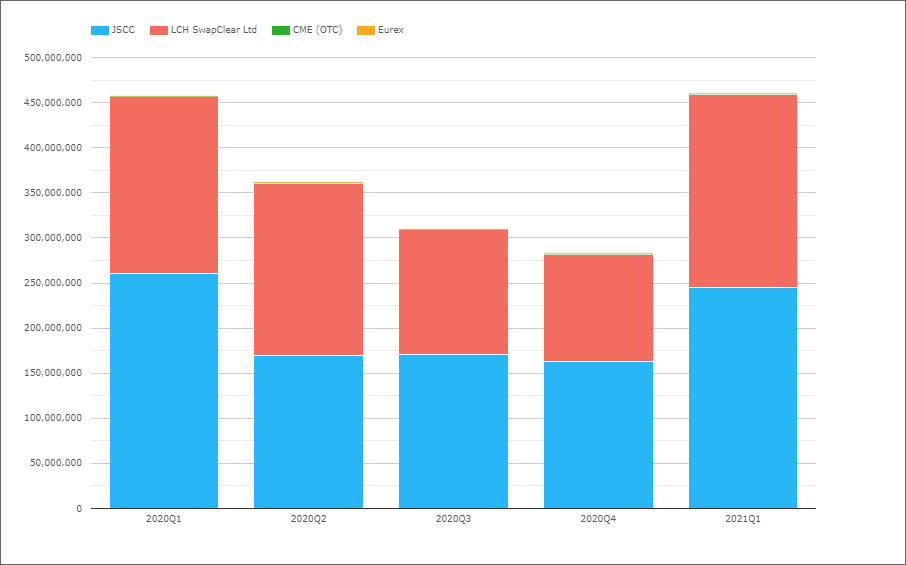
- 1Q 2021 with Y460 trillion, up from Y282 trillion in 4Q 2020 and similar to the Y457 trillion in 1Q 2020
- JSCC with Y245 trillion or 53.2% in 1Q 2021, down from 57.7% in 4Q 2020 and 57% in 1Q2020
- LCH SwapClear with Y215 trillion or 46.6% in 1Q 2021, up from 42.2% QoQ and 43% YoY
- LCH SwapClear client volume in 1Q 2021 was Y112 trillion, 52% of it’s overall volume.
JPY Swap volumes now climbing back up to the corresponding quarter in 2020 and firmly breaking the downward trend of the prior three quarters.
JSCC larger than LCH SwapClear, but losing 4% share from a year earlier, possibly down to internationals vs domestic participants trading activity.
AUD Swaps
AUD Swaps all types, IRS, OIS, Basis, ZC, VNS.
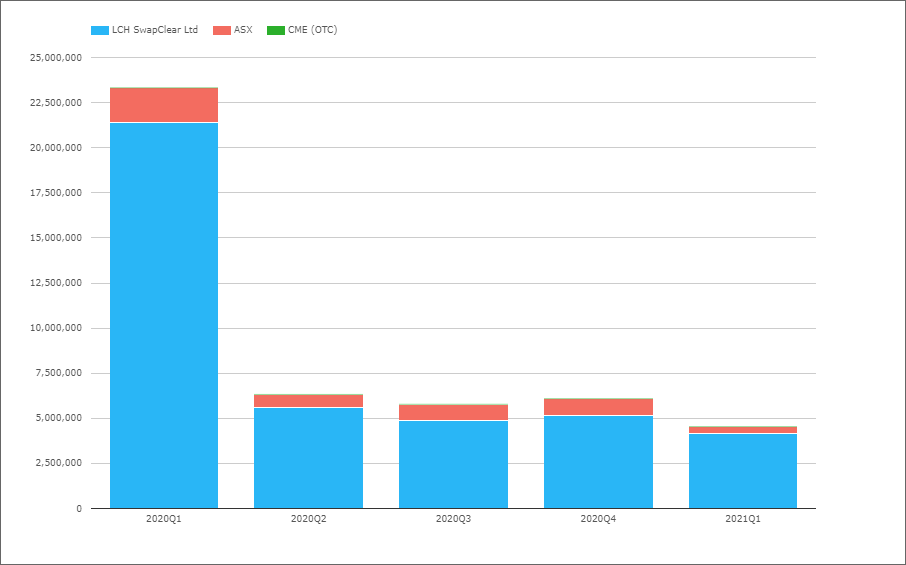
- 1Q 2021 with A$4.6 trillion, down from A$6.1 trillion in 4Q 2020 and the record $23.3 trillion in 1Q 2020, volumes continuing their downward drift as the RBA interest rate policy dampens market demand for swaps
- LCH SwapClear with A$4.1 trillion or 91.1% in 1Q 2021, up from 84.3% QoQ (4Q 2020) but similar to the 91.7% in 1Q 2020)
- ASX with A$400 billion or 8.8%, down from 15.6% QoQ and 8.3% YoY
- LCH SwapClear client volume in 1Q 2021 was A$1.8 trillion or 44%, compared to 55% in 3Q 2020.
So the AUD Swaps market with 12 months of significantly lower volume. Looking at 1Q in each of the past three years, LCH SwapClear market share in this quarter is always higher at 90%, most likely down to Australian holidays and less domestic vs international activity, compared to other quarters where it averages 85%.
CAD and GBP Swaps
I do usually cover CAD and GBP Swaps (see Volumes – 3Q 2020), however will skip this time; my excuse being the charts lack color with LCH SwapClear > 99% share and time is short for me to complete this blog.
Of-course those of you with CCPView access, can login and check out the volumes yourself. For those without and interested in a subscription, please do contact us for details.
So let’s turn next to a Swap product with competitive market share.
Credit Default Swaps
Index – iTraxx Europe family
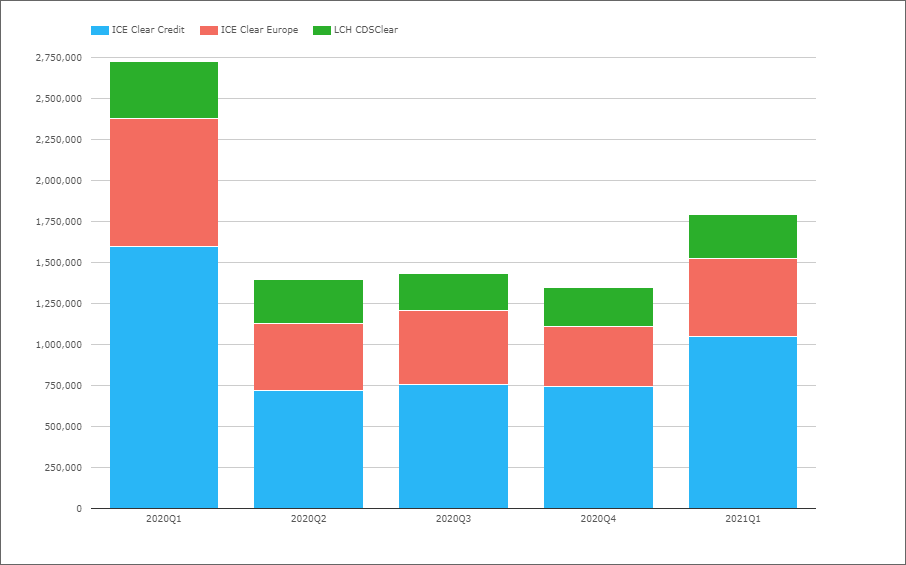
- 1Q 2021 with €1.8 trillion, up from €1.35 trillion in 4Q 2020 and down from €2.7 trillion in 1Q 2020
- ICE Clear Credit with €1.05 trillion in 1Q 2021, a share of 58.4%, down QoQ from 55.2% and similar to 1Q 2020
- ICE Clear Europe with €479 billion, a share of 26.8%, compared to 27.4% in the prior quarter and 28.7% a year earlier
- LCH CDSClear with €265 billion, a share of 14.8%, compared to 17.4% in the prior quarter and 12.8% a year earlier.
Single Name in Euro
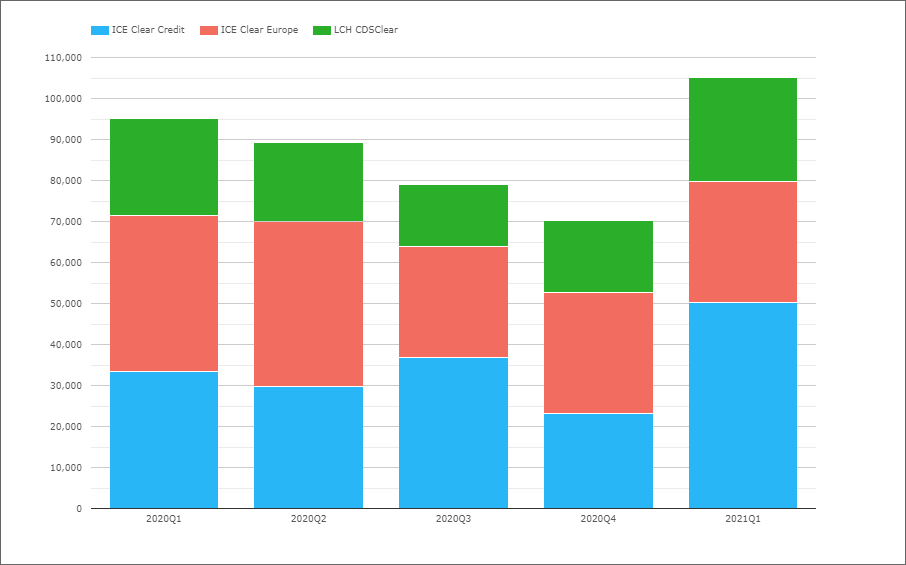
- 1Q 2021 with €105 billion, up from €70 billion in 4Q 2020 and €95 billion in 1Q 2020
- ICE Clear Credit with €50 billion in 1Q 2021, a share of 47.8%, up QoQ from 33% and 35% in 1Q 2020
- ICE Clear Europe with €29.5 billion, a share of 28.1%, compared to 42% in the prior quarter and 40.2% a year earlier
- LCH CDSClear with €25.3 billion, a share of 24.1%, compared to 25% in the prior quarter and 24.8% a year earlier.
Volumes in cleared single-name in Euro at €105 billion, an order of magnitude lower than the €1.8 trillion in Credit Indices in Euro.
Market share in Index with no material change, while in single-name ICE Clear Credit gaining from ICE Clear Europe; possibly a by product of Brexit and akin to the move to SEFs that we have observed in 2021.
Index and single-name in USD
As ICE Clear Credit has over 97% share, I am going to invoke the same defense as in the CAD & GBP section above; the lack of color making my time remaining vs effort vs value equation fall below today’s threshold.
So onto the last chart before we end.
iTraxx Swaptions
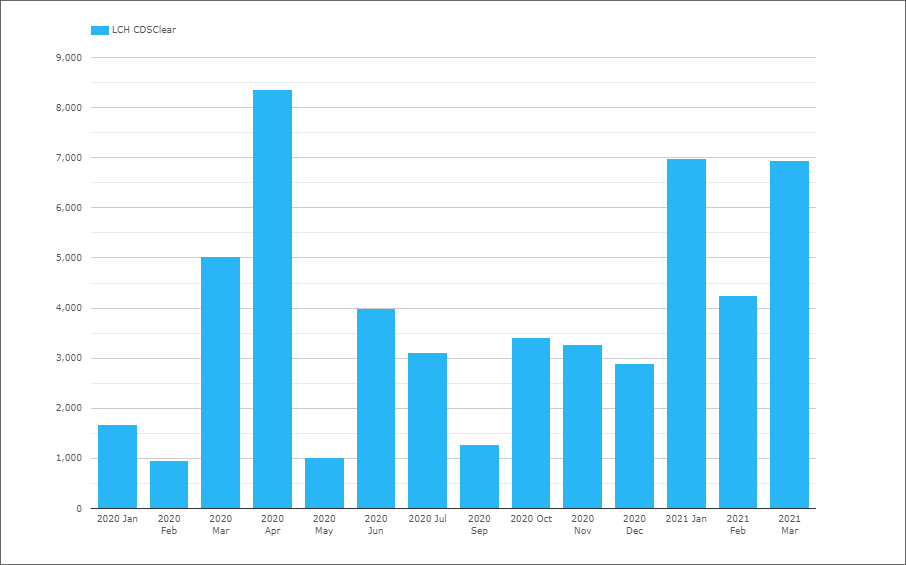
- LCH CDSClear with €6.9 billion in Mar 2021 and volume in every single month in the past year bar Aug-2020 (a European holiday effect to add to the Australian one we noted in the AUD Swaps section)
ICE Clear Credit has some volume in Swaptions on CDX.NA.IG, on 9 different days since commencement in Nov 2020, with Mar 2021 the most active with 6 days with volume and $2.65 billion in Feb 2021 and $2.4 billion in Mar 2021, so will be interesting to see how this progresses relative to iTraxx.
That’s It
There is a lot more data in CCPView.
Volumes by tenor buckets: 2Y, 5Y, 10Y, 20Y, 30Y.
Daily, weekly, monthly, quarterly or annual.
Open Interest as well as Volume.
Swaps in many more currencies and product types.
EM with Asia Pac, EMEA, LatAm.
Also Futures and Options in major currencies.
Please contact us if you are interested in a subscription.