Clearing Houses 3Q 2018 CPMI-IOSCO Quantitative Disclosures are now available, so lets look at what the data shows, similar to my CCP Disclosures 2Q 2018 article.
Summary:
- IR Swaps margin decreases for the first time quarter-on-quarter
- LCH SwapClear Client margin is lower
- ETD margin is up quarter-on-quarter
- CME ETD Client margin is higher
- New disclosures on the default at Nasdaq Clearing
- We now have B3 (BM&FBovespa) disclosures
Background
Under the voluntary CPMI-IOSCO Public Quantitative Disclosures, CCPs publish over two hundred quantitative data fields covering margin, default resources, credit risk, collateral, liquidity risk and more are each quarter with a quarterly lag.
CCPView has quarterly disclosures from 30 Sep 2015 to 30 Sep 2018 inclusive, which means we can observe both trends over time at one CCP and compare CCPs to each other.
Initial Margin for IRS
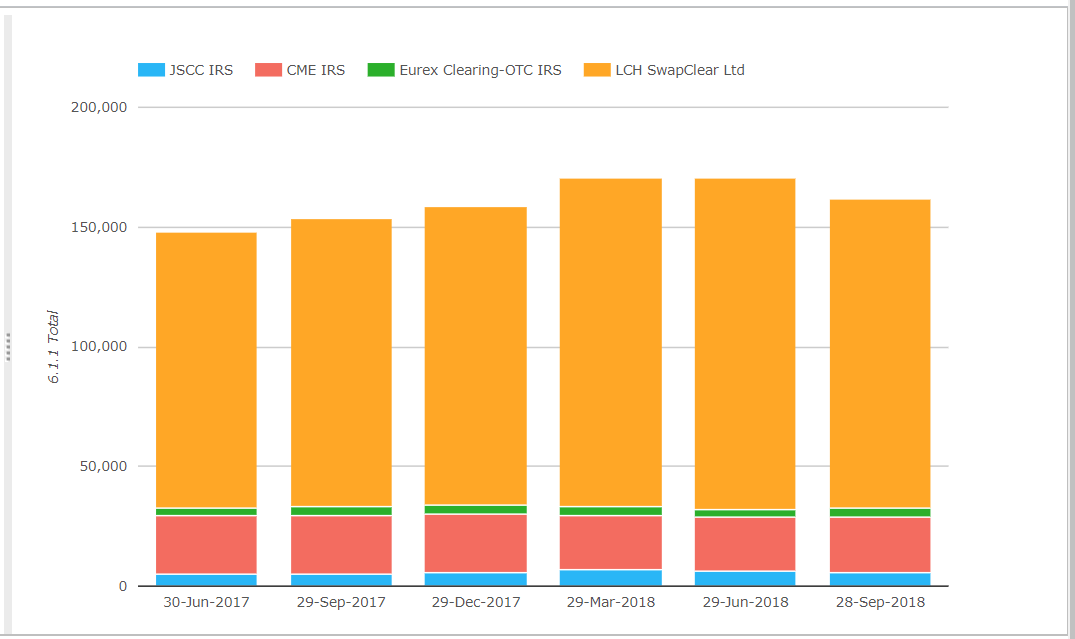
- For the first time we see a marked quarterly drop in the overall IM, from $170 billion at 29-Jun-2018 to $162 billion at 28-Sep-2018, a decrease of 6.2%, while year-on-year change is still up with an increase of $8 billion or 5.3%
- July and August are generally very slow months and may explain some of the drop, but we do not see a similar drop in the Sep-2017 quarter
- Looking at each CCP in the base currency of their IM
- LCH SwapClear is £99 billion, down £6 billion or 5.7% from the prior quarter and up £9 billion or 10.1% from a year earlier
- CME IRS is $23.2 billion, up 675 million or 3% from the prior quarter and down $1.5 billion or 6.1% from a year earlier
- JSCC IRS is Yen 674 billion, a decrease of 1.3% in the quarter and up Yen 115 billion or 20% from a year earlier
- Eurex OTC IRS is EUR 3.02 billion, a decrease of 1.9% in the quarter and down 1% from a year earlier
LCH SwapClear IM
As LCH SwapClear has the largest IM and is responsible from most of the decrease in the quarter, lets look in more detail into its figures.
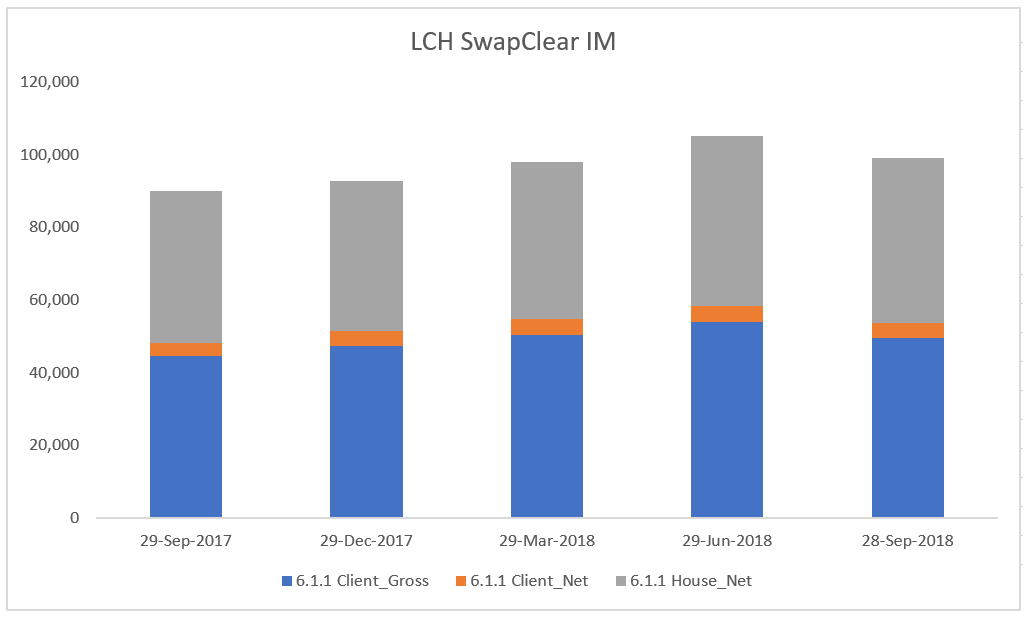
Showing that it is Client Gross IM that is down in particular between 29-Jun-2018 and 28-Sep-2018, decreasing from £53.8 billion to £49.4 billion, a decrease of 8.2%. This compares to House Net IM, decreasing from £46.7 billion to £45.5 billion, a decrease of 2.6%.
Year-on-Year, Client Gross IM is up 10.5% and House Net IM is up 8.9%.
However the quarterly drop in Client IM, got me thinking are we starting to see an impact from Brexit and clients shying away from clearing at LCH SwapClear?
There is no increase in the quarter at Eurex and the increase at CME is small, so we cannot say there is no move to either of these.
Or are we seeing the end of the quarter-on-quarter increase in Client IM at LCH as all Clients that are required or want to clear are now on-boarded?
Lets look for other disclosures that may shed some light:
- 19.1.1 Number of clients shows these increasing from 20,211 at 29-Jun-2018 to 20,830 at 28-Sep-2018, a similar rate to before.
So no sign here of any decrease in client on-boarding, quite the opposite.
Lets look at volume and outstanding notional (also in CCPView):
- Outstanding notional at LCH SwapClear at 28-Jun-2018 for Clients was $43.7 trillion and at 29-Sep-2018 it was $46.1 trillion, so no decrease there
- July and August 2018 were the lowest cleared volume months in 2018, but that is normal and it was the same in 2017
So I am left searching for a cause.
Initial Margin is not just a function of trade exposure, but also of recent market volatility and it might be that lower volatility in 3Q 2018 contributed to lower margin, reinforced by clients re-positioning their interest rate views.
Lets turn to ETD markets to see what they show and if that sheds any further light on volatility or exposure.
Initial Margin for ETD
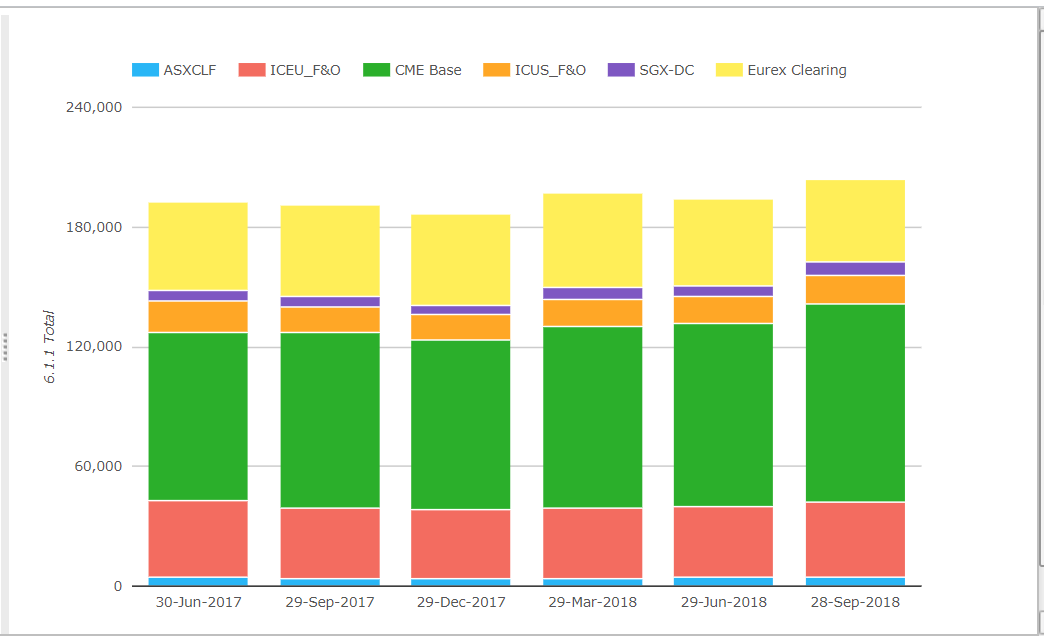
- Total IM for these CCPs was $204 billion on 28-Sep-2018, up 5% from 29-Jun-2018
- CME up QoQ in particular with Client Gross IM increasing by $8.6 billion or 11.3% to $85 billion and a total IM on 28-Sep-2018 of $99.7 billion
- Eurex Clearing is next with $41.6 billion, which is down QoQ from $43.4 billion
- ICE Europe F&O is $37.5 billion, which is up QoQ from $35.8 billion
- The others much smaller
The fact that CME and ICE Europe IM is higher would argue against lower market volatility. Granted CME and ICE Europe also clear other asset classes than interest rates, but interest rates will be a significant or dominant part of their IM, allowing us to draw a resonable analogy with LCH SwapClear’s interest rate swaps.
Eurex Client Net IM is 8.2% lower QoQ, which is a similar to the 8.2% decrease in LCH SwapClear Client Gross IM. Co-incidence or do we have our cause?
A reduction in long term EUR interest rate exposure by clients between 28-Jun and 29-Sep-2018, which would utilise Swaps at LCH and Futures at Eurex?
I could go on to look for evidence to confirm or deny this hypothesis.
But am sure one of our readers will know and kindly update me.
So in the interest of time I will move on.
Default at Nasdaq
My article Default at Nasdaq Clearing, covered the events in mid-Sep 2018 when Einar Aas, a Norwegian power trader was declared in default. In that article I looked at the CCP Disclosures available at that time, for 31-Mar-2018 and what these told us.
Lets look now at what the 28-Jun-2018 and 29-Sep-2018 disclosures add to our knowledge.
First the Default Fund.
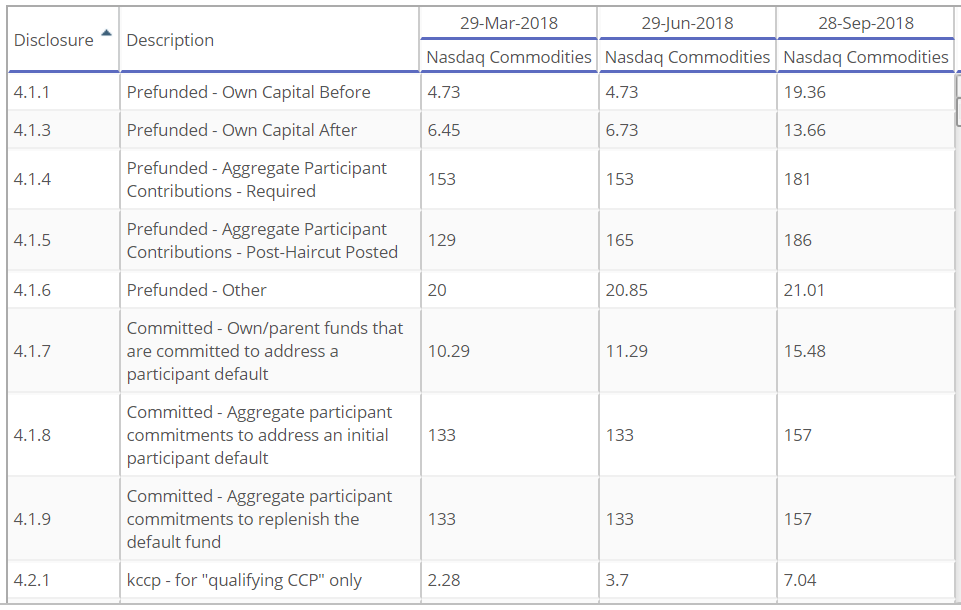
Showing that after the default, Nasdaq increased its prefunded own capital (skin-in-the game) by EUR 21.5 million, of which EUR 14.6 million was prefunded own capital before (default fund) and EUR 6.93 after.
Pre-funded member contributions increased from EUR 153 million to EUR 181 million.
Beefing up default resources subsequent to a member default that hits these resources, is a natural and sensible response.
And the last item in the table “kccp” is an input into the capital calculation for exposures to ccps. The fact that this number doubled from 3.7 to 7.04, will have a commensurate impact on bank members that need to capitalise their default fund exposures.
Next Stress Loss.
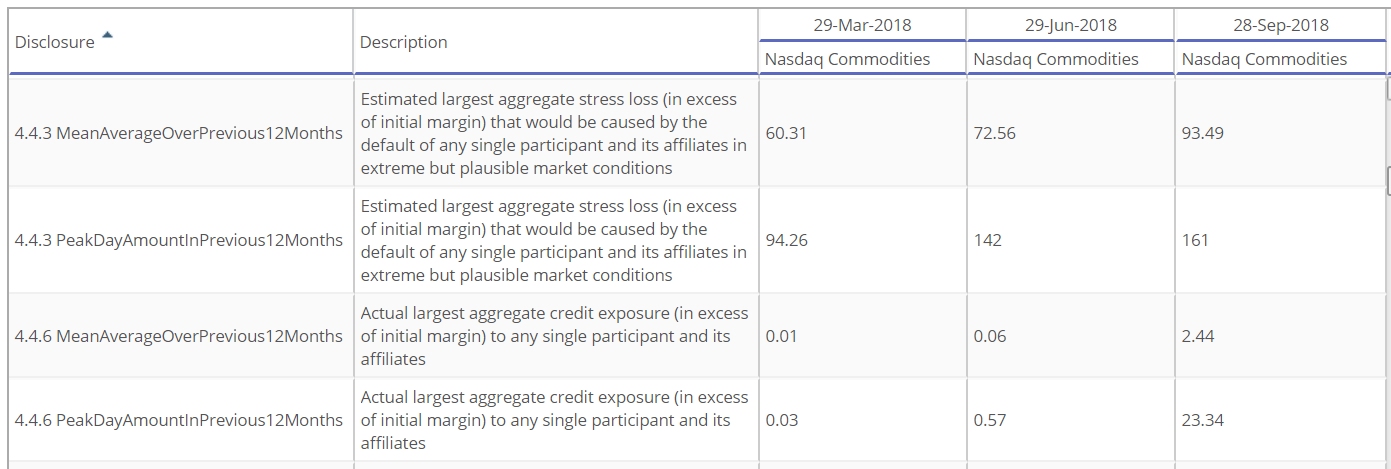
Showing the 4.4.3 Peak Amount of estimated largest aggregate stress loss In excess of IM that would be caused by default of a single member, increasing from EUR 94 million on 29-Mar-2018 to EUR 142 million and then EUR 161 million.
The actual hit to the Default Fund on 12-Sep-2018 due to the Einar Aas default was EUR 114 million, so within these bounds.
I don’t know what to make of the 4.4.6 Actual largest credit exposures numbers.
Info Related to Defaults
Then there is this.
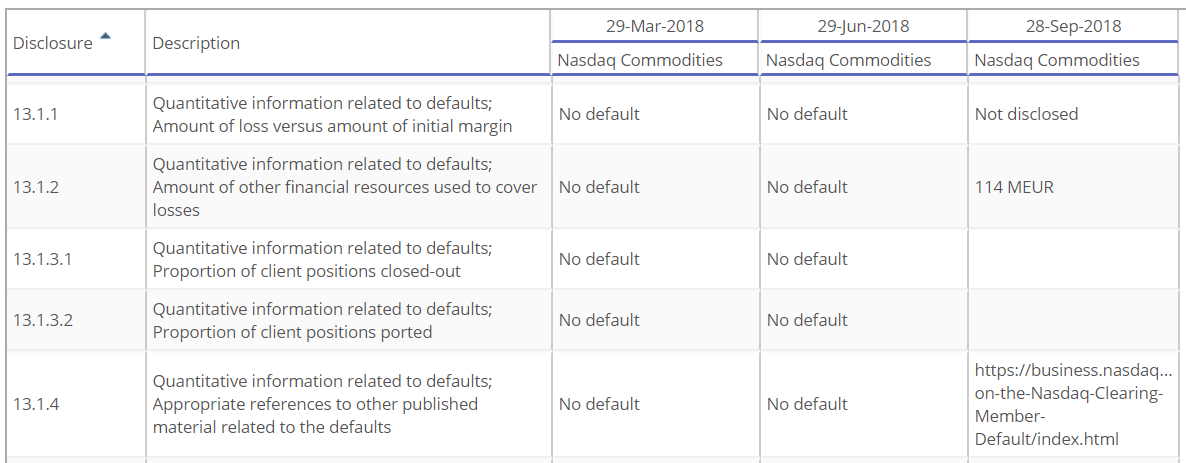
Hmm, we have the EUR 114 million loss figure, but nothing else.
I would have hoped that there were more interesting quantitative disclosures on the default e.g. what was the amount of VM call that the defaulter could not meet, how much IM did they hold that day, …..
Requires some thought, but given the need for transparency on defaults it would be helpful to get some better disclosures in this area. I know reports from regulators will make public much of the nitty gritty, but that is another set of documents to read.
Other disclosures
Other disclosures that I found interesting:
- The number of direct clearing members has dropped from 84 to 79 to 73
- The number of bank participants from 18 to 15 to 12
- The number of clients from 230 to 203 to 181
- Total IM held went up from EUR 1.5 billion to EUR 2.6 billion
- Percentage of open positions held by largest 5 clearing members at its peak was 52% and now 57%, while for IM it was 77% and now 81%
I will end there on Nasdaq Clearing.
At some point we will see public reports on the details of this default and out of that may comes changes in best practices or possibly even modifications to regulations, both topics for another day.
B3 – BM&FBovespa
Before we end, I wanted to look at a Clearing House we recently added to CCPView, B3, also known as BM&FBovespa, the Brazilian Clearing House, using the 29-Jun-2018 disclosures:
- Total IM Held is $76 billion and Total IM Required is $53 billion
- Large numbers indeed, up their with the largest CCPs e.g. larger than ICE Europe F&O
- Prefunded Default Resources include Own Capital Before of $153 million, Participants of $183 million and Other of 528 million and Committed to replenish the fund of 169 million
- In aggregate these look lower than the global CCPs we usually look at, but the CCP’s own capital (skin-in-the game) looks higher. Topics to delve into on another day
- IM is held largely in domestic government bonds
- Maximum total VM paid to the CCP on any day was $3.3 billion
- Maximum aggregate IM call on any day was $1.6 billion
- Number of domestic participants was 67 firms
- Number of clients was 54,237 (not sure if this is accounts)
- Percentage of open positions held by largest 5 clearing members at its peak was 59%, while for the 10 largest it was 84%
Interesting and given the size of the above numbers, definitely a globally significant CCP that I will look at again in future.
That’s it for today.
Thank you for bearing with me to the end.
We now collect data from thirty one Clearing Houses.
Most with many clearing services.
That is a lot of interesting data.
Please ask us for a trial or demo of CCPView.