Following on from my blog LCH makes gains vs CME in USD IRS, I wanted to provide an update for June.
Weekly Volumes
Using CCPView lets look at weekly volumes of gross notional for just USD IRS for the past 8 weeks and compare CME IRS Volumes with LCH SwapClear Volumes (All and not just Client).
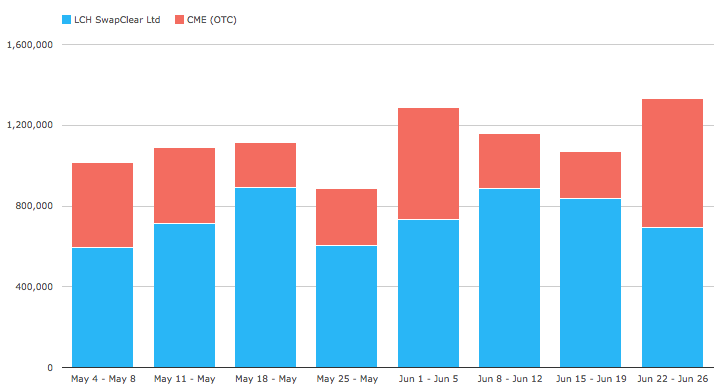
Showing that:
- Jun 15-19 volume was lower than the prior week at $1.07 trillion
- With Both CME and LCH lower
- Jun 22-26 volume was a high for the period at $1.33 trillion
- With CME massively up and LCH down
And the same data by percentage share.
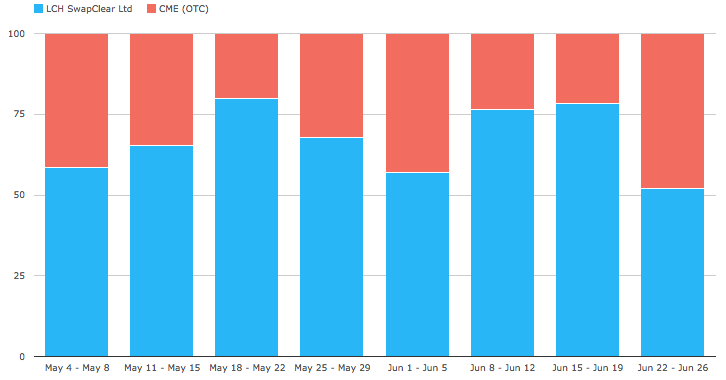
Showing that:
- Jun 15-19, CME Share is 22% vs LCH 78%
- This is similar to the previous week and the second lowest CME share in the past 8 weeks
- Jun 22-29, CME Share is 48% vs LCH 52%
- This is the highest CME share in the period
What is going to explain these swings in volume share?
DAILY VOLUMES
Lets switch from Weekly to Daily volumes and focus on the past two weeks.
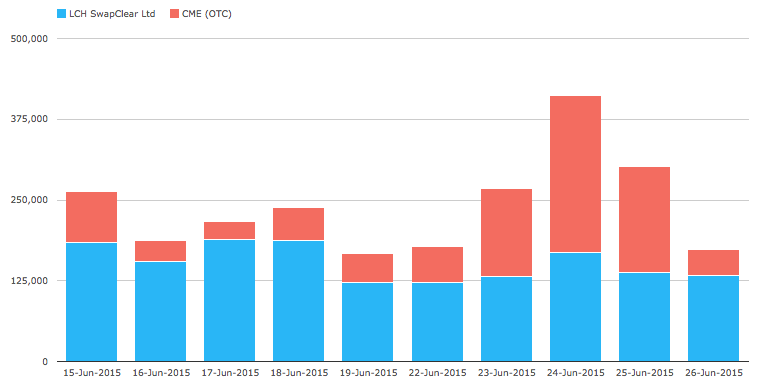
Showing:
- Three days last week where CME volume is higher than LCH
- 23, 24, 25 Jun
- With 24 Jun volume being comparable to the spikes we observed on 19 May and 2 Jun
Let’s drill-down on the CME numbers for 24-Jun
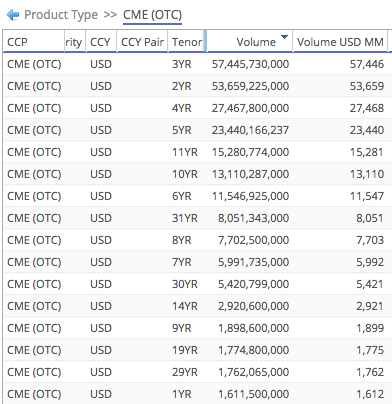
Showing:
- 2Y and 3Y each with more than $50 billion
- 4Y & 5Y each with more than $20 billion
- 10Y & 11Y each with more than $13 billion
The paired volumes in adjoining years give us a clue as this looks like IMM Roll activity.
Is there a way we can corroborate with a different data source?
SEF Data
Lets turn to SEFView and look at the daily volumes in USD IRS for the week of 22-26 Jun.
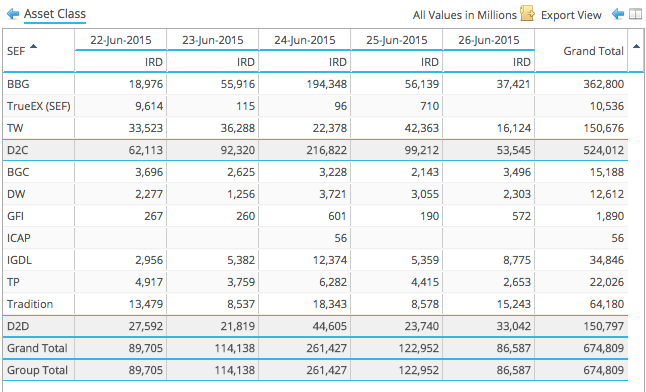
Showing that:
- Bloomberg posted a massive $194 billion on 24 Jun
- Bloomberg on 23 and 25 Jun was also much higher than usual
- Tradeweb also looks high than usual on 22, 23, 25 Jun
Now lets drill-down on the Bloomberg number for 24 Jun
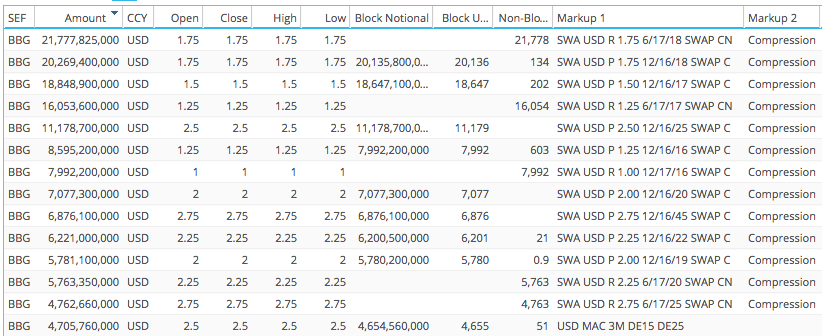
And we have our answer:
- $21 billion of Jun 2018 rolling into $20 billion of Dec 2018
- A total of $41 billion and not too far from the 3Y CME figure of $57 billion
- $16 billion of Jun 2017 rolling into $19 billion of Dec 2017
- A total of $35 billion and not too far from the 2Y CME figure of $53 billion
- Coupons for these look like MAC and not IMM
We could do the same for other tenors, other days and both BBG and Tradeweb.
But am sure the point will hold, so I will leave it there.
Client Clearing Volumes
And then just Client Volumes in USD IRS as reported by LCH and CME (all) for the past 4 months.
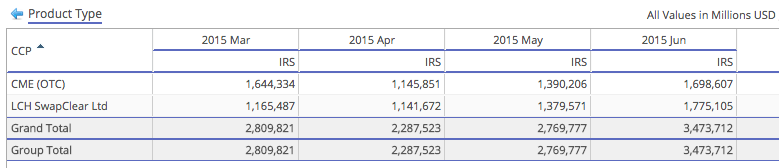
Showing the same picture as last time.
It remains neck and neck, with LCH slightly ahead in June at 51% to 49%.
Stay tuned for which way July will go.
By subscribing to our weekly blog email.