Tod wrote about monetizing the CME-LCH basis last week by means of a straight 5 year swap. But is there a simpler way to go about it? We explain convexity trades, look at different pay-offs when funding costs are applied and then find evidence in the SDR data of convexity plays being put on with CME cleared FRAs.
Swaps vs Futures
A USD interest rate swap can be replicated by means of a series of Eurodollar futures contracts. In the early days of swaps markets, the IRS products were priced off the futures curve. As markets evolved, it became common practice to price futures off the swaps curve as their relative liquidity crosses over. Using Clarus tools, we can identify the maturity point at which liquidity crosses over from futures to swaps.
Let’s therefore compare the Average Daily Volumes of Eurodollars versus Swaps at different maturities:
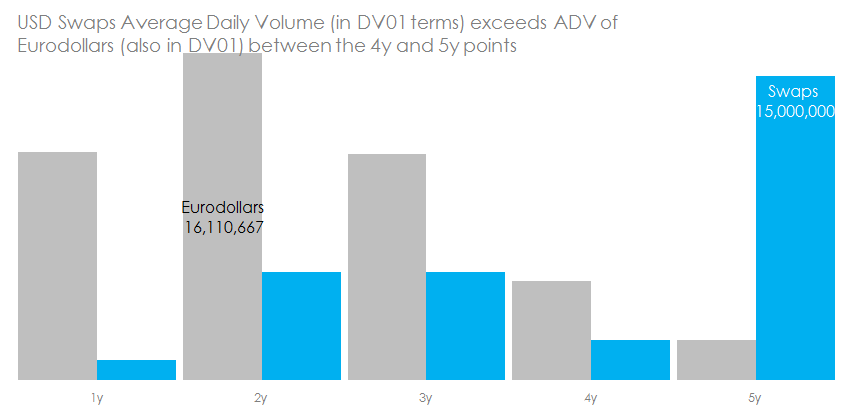
Eurodollar volumes here, SEFView DV01 volumes by tenor in the normal place. 3 day averages taken for 24, 25, 26 June.
The chart shows that swaps up to and including the 3y maturity would be best priced-off a Eurodollar-derived curve than a “pure” IRS curve.
In an ideal World both the IRS and Futures curves would be entirely symbiotic.
But here’s the thing – are we pricing an LCH or a CME-cleared swap off the 3 year Eurodollar strip?
First Principles
I’m not going to pretend to be a convexity expert. So I’ll borrow heavily from Stephen Aikan’s resources here.
As Tod started out doing, we begin with a “frictionless” portfolio. In this idealized scenario, we have zero cost of funding, meaning we don’t care that CCPs demand Initial Margin to cover potential losses and that I fund my VM for free. In this case, we repeat the simple illustration of Aikan’s, whereby the net PnL of a Eurodollar contract position is convex versus the pay-off profile of a FRA:
 Which gives us the nice smiley-face we know and love as the convexity effect:
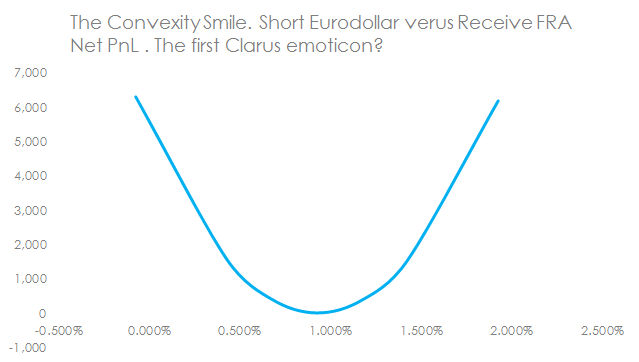
And to make the point abundantly clear – yes, this package would have positive PnL no matter where rates go. But only if we could trade a Eurodollar future at the exact same price as a Libor FRA. And we did not have the pain of funding costs.
On the subject of funding costs, this was much sweeter when FRAs were uncleared. If the short futures position was in the money, the margin earned could be reinvested at a higher rate, with no negative offset on the un-collateralised FRA position. And vice versa at lower rates. When coupled with high volatility environments, this is when convexity adjustments become highly significant.
Overall, our chart means that Eurodollar contracts trade at a higher implied rate than an equivalent FRA. This offsets the positive PnL from the change in DV01 of the FRA relative to the Future. The exact size of this “convexity adjustment” depends upon the expected path of interest rates and hence volatility.
So Eurodollars trade at higher implied rates than a FRA. Remember this for later on.
Using these as my base “numbers”, I can then incrementally add-in the margin calculations as we introduce a true cost of funding. But how do we get those margin calculations? With CHARM of course!
CHARM to Calculate Intrinsic Convexity Costs
If you run a swaps book of any size, you have convexity risk. This is why CHARM allows our users to stress their book in a number of different ways. We use this in-built scenario editor to therefore replicate what happens to the margin on our FRA and Eurodollar package at different market rates.
For the FRA we are using in this example, we can see the LCH IM requirement at a number of different market levels:
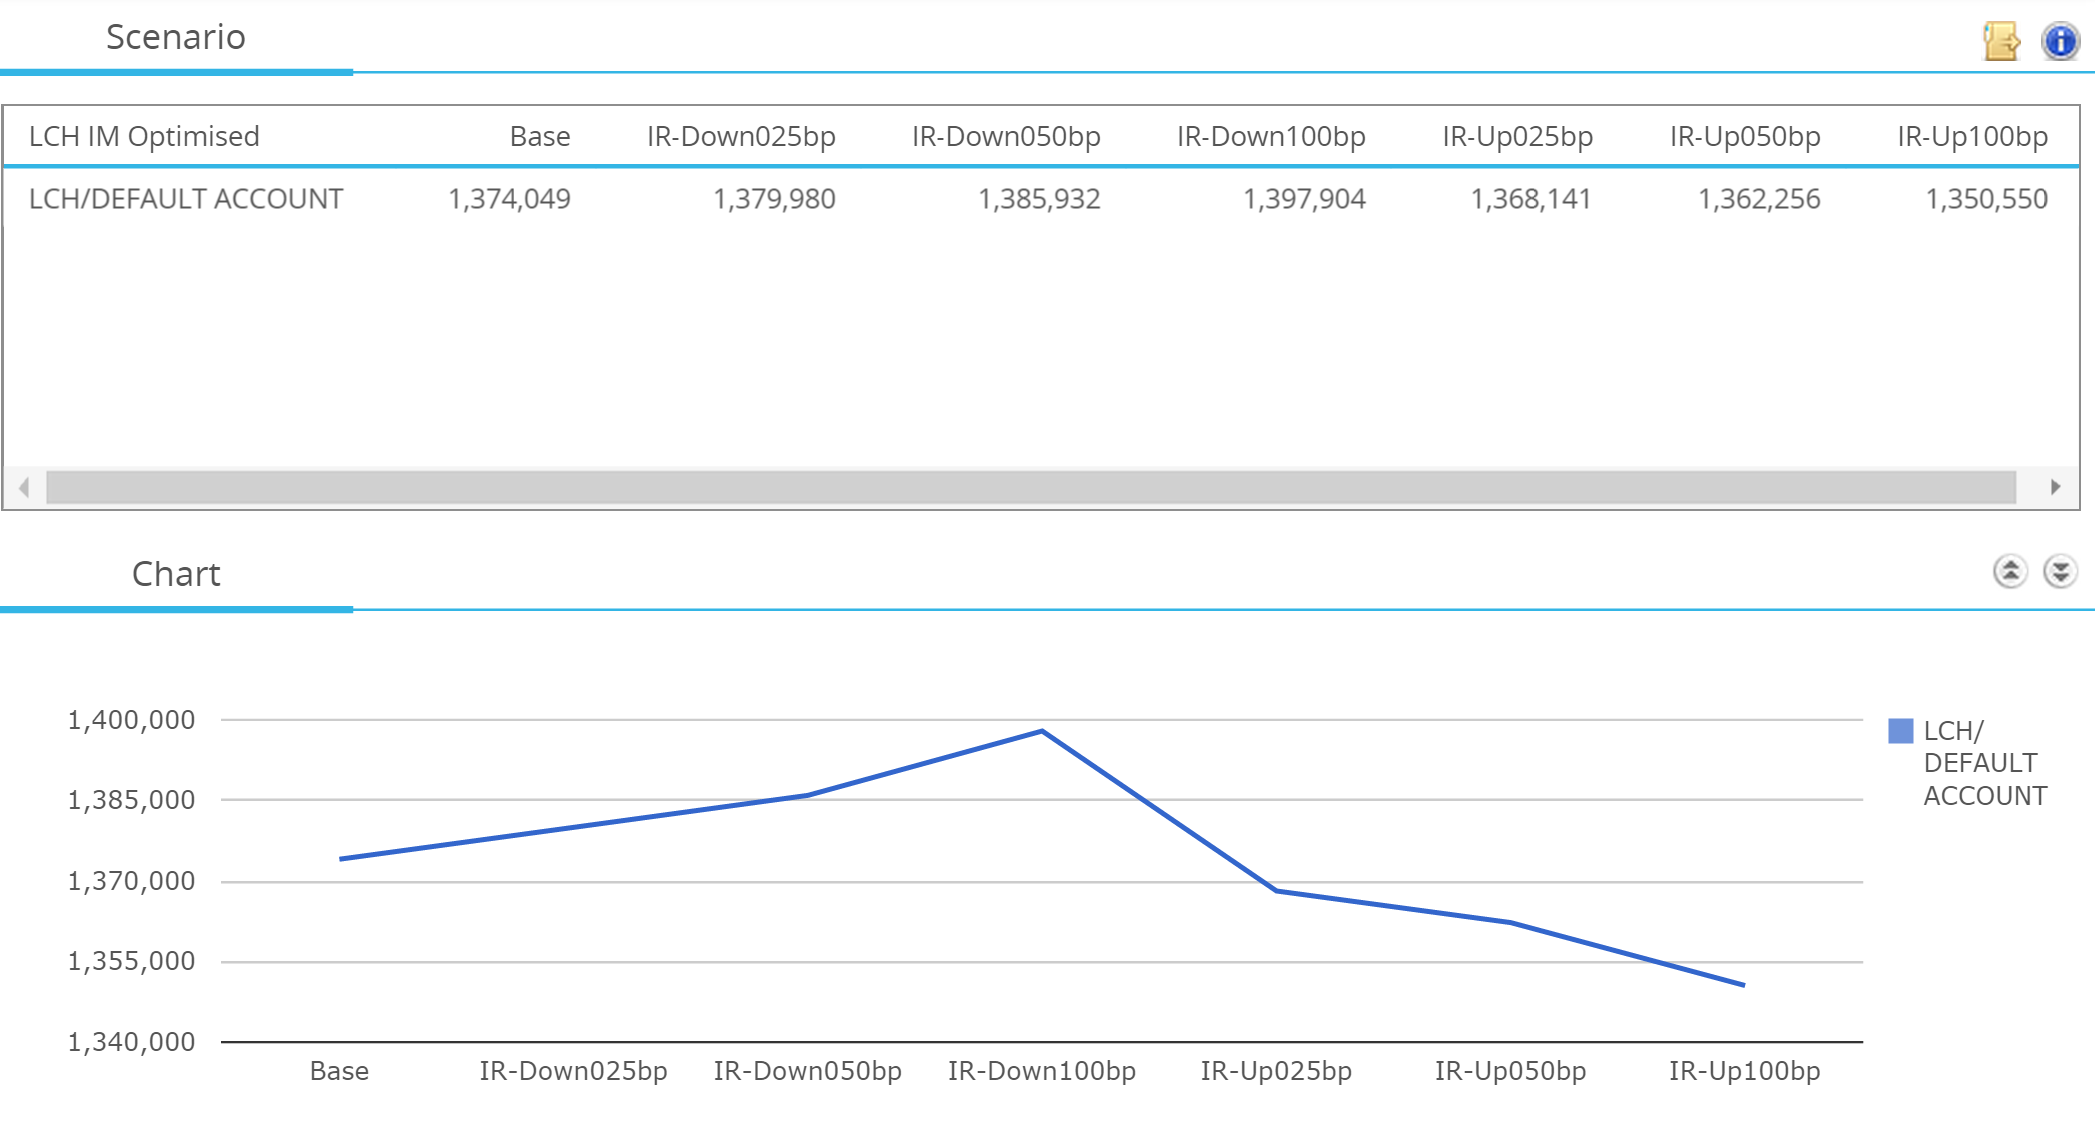
A few points to highlight:
- IM increases from $1.37m to $1.4m as rates go lower. It declines to below $1.355m at higher rates.
- The relationship is not linear
- This is because IM itself is slightly convex – due to the revaluation effect at different market levels.
- The Variation Margin also has to be funded.
We can also use CHARM to check the SPAN margin requirement of a CME Eurodollar, which checks out at $425,000 for 1,000 contracts of EDM6. So we now know the total IM requirements in the case of a Future at CME versus a FRA at LCH.
We can then repeat the exercise for both a CME-cleared FRA not subject to portfolio margining, and finally the CME cleared FRA with portfolio margining applied.
We now have to introduce two aspects of funding costs:
- The Variation Margin. This has to be funded overnight. Let’s say the funding spread is 25bp – i.e. I receive OIS minus 12.5bp on ITM positions; and pay OIS plus 12.5bp on OTM positions.
- The Initial Margin. This is a trickier cost of funds to pin down as it should be term funded for the life of the trade. Let’s just take the 1 year IRS rate as a guide – currently 0.50%.
So let’s continue to assume we could trade a Eurodollar future and a cleared FRA at the exact same price. When we apply these funding costs (assuming a one-time market move) we see a series of pay-offs. These pay-off profiles are dependant upon how the package is traded:
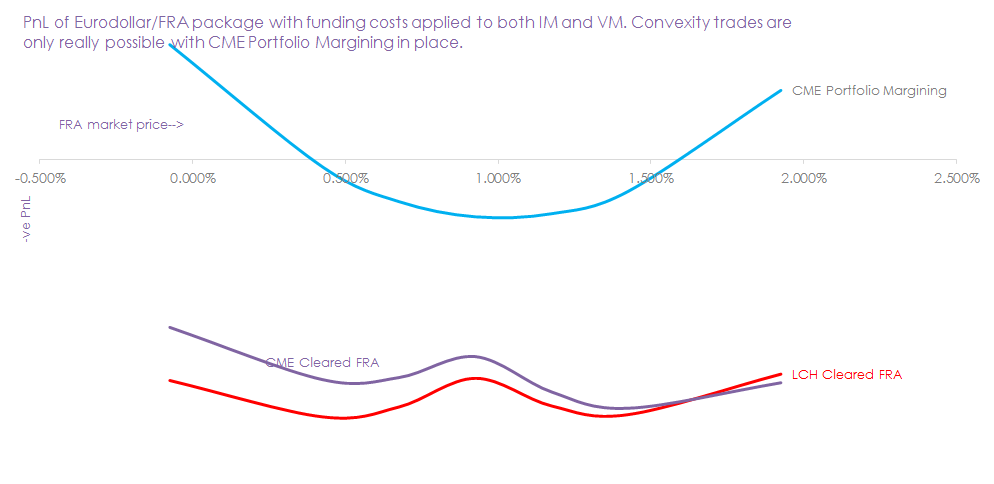
So a few points here:
- The “traditional” convexity style pay-off is only apparent when CME Portfolio Margining is applied.
- The humps that appear on the two lower lines are due to the cost of funding two lots of Variation Margin!
- Due to the term cost of funds (IM) versus variable cost of funds (VM), the pay-offs are also dependant upon outright level of rates.
- Market participants need to know what these charts look like for their own portfolios. CHARM does that for you. So please contact us rather than relying on these stylised examples.
Impacts on the CME-LCH Basis Curve
Hands up, this may seem like a complicated way of saying portfolio margining good, siloed margining bad. Which we all know. But there are a couple of finer points I want to highlight:
- It is only possible to trade convexity between CME Eurodollars and FRAs if you clear the FRA at CME and have CME Portfolio Margining in place.
- Going back to my first chart, this therefore makes it more difficult to transfer liquidity from the more liquid Eurodollar strip in the 2y and 3y area of the curve into LCH cleared swaps.
- What does this mean for short-dated CME-LCH basis spreads? Does this explain the 4 year bump we noticed in the term-structure of the basis curve? And as Tod asked, can I arbitrage the Eurodollar-CME Swap-LCH Swap-Convexity box and still have enough money leftover to rent a garage to run a hedge fund?
- Is now the time to buy convexity, given CME swaps trade at higher fixed rates than LCH?
Fortunately, it’s not only me
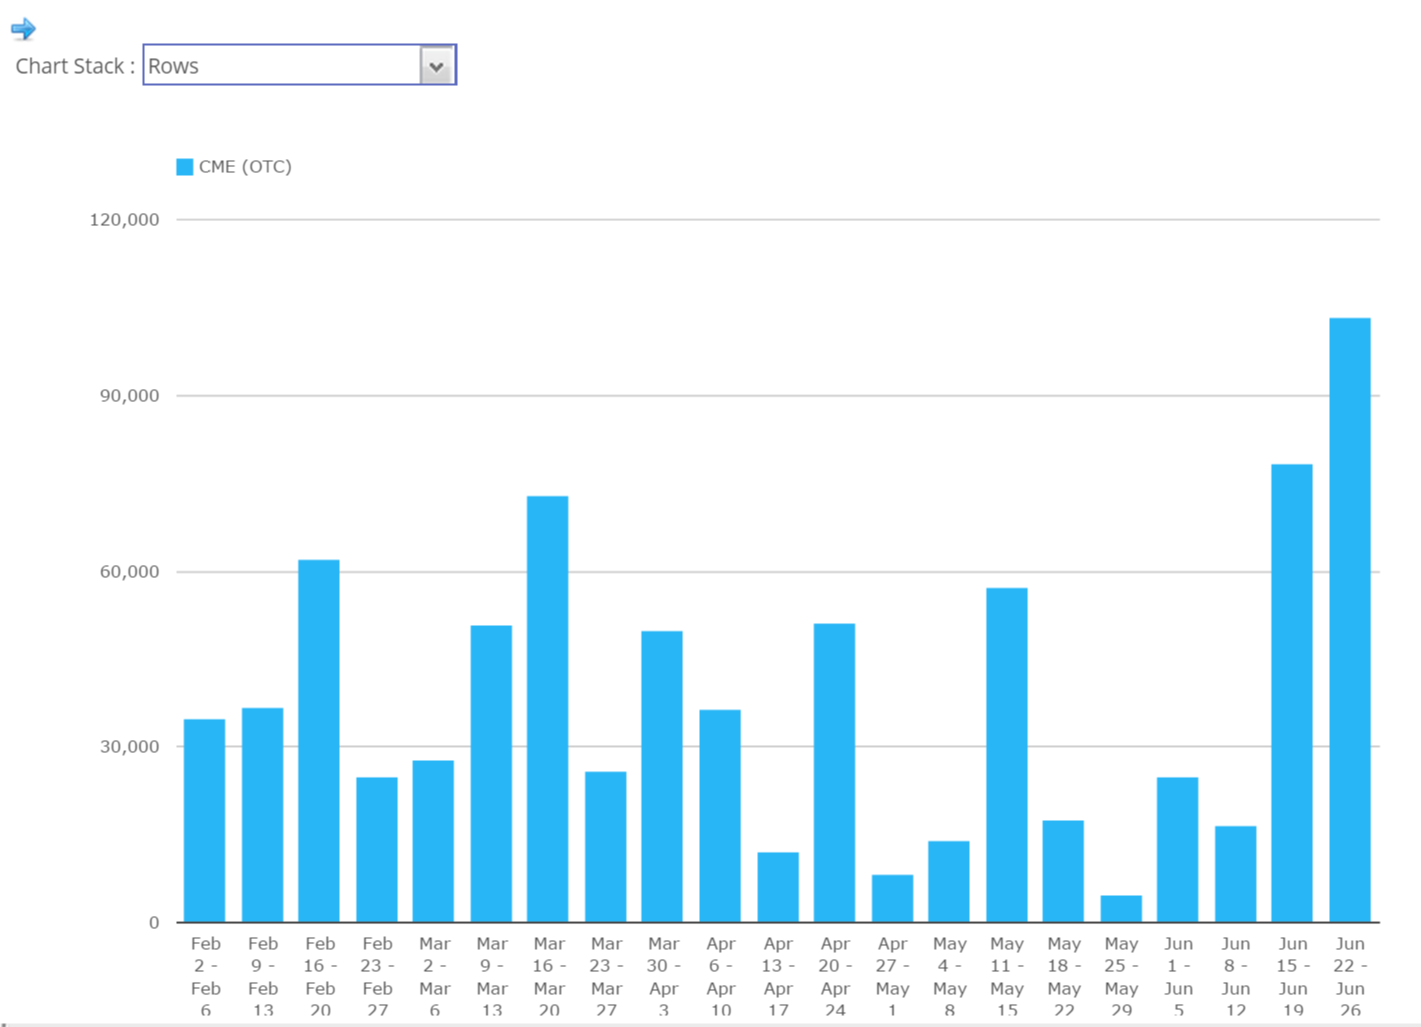
On that last point, I went looking for any signs of convexity trades in the data. CME had their biggest ever week in USD FRAs last week – and this was no IMM roll:
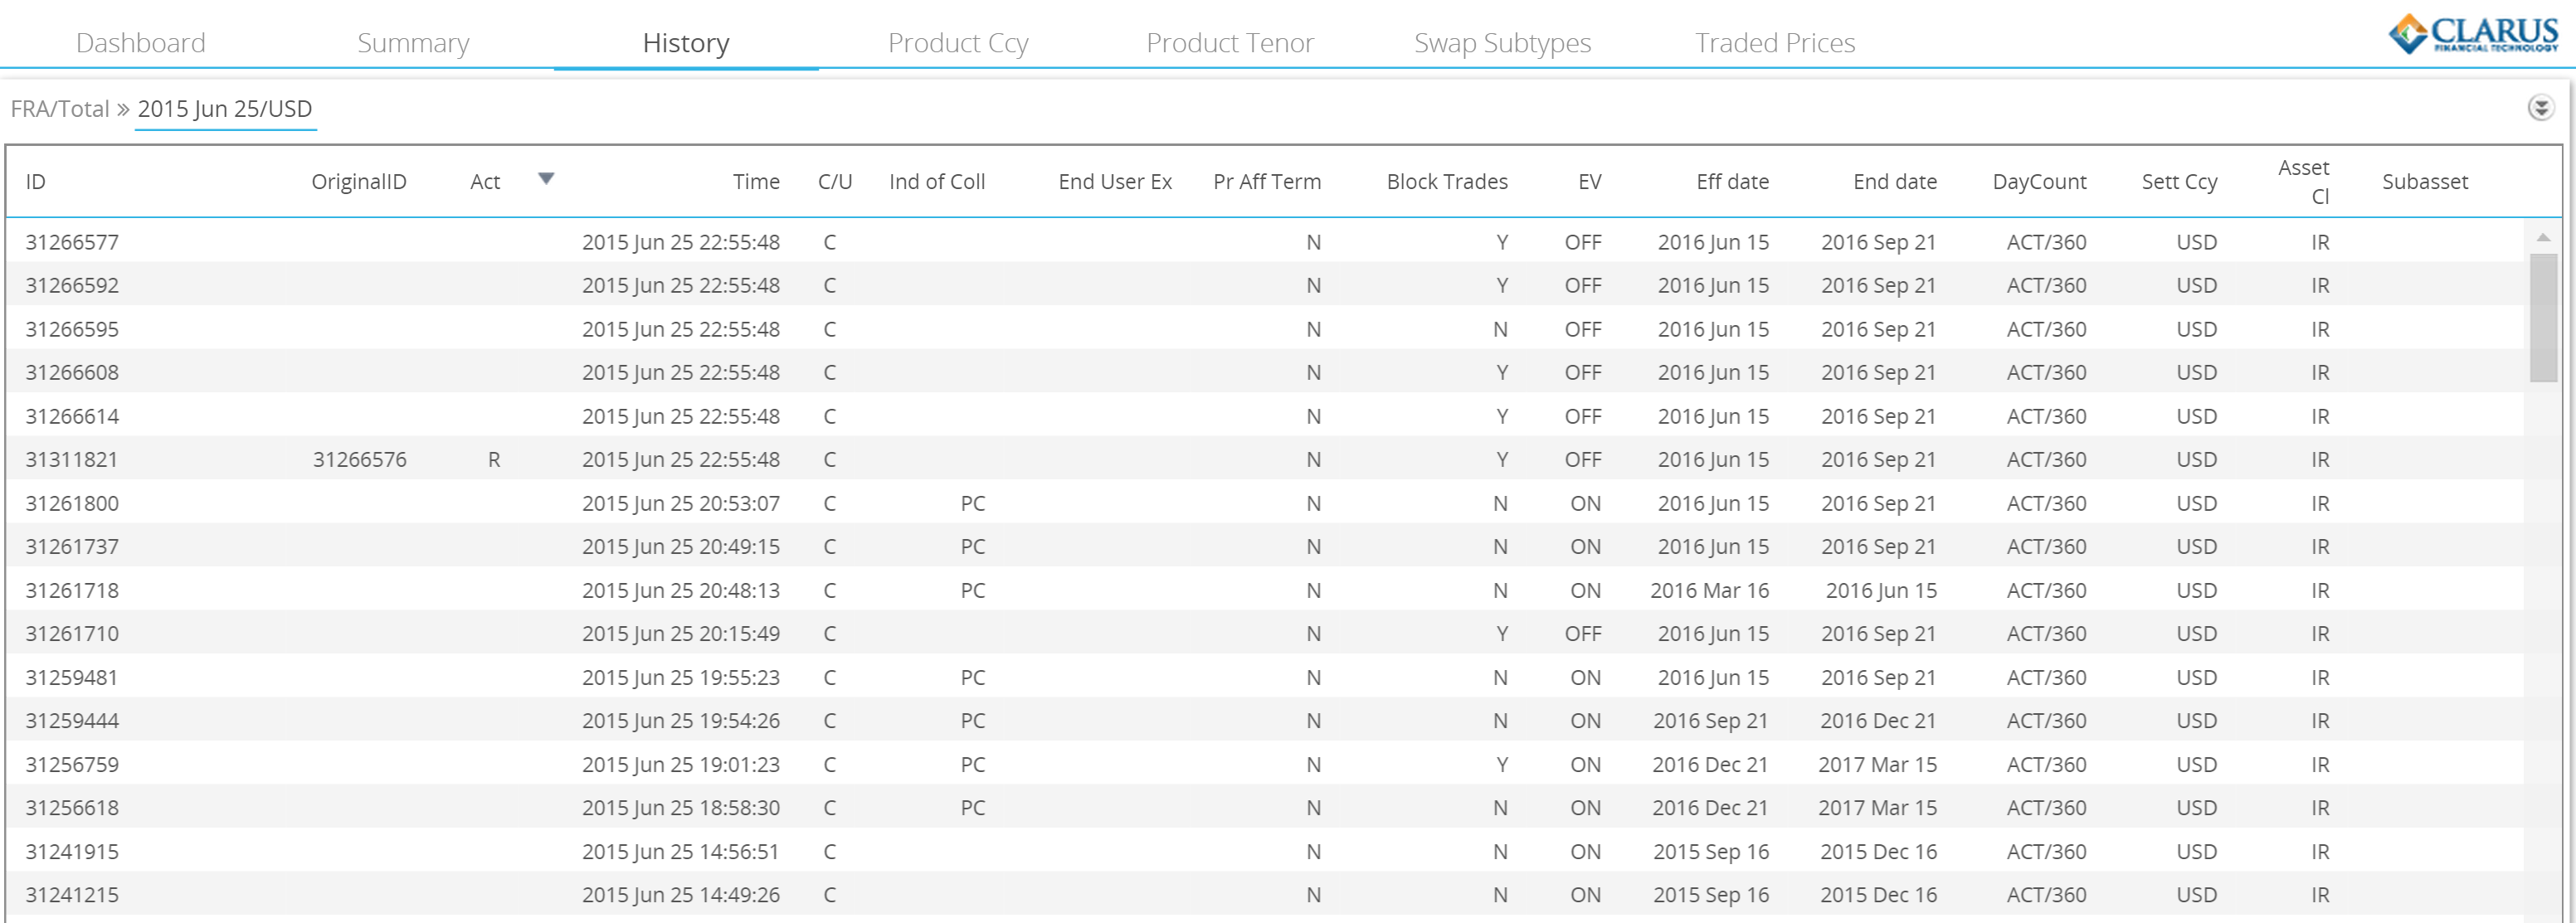
I then drilled down into the daily view and subsequently found these trades in SDRView (it’s easy to find them as they were transacted outside of a Reset/tpMatch run). What we see are a number of IMM dated FRAs. Actually, EDM6 in nearly $40bn traded on one day, and at a variety of strikes.
Could this be a convexity play? On the same day, there was also a healthy jump in Open Interest for the Jun 16 Eurodollar contract. So maybe someone is putting their money where my mouth is……?