Clearing Houses 4Q 2018 CPMI-IOSCO Quantitative Disclosures are now available, so lets look at what the data shows, similar to my CCP Disclosures 3Q 2018 article.
Summary:
- IM for CDS Clearing shows the highest growth, up 27% YoY
- IM for IRS and ETD both with decent growth, 9% and 13% YoY
- Most clearing services with higher IM, a few with lower
- A more risk-on world or more participants or more volatility?
- We now have CC&G disclosures, which is sizeable in Bonds
- Credit Risk disclosures vary significantly between CCPs
- Some surprisingly high actual credit exposure amounts
Background
Under the voluntary CPMI-IOSCO Public Quantitative Disclosures, CCPs publish over two hundred quantitative data fields covering margin, default resources, credit risk, collateral, liquidity risk, back-testing and more.
CCPView has more than 3 years of these quarterly disclosures for thirty-one Clearing Houses, each with multiple Clearing Services, covering the period from 30 Sep 2015 to 31 Dec 2018. This disclosure data provides insights into trends over time at one CCP and comparisons between CCPs.
Initial Margin for IRS
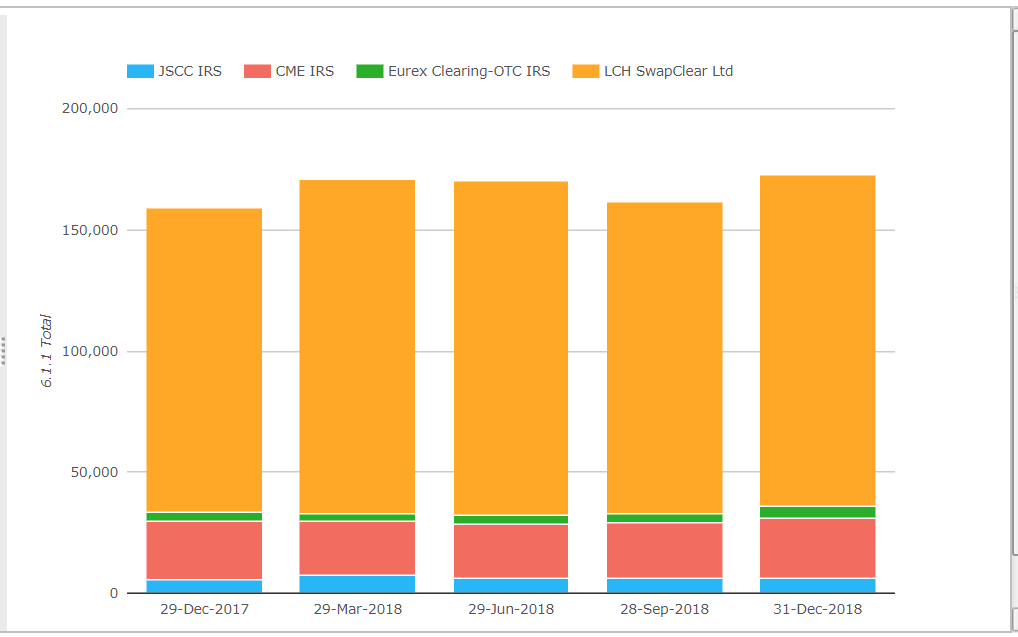
- Total IM for these four CCPs was $173 billion on 31-Dec-2018, up $14 billion or 9% from a year earlier (YoY).
- LCH SwapClear the largest with $137 billion of Initial margin, up $8 billion or 6% from the prior quarter (QoQ) and up $12 billion or 9% YoY.
- CME IRS next with $24.7 billion, up $1.5 billion or 6.5% QoQ and up $600 million or 2.5% YoY.
- JSCC IRS with $6.3 billion, up $300 million or 5.4% QoQ and up $500 million or 8.6% YoY
- Eurex OTC IRS with $5 billion, up $1.5 billion or 42% QoQ and up $1.25 billion or 34% YoY.
LCH SwapClear with the largest absolute increase in IM over the year, Eurex with the largest percentage increase and CME and JSCC are also up.
Initial Margin for CDS
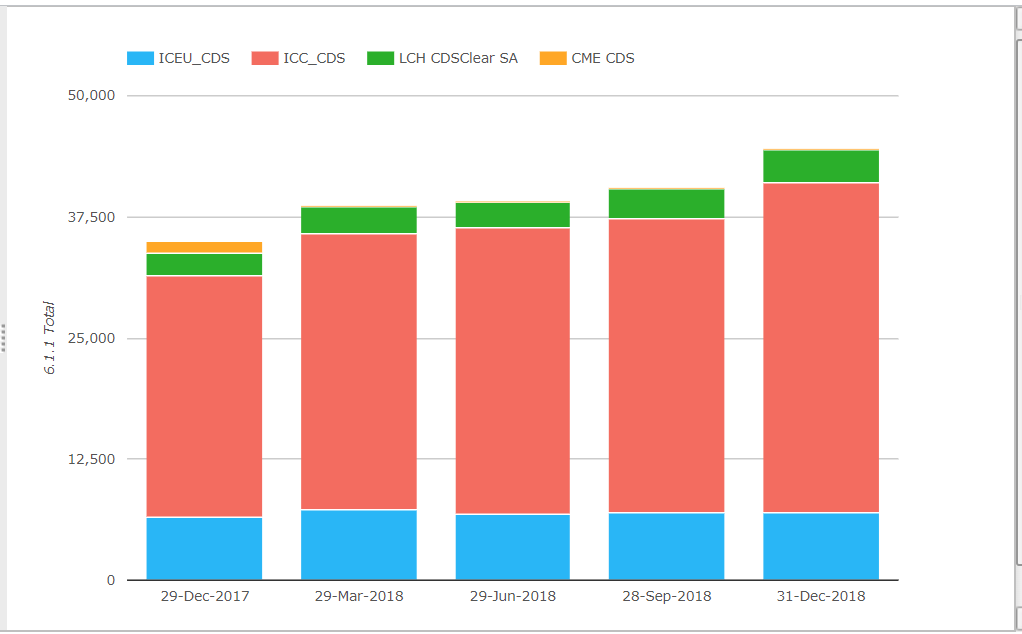
- Total IM for these CCPs was $44 billion on 31-Dec-2018, up $9 billion or 27% from a year earlier
- ICE Credit Clear by far the largest at $34 billion, up $3.8 billion or 12.5% QoQ and up $9 billion or 37% YoY.
- ICE Europe Credit next with $6.9 billion, flat QoQ and up $500 million or 7.4% YoY.
- LCH CDSClear with $3.3 billion, up $240 million or 8% QoQ and up $870 million or 36% YoY.
CDS with a higher YOY growth rate than IRS, with ICE Credit Clear and LCH CDSClear both strong.
Initial Margin for ETD
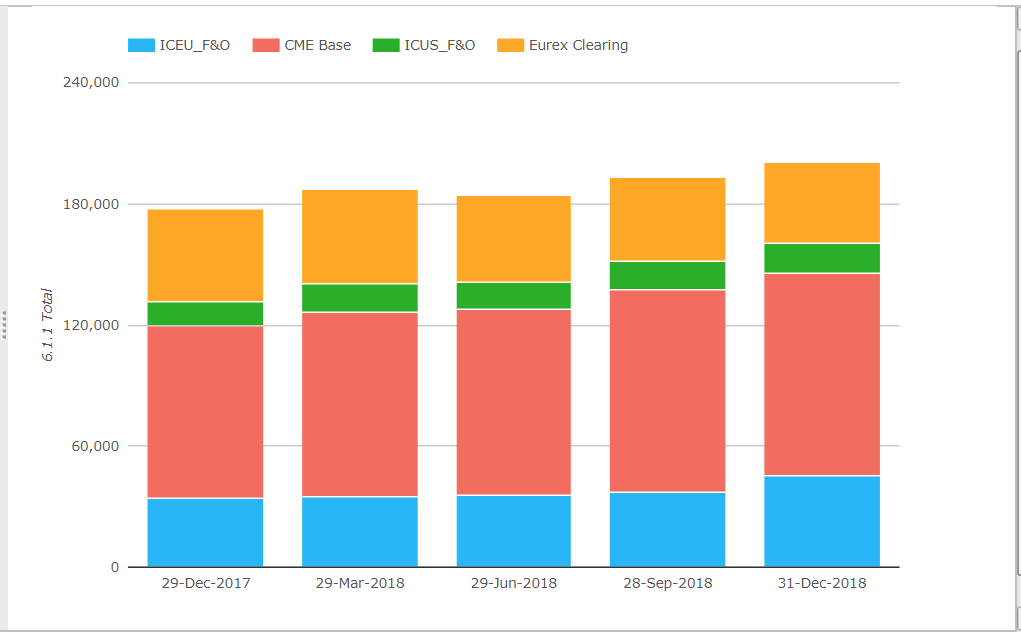
- Total IM for these CCPs was $200 billion on 31-Dec-2018, up $23 billion or 13% from a year earlier
- CME Base is the largest with $100.8 billion, up $1 billion or 1% QoQ and up $15.7 billion or 18.5% YOY.
- ICE Europe F&O with $45 billion, up $7.7 billion or 20.6% QoQ and up $10.8 billion or 31.4% YOY.
- Eurex Clearing with $40 billion, down $1.5 billion or 3.6% QoQ and down $5.7 billion or 12.5% YOY.
- ICE US F&O with $14.7 billion, up $500 million or 3.4% QoQ and up $2.3 billion or 18.8% YOY.
CME and ICE with strong growth rates over the year, with Eurex down over the same period.
Other Disclosures of Interest
There are lots of disclosures for other clearing houses and other measures such as margin, default fund, credit risk, liquidity, margin models, back-testing and more; today I will just highlight a few of these:
- CC&G Bonds, the LSEG Italian-based CCP, which covers BrokerTec and Hi-MTF had Initial Margin on 31-Dec-2018 of $13 billion, up $2.3 billion or 22% QoQ and up $4.2 billion or 48% YOY.
- So similar in size to DTCC Government Securities Division (GSD) which had $15 billion of IM required at 31-Dec-2018
- Options Clearing Corporation (OCC) in the US, had Initial Margin on 31-Dec-2018 of $55.7 billion, down $10 billion or 15% YOY.
- OCC had a maximum aggregate initial margin call on any business day over the quarter of $11.35 billion, much higher than the prior two quarters ($2.5b and $5b) but less than 1Q 2018 with $17 billion
- As a comparison ICE Europe F&O with a ballpark similar IM ($45b to $55b) had a maximum aggregate initial margin call on any business day over the quarter of $3.2 billion and a maximum total variation margin paid to the CCP on any given business day of $3.3 billion
- Disclosure 4.4.4 reports the number of business days on which the estimated largest aggregate stress loss (in excess of initial margin) that would be caused by the loss of any single participant in extreme but plausible market conditions would have exceeded actual pre-funded default resources
- Of the more than a hundred clearing services of the thiryy-one clearing houses we cover, very few reported a non-zero value. The ones that did were CCIL Rupee Derivatives (MIFOR) with seven, CICIL Rupee Derivatives (MIBOR) with two, CC&G IDEX, TFX Daily Futures and TFX F&O each with one. While disclosures 4.4.5 show that on the face of it the amounts in excess are not that significant, members would certainly be more comfortable if there were no such business days
- Disclosure 4.4.6 reports the actual largest credit exposure (in excess of initial margin) to any single participant, both as a mean average or peak day over the previous 12 months. Results vary greatly, as one would expect; ICE Europe F&O showing the highest peak day amount of $1.2 billion, followed by Eurex Clearing with $380 million, DTCC NSCC with $265 million, CC&G with $230 million, Euro CCP with $200 million, CME Base with $138 million, OCC with $114 million, B3 with $90 million and the rest below $50 million, most well below. A few of these look surprisingly high and would deserve greater scrutiny, which I am sure clearing members would have discussed with the clearing house.
- Disclosures 6.5 report results of back-testing of initial margin and the published results vary greatly for the number of times over the past twelve months that margin coverage held against any account fell below the actual mark-to-market exposure of that account. Some clearing services reporting low single digits and some many hundreds! A quick look at the average and peak amount of the uncovered exposures show that these are not material compared to the default resources of the individual clearing services.
More Disclosures
CCPView has disclosures from thirty one Clearing Houses, each with many Clearing Services, so there is a lot more data to look at covering Equities, Bond, Futures, Options and OTC Derivatives.
With over 200 quantitative data fields and quarterly figures from September 2015 to December 2018, that is a lot of data to analyse.
If you are interested in this data please contact us for a CCPView subscription.