Happy New Year to all of our readers! Thank you for your continued support and readership. This first blog of the year marks my 500th blog – it’s nice to start the year with a proper achievement! That is over ten years of blogs – if you want to know what I did before Clarus, I documented my trading strategy in a 10th-anniversary blog last year.
With 500 blogs published, I get to still write about my favourite (and most specialised) topic – cross currency swaps. In 2024:
- More cross currency swaps traded than ever before (+12% year-on-year).
- Trade counts have now grown by at least 10% every year since 2018.
- Over $7Trn of XCCY notional was reported in 2024, with notional volumes growing by 21% on a like-for-like basis since last year.
- But XCCY swaps are (still) getting shorter in some of the major currencies.
- Read on for more…..
SDRView Volumes
SDRView shows the monthly volumes transacted in Cross Currency Basis swaps. These are vanilla, interbank mark-to-market cross currency swaps.
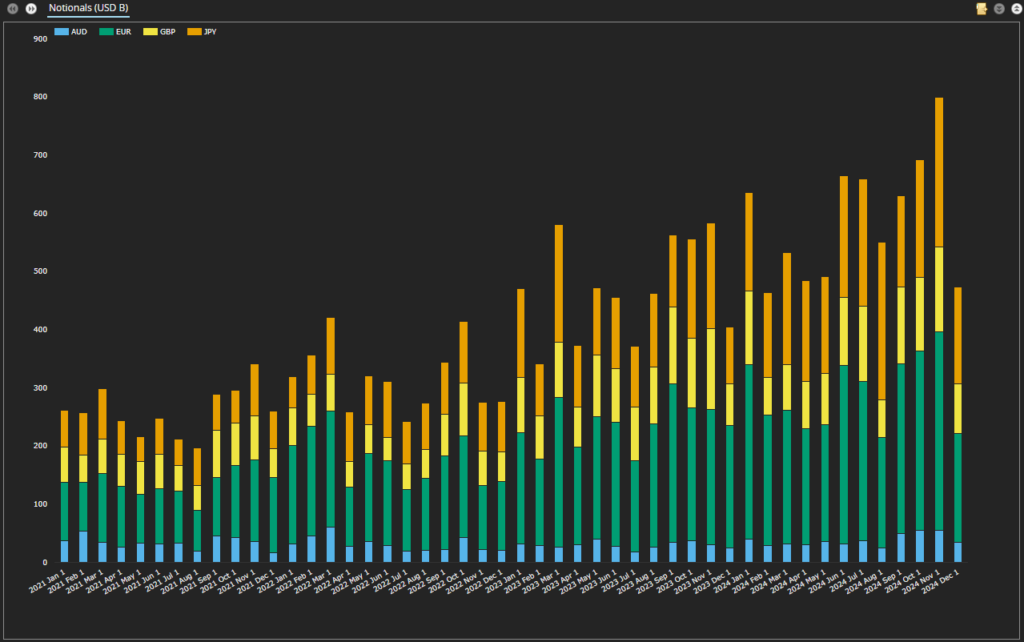
Showing;
- Monthly volumes in XCCY Basis swaps for the past four years. Please read my previous Cross Currency blogs to see the big stories for 2021, 2022 & 2023.
- 2024 saw volume records across three of the big four currency pairs (EURUSD, JPYUSD and AUDUSD).
- Over $1.6Trn was transacted in every quarter of 2024, with nearly $2Trn reported in Q4 once the block thresholds were moved higher.
- 2024 was another great year for volumes, showing:
- EURUSD: 18% volume growth year-on-year.
- JPYUSD: 43% growth, another huge increase even on last year’s record numbers.
- GBPUSD & AUDUSD: volumes were almost identical year-on-year in GBPUSD, whilst AUDUSD registered 17% growth.
These figures look at average quarterly volumes for the whole of 2023 vs the first three quarters of 2024. As of October, block sizes increased, confusing the picture somewhat.
SDRView Trade Counts
Due to the change in block sizes, I ran the activity data on trade count as well:
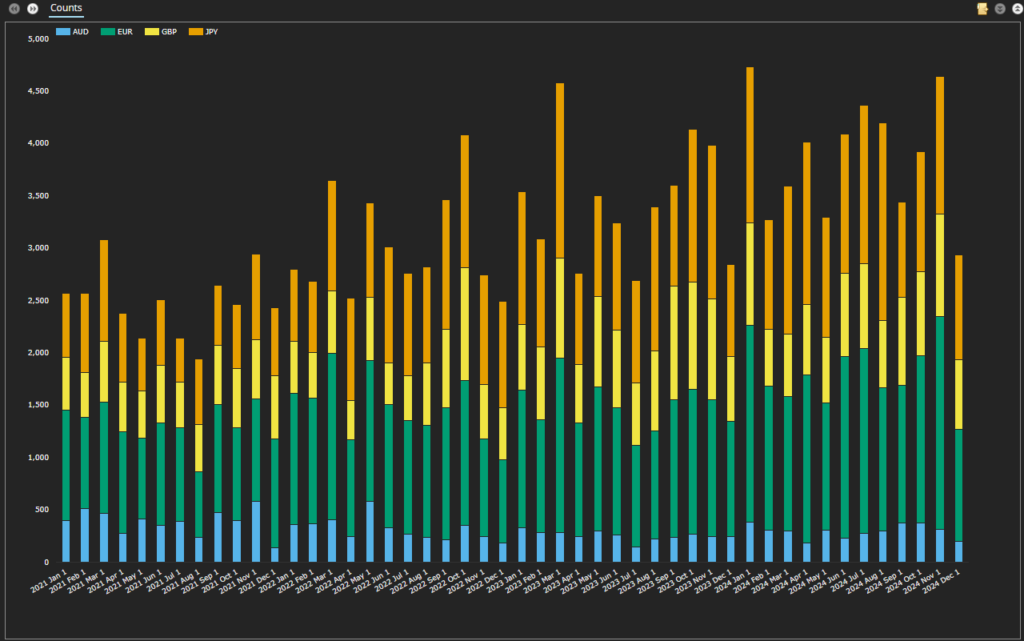
Showing;
- Growth: There were 12% more trades in 2024 than in 2023.
- This was dragged lower by a reduction in GBPUSD trading:
- EURUSD: There were 23% more trades in EURUSD year-on-year, a larger increase than for the amount of notional traded.
- JPYUSD: There were only 13% more trades this year than in 2023, despite the huge increase in notional amounts. I anticipate therefore that the average maturity has declined (see analysis below).
- GBPUSD: There were 5% fewer trades in GBPUSD than last year. That is one to puzzle…
- AUDUSD: 16% more trades, consistent with the increase in notional amounts.
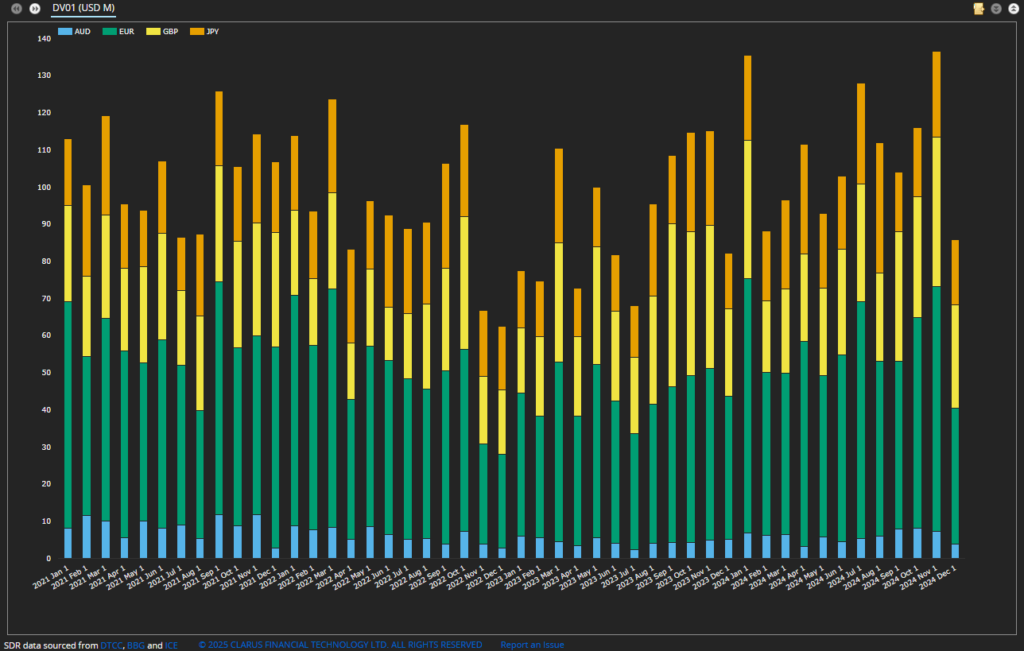
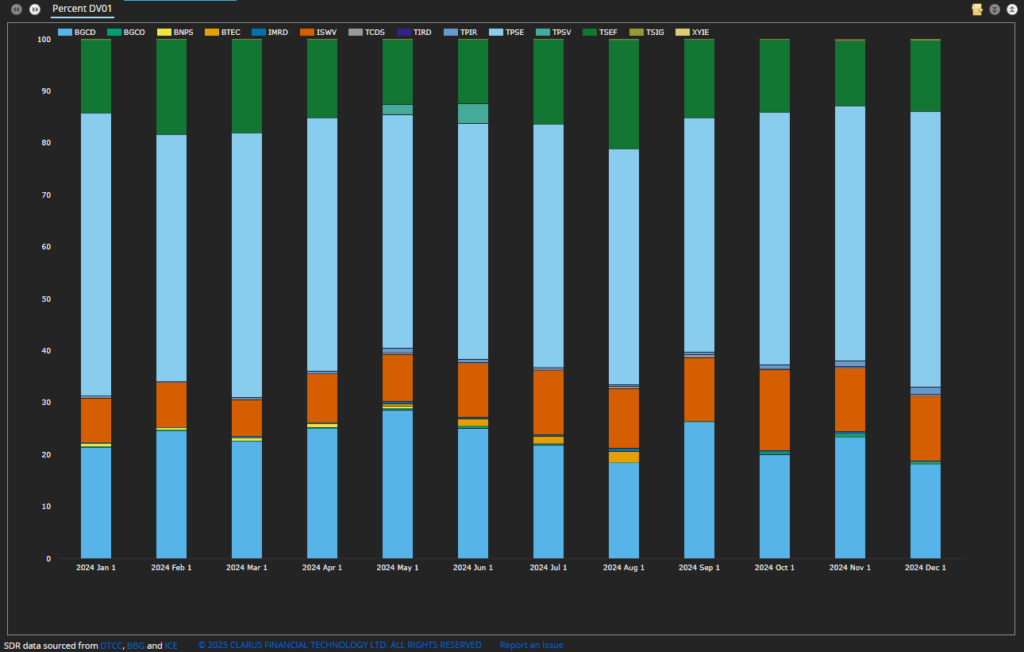
DV01 and Average Maturity Analysis
All of this brings us to DV01. The chart doesn’t look that different to the notional chart, but I will call out the much smaller contribution of USDJPY when measured in DV01 terms:
Finally, I ran the analysis on average maturity, weighted by DV01.
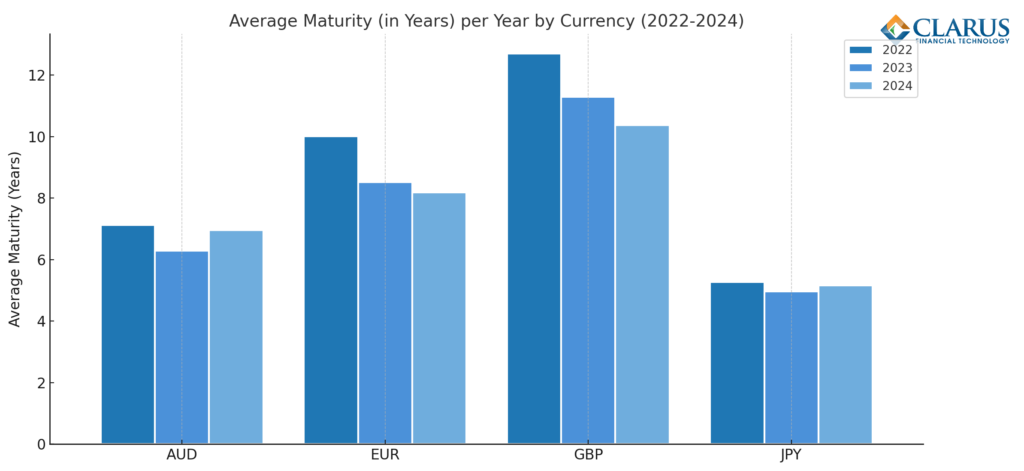
There is quite a lot to unpick from that chart. The data is for the whole of 2024, but the impact of the block rules on the average maturities is minimal (trust me, I checked!).
- Variations across different currencies: Average maturities range from 5 years (JPYUSD) to over 10 years (GBPUSD).
- Average maturities are falling: in both EURUSD and GBPUSD.
- JPYUSD: Despite seeing lots more notional in 2024, but “only” 13% more trades, average maturities have not fallen. I find this really surprising.
- DV01: EURUSD has the largest contribution to DV01. Will this last as the EUR market moves increasingly toward the short-end? The average maturity is down from 10 years to 8 years since 2022.
I came here to test a simple hypothesis: trades are getting shorter. That would add weight to a common narrative: “lots more notional is trading, but not that many more trades are happening“. This holds true for both EURUSD & GBPUSD, but not for other currency pairs.
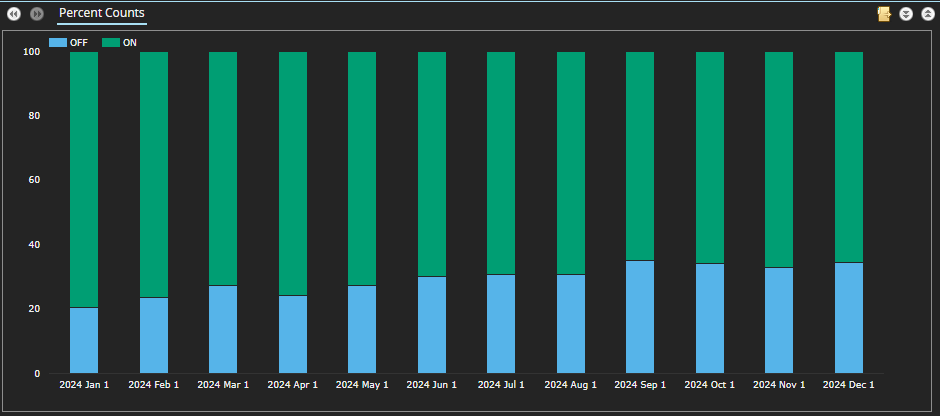
SEF Trading
SEF Trading in vanilla XCCY basis took a real hit in 2024. The proportion of trades reported as SEF executed dropped consistently throughout the year. It reduced from 79% in January to just 65%:
This represents a loss of transparency in the market. For example, you can see the declining volumes executed on-SEF via SEFView:
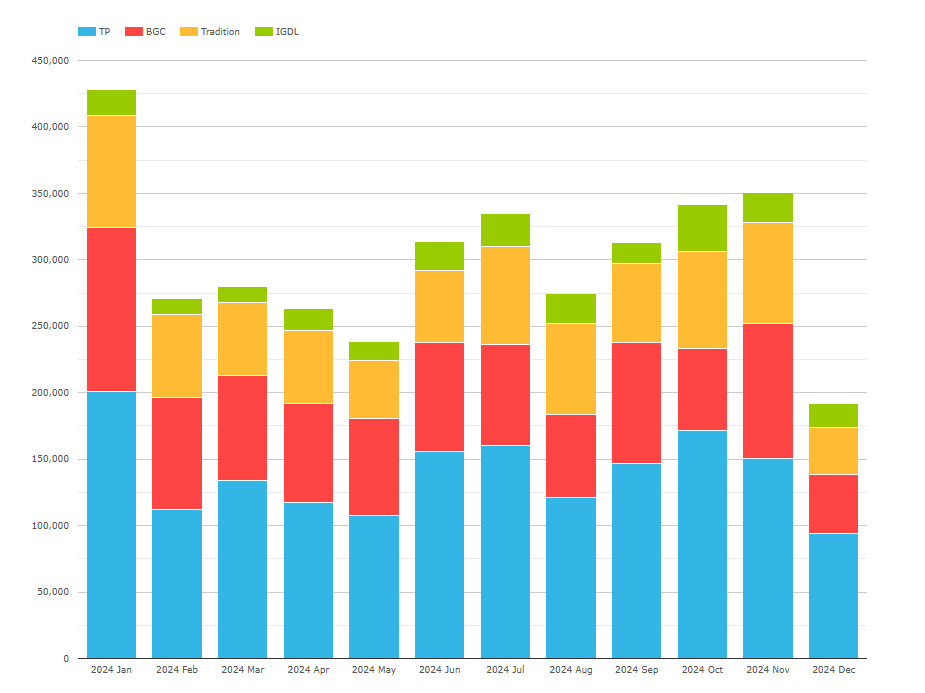
And looking at the SEFs reporting XCCY swaps to SDRs:
Showing;
- Only four SEFs report significant volumes. The MIC codes translate to:
- TPSE, IMRD, TPIR: Tulletts SEF, TP ICAP UK MTF and TP ICAP Europe MTF.
- TSEF, TCDS: Tradition SEF and Trads OTF.
- ISWV: ICAP Voice
- BGCD, BGCO: BGC
- No D2C SEFs: In seemingly every “What’s New” piece I have written this year, I have noted the growth of Tradeweb-executed trades in currencies from MXN to INR and GBP. Tradeweb remain notable by their absence.
Recall that Cross Currency Swaps remain uncleared. Maybe the execution protocol of checking CSAs and hence discount currency means that SEF execution is poorly suited for end-users? Feel free to discuss in the comments below.
In Summary
Record Growth in Volumes: Cross currency swaps saw a 12% increase in trade counts and a 21% rise in notional volumes, reaching over $7 trillion in 2024, with record activity in EURUSD, JPYUSD, and AUDUSD.
Diverging Trends in Trade Counts: EURUSD trades grew by 23%, AUDUSD by 16%, while GBPUSD trades declined by 5%. JPYUSD saw modest trade growth despite a sharp increase in notional volumes.
Average Maturities Declining: Average maturities decreased in EURUSD (from 10 to 8 years) and GBPUSD, while JPYUSD maintained stability at 5 years, indicating a shift toward shorter-term trades in some of the major currencies.
Reduced SEF Market Transparency: On-SEF execution dropped from 79% to 65% during 2024, raising concerns over declining market transparency and the limited participation of dealer-to-customer (D2C) SEFs.