- INR Swaps are the 16th largest swap market in 2024.
- Over $3Trn equivalent has already been cleared in INR swaps in 2024, a new record.
- The onshore cleared market at CCIL accounts for about 30% of volumes. 70% of volumes are traded as non-deliverable, USD settled swaps at LCH SwapClear (the offshore market).
- The SEF market is still concentrated at two SEFs – Tradeweb for D2C flow and BGC for dealers.
This will be my last blog of the year, and the last one before we get into some retrospectives about 2024. It is therefore a good opportunity to add to the “What’s New” series, and look at INR swaps.
Unlike MXN, which had a near five-year gap between blogs (!), I wrote about INR swaps in November 2023. How have INR markets developed in the past 12 months? Let’s take a look.
Where do INR swaps rank on the global market?
CCPView allows us to compare the relative size of INR swap markets to other currencies. Taking out the “G6” – USD, EUR, GBP, AUD, CAD and JPY – we see the below:

Showing;
- Volumes in Cleared OTC Interest Rate Derivatives from CCPView.
- The chart excludes the top six currencies by volumes (USD, EUR, GBP, JPY, AUD and CAD). These six currencies represented over 95% of total cleared volumes (back in 2019, see Four Trends in Swaps Data).
- There are 21 currencies in total (27 including the largest 6). Interesting that no new currencies were added in the last 12 months. Is everything “clearable” in Rates now cleared?
- For the currencies shown, 2024 volumes were:
- There is then a gap to CZK at 6.1% of volumes (as there was in 2023).
- DKK is still the smallest cleared swaps market (as it was in 2023), with just 0.3% of volumes.
- INR swaps, the subject of today’s blog, sit at number 10 of the “non major” currencies, representing 4.2% of volumes outside of G6 swaps.
- INR swaps see similar volumes to NOK, CLP and KRW swaps for reference.
Clearing is not always a monopoly
INR is one of seven currencies that see clearing split across more than one CCP. All of AUD, BRL, CNY, EUR, INR, JPY and MXN have a “competitive” clearing landscape, with more than 5% of volumes cleared away from the major CCP.
INR clearing volumes highlight an onshore/offshore market dynamic:
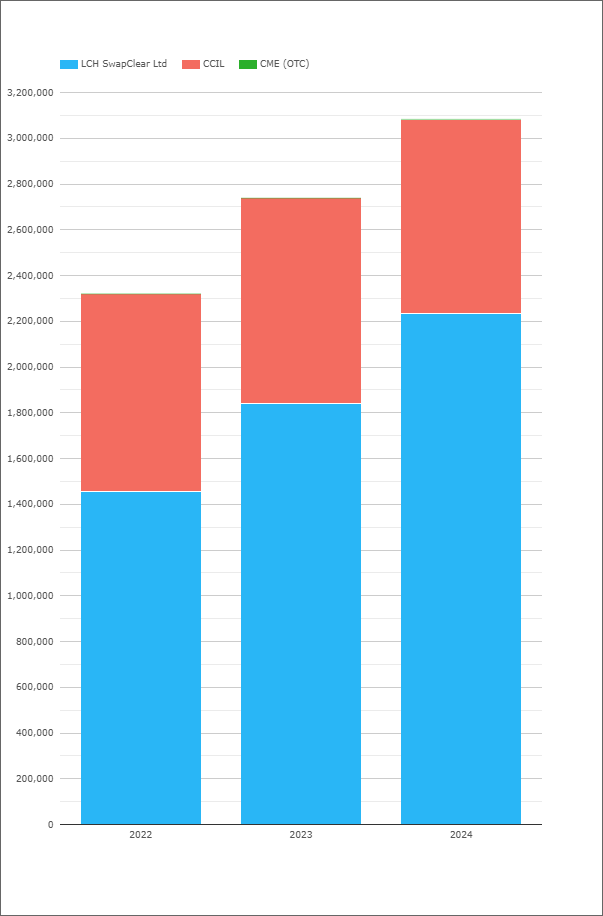
Showing;
- 2024 has been a record year! Volumes to the end of November have already surpassed 2023 full year volumes.
- LCH SwapClear with 73% of volumes, up from 67% in 2023.
- CCIL has a market share of about 28%.
- CME also offers clearing of INR swaps, but the volumes do not really register.
- Volumes continue to rip higher, growing 12-18% year on year for the past three years.
For readers who may not be aware, CCIL is the Clearing Corporation of India.
Clearing Appetite
Taking US SDRs data as a representative slice of the market, Clearing is becoming more and more prevalent in the market:
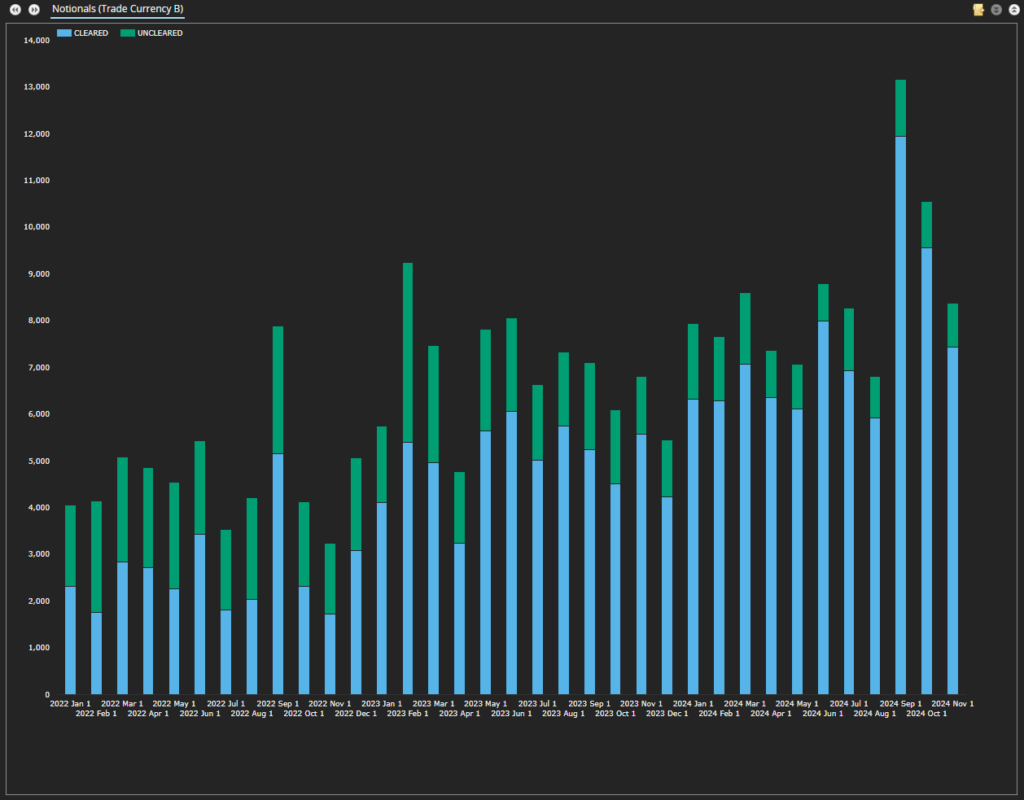
This is a cool chart!
- 90% of INR swap volumes reported to US SDRs have been cleared recently – a new all time record!
- Clearing rates have been consistently rising, from around 50% in early 2022.
OIS remain much larger than IRS
There are reported volumes versus both IRS and OIS products, and what looks like some type of basis market developing:
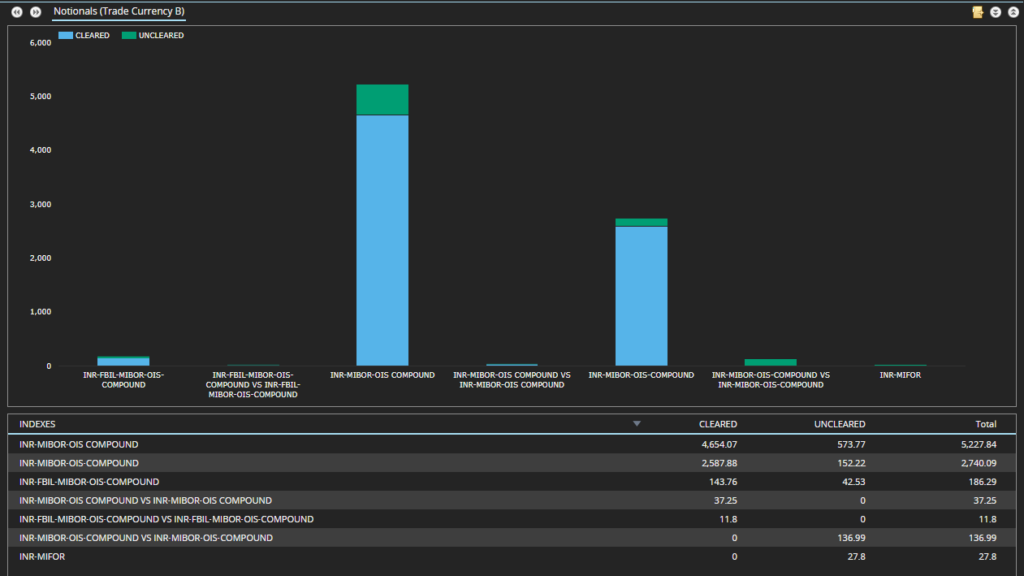
Showing;
- A more “colourful” situation than 2023 – we have some basis trades in the mix now.
- I need some more education on the basis trades. Some of the trades appear to be swapping a 6M compounded daily rate for a 6M OIS rate by the same name. Is there a term market?
- Most volumes are cleared OIS vs “INR MIBOR-OIS-COMPOUND”. I think we can do some work at Clarus (as we did for SOFR) to clean up and standardise the index names.
- Everything versus MIFOR is still uncleared, as we saw last year.
The data initially threw me a little. I thought that 2024 had seen the development of a cleared IRS market in INR. 23% of cleared volumes in November 2024 have been reported as an “IRS”. However, a closer look at the tickets show that only a handful (13 trades!) have been booked versus MIFOR. Everything else is against the OIS index (“INR-MIBOR-OIS-COMPOUND”).
Onshore or Offshore?
SDR data includes a “Settlement Currency” column. This might seem redundant in a lot of cases (for example, it is typically left blank for a vanilla USD SOFR OIS). But for markets that trade both onshore and offshore, it is very handy to see when a swap is settled in INR or when it is settled in USD.
LCH SwapClear offer a non-deliverable OIS in INR, referencing MIBOR OIS – meaning that it is settled in USD. The CCIL volumes are settled via RBI accounts, therefore are settled in INR.
We see the following split by settlement currency for 2024 volumes reported to SDRs:
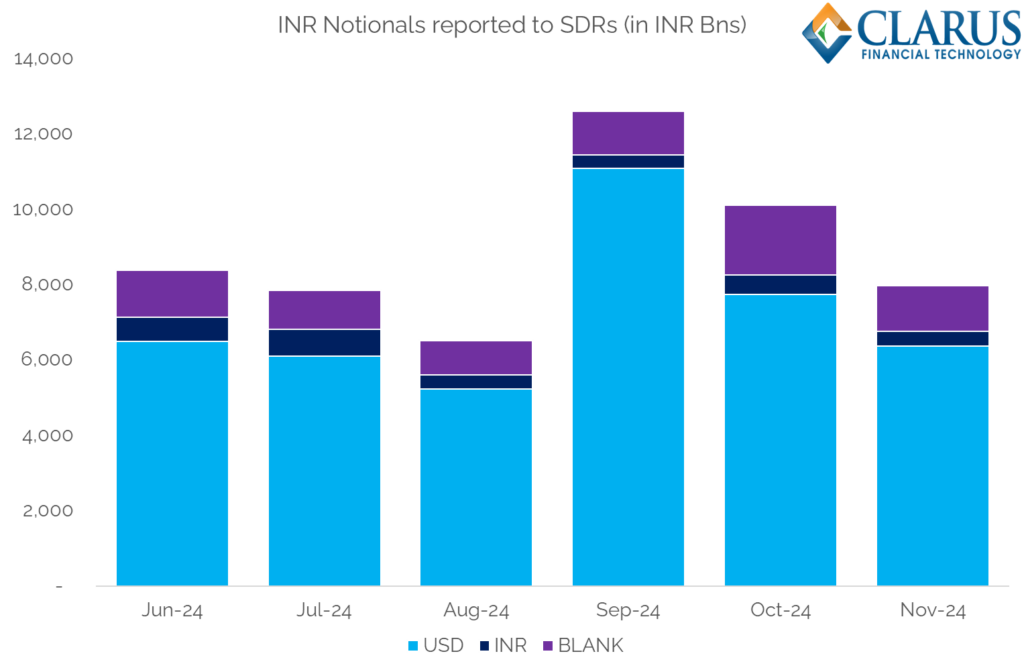
The chart shows that a steady ~80% of notional reported is a “non-deliverable” swap and hence settled in USD. Even if we combine the INR volumes with “blanks” (i.e. the data field is unpopulated), it would only make up 20% of the overall market. It is notable how stable the split is month-on-month, varying only between 77-80% in the past six months.
SEF Trading
Finally, we look at how much is traded on-SEF in INR Swaps. From SDRView;

Showing;
- 51% of INR notional was traded on-SEF in 2024 so far (to end of November), up from the 45% reported last year.
- It is pretty constant month on month.
- September 2024 was the largest volume month, and the SEF share dropped slightly to 44%. I don’t think that there is anything in that, it looks more like noise.
Looking at SEFView, we see the following market share for SEFs:
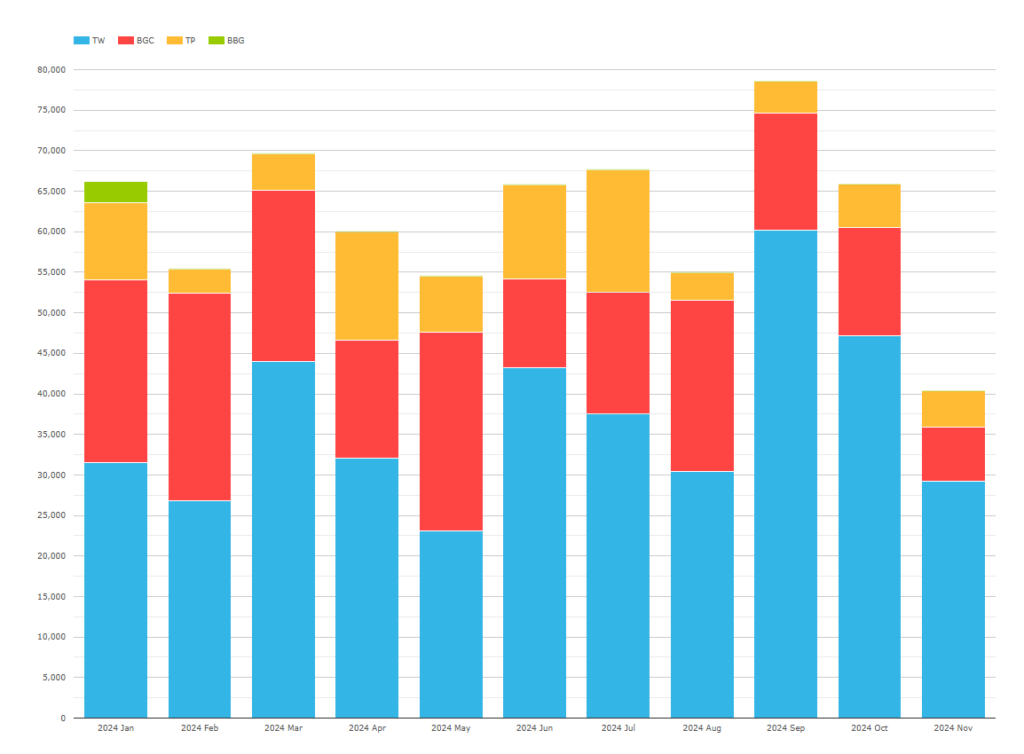
Showing;
- A small market! There are only four SEFs active in INR swaps, and it still looks like Bloomberg might have some bad data from 2023? Let’s go with three active SEFs at the moment.
- Tradeweb undisputed number one for SEFs, consistently recording the largest volumes in INR swaps.
- For the D2D market, BGC are still number one, enjoying a 70% market share in 2024. TP have the remaining 30%, up slightly from 2023.
- Are there any local brokers I wonder? I assume the market is large enough to support a bit more competition here. We did see one trade in the SDR reported by OTCX back in November.
In Summary
- INR swaps trade as both deliverable and non-deliverable OIS.
- Clearing rates are high in INR, with as much as 90% of volume cleared.
- Clearing is split 70/30 between SwapClear (offshore and non-deliverable only) versus onshore at CCIL.
- At least 80% of volumes reported to US SDRs are non-deliverable swaps, settled in USD (and hence most likely traded offshore).
- Tradeweb and BGC have continued as the market leaders in SEF trading for INR.