- USD IRS volumes elevated due to FRA to SPS change
- SOFR Swaps at record highs
- EUR IRS volumes flat, Eurex share also flat
- €STR Swaps a record month
- JPY IRS volumes down, OIS record, JSCC increasing share over LCH
- AUD Swaps up QoQ, down YoY, LCH higher share
- iTraxx Europe, volumes up, ICE Clear Credit share higher
- EUR Single-name, LCH CDSClear now above ICE Clear Europe
- USD Index and single-name volumes over twice those in EUR
- Index Options volume in EUR at LCH CDSClear and USD at ICE Clear Credit
- Cross Currency Swaps at HKEX
- NDFs up QoQ and YoY, with LCH ForexClear dominant
- FX Option volumes down
All the detail and more from CCPView.
USD IRS
USD IRS only, so excluding OIS, Basis, ZC, VNS and FRAs.
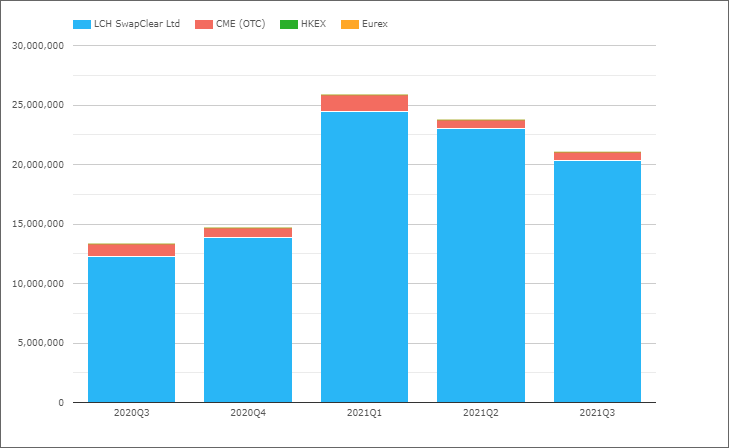
- 3Q 2021 with $21.1 trillion, up 58% from the $13.3 trillion in 3Q 2020 and down 11% from 2Q 2021
- LCH SwapClear with $20.3 trillion, a share of 96.4% in 3Q 2021, same as 2Q 2021, up from 91.8% in 3Q 2020
- CME OTC with $740 billion a share of 3.5%, same as 2Q 2021 but down from 8% in 3Q 2020
- Comparing Client volumes at LCH SwapClear with CME OTC volumes (assuming all CME volume is client), LCH SwapClear with $8.7 trillion and CME OTC with $740 billion, a share of 92% vs 8%
So while volumes are down for the past two quarters, they are still significantly higher than the corresponding quarters in 2020, which on the face of it looks odd, given that new USD Libor swaps are expected to cease trading by the end of this year.
For an explanation, we have to turn to FRA volumes.
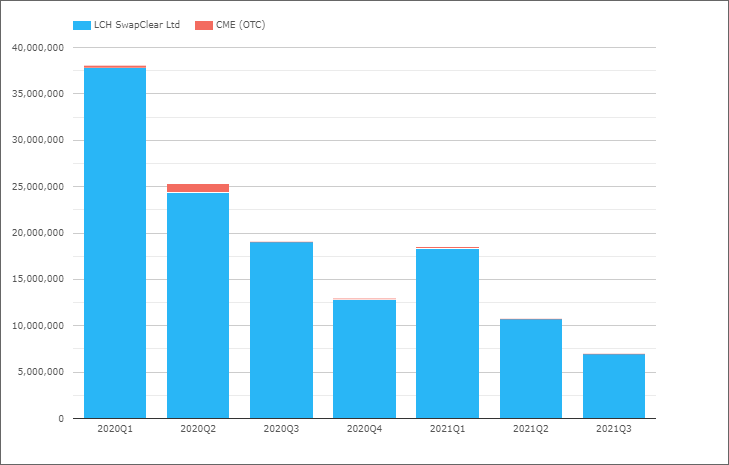
And there we have the reason, massively declining FRA volumes, as the portfolio maintenance activity for dates after Dec 31, 2021 is no longer being done by FRAs, but by single period swaps (SPS), because Libor Fallbacks do not work for an upfront settled product like FRAs. This SPS volume is showing up in Swaps, massively overstating the 2021 Swaps volume e.g. 3Q 2020 FRA volume was $12 trillion higher than 3Q 2021, which largely explains why 3Q 2021 IRS volume was $10 trillion higher than 3Q 2020.
USD OIS
Overnight Index Swaps that reference FedFunds or SOFR.
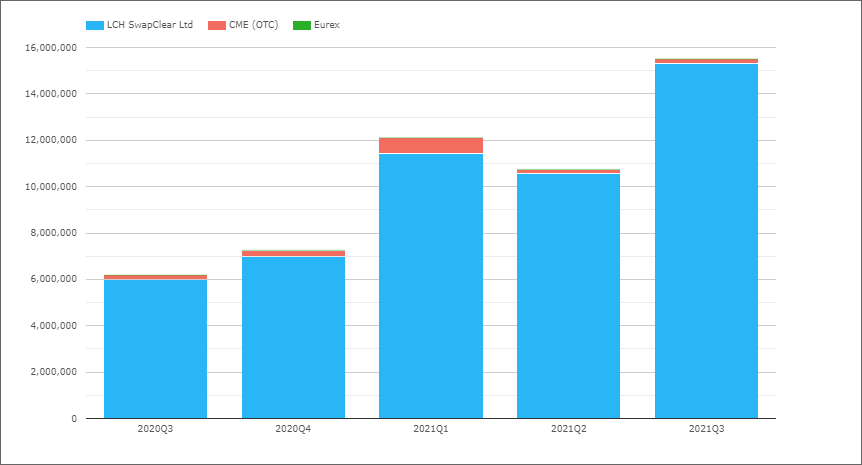
- 3Q 2021 with $15.5 trillion, up 44% QoQ from $10.75 trillion and up 150% YoY from $6.2 trillion
- LCH SwapClear with $15.3 trillion a share of 98.8%, up QoQ from 98.4% and YoY from 97%
- CME OTC with $184 billion a share of 1.2%, down QoQ from 1.6% and YoY from 3%
- Comparing LCH SwapClear client volumes with CME OTC shows $10.4 trillion vs $184 billion or 98.3% vs 1.7%, a higher share than the 95.7% vs 4.3% average over the last 15 months
As USD OIS Swaps, include both FedFunds and SOFR, the second of which we know from prior blogs has picked up volume as we approach the end of Libor, lets turn next to these.
SOFR Swaps
Swaps which reference SOFR, both OIS and Basis.
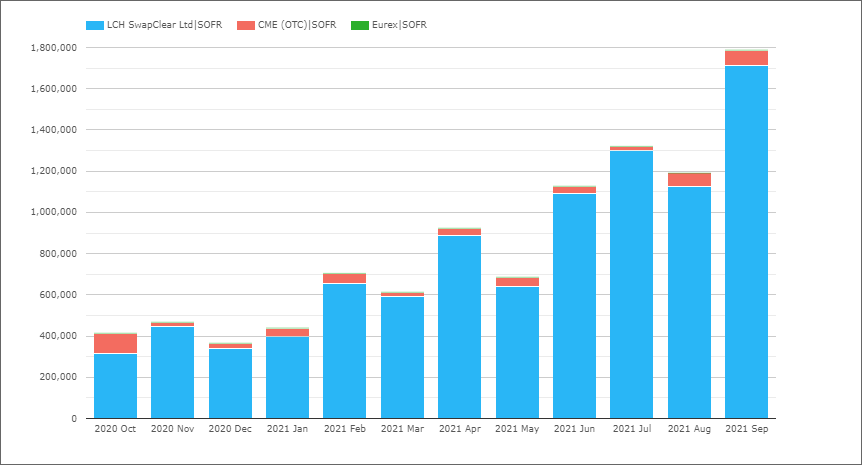
- Sep 2021 with $1.8 trillion, a new record high, up 50% from the $1.19 trillion in Aug 2021
- 3Q 2021 with $4.3 trillion up from $2.7 trillion in 2Q 2021, which compared to the $15.5 trillion of OIS, shows that FedFunds still dominates, at least in gross notional terms, while in DV01 terms the picture is very different with $3 billion of SOFR (OIS and Basis) vs $5.6 billion of OIS (FF and SOFR) vs $15 billion of IRS Libor
- LCH SwapClear with 95.7% share in Sep 2021 and CME OTC with 4.2%, compared to 94.8% vs 5.2% over the 12 month period
SOFR growth rates of 50%, looking set to continue/accelerate as we enter the all important 4Q 2021.
LCH SwapClear share of SOFR volumes is similar to its share of Libor IRS.
EUR IRS
EUR IRS only, so excluding OIS, Basis, ZC, VNS and FRAs.
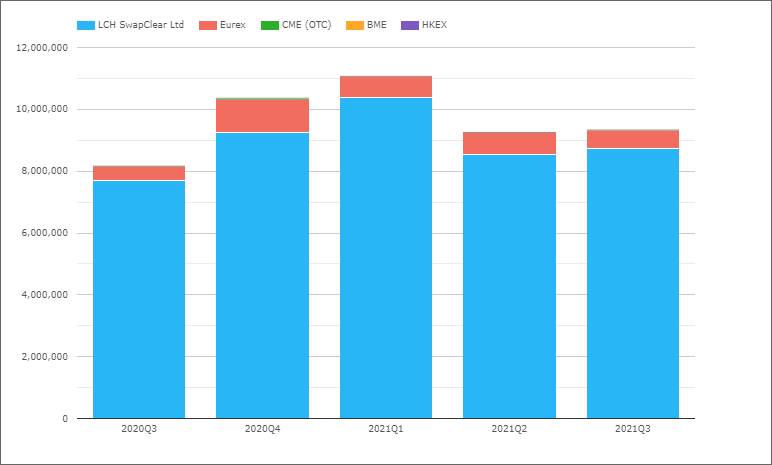
- 3Q 2021 with €9.3 trillion, similar to 2Q 2021 and up from €8.2 trillion in 3Q 2020
- LCH SwapClear with €8.7 trillion a share of 93.5%, up QoQ from 92.1% but down YoY from 94.3%
- Eurex with €604 billion a share of 6.5%, down QoQ from 7.9% but up YoY from 5.4%
- While the share over this 15 months is 92.6% LCH SwapClear to 7.3% Eurex
- Comparing just Client volumes, we see LCH SwapClear with €3.9 trillion in 3Q 2021, Eurex with €201 billion and CME OTC with €4.4 billion, making the respective shares, 95%, 4.9% and 0.1% compared to the 3Q 2020 share of 93.9%, 5.3% and 0.8%.
EUR Swap volumes flat and remaining subdued. Note there is no FRA to SPS effect in EUR as Euribor is continuing for a few more years at least.
The Eurex share gains that we saw in 2020, increasing from 3.9% in 1Q to a high of 10% in 4Q, have not continued into 2021, where we see 6.1%, 7.9% and 6.5% in the three quarters so far.
EUR OIS
Overnight Index Swaps that reference EONIA or €STR.
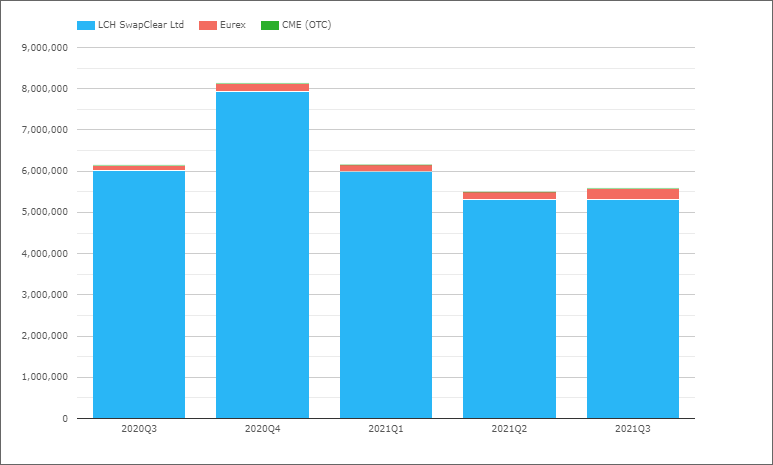
- 3Q 2021 with €5.6 trillion, similar to 2Q 2021 but down from €6.1 trillion in 3Q 2020
- LCH SwapClear with €5.3 trillion a share of 94.9%, down QoQ from 96.7% and YoY from 97.9%
- Eurex with €282 billion a share of 5.1%, up QoQ from 3.3% and YoY from 2.1%
- Comparing just Client volumes, we see LCH SwapClear with €3.5 trillion in 3Q 2021, Eurex with €58 billion, making the respective shares, 98.4 % vs 1.6% compared to the 3Q 2020 share of 98.6% vs 1.4%.
EUR OIS volumes flat for three quarters now and Eurex gaining some share to get closer to it’s share in IRS.
€STR Swaps
Swaps which reference €STR, both OIS and Basis.
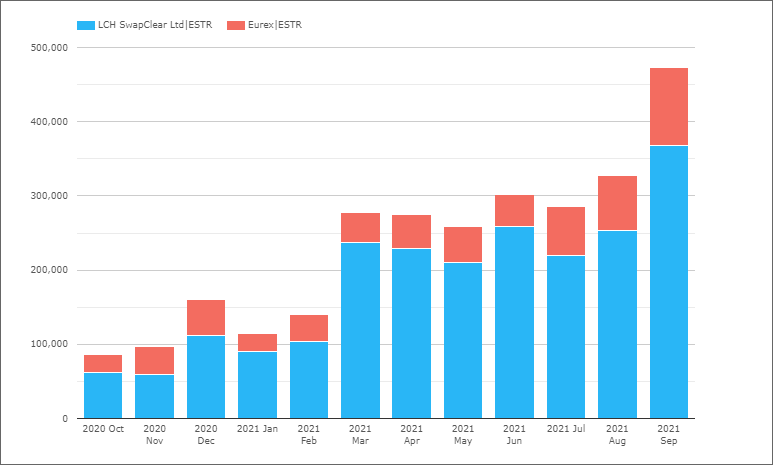
- Sep 2021 a record month with €473 billion of single sided gross notional.
- LCH SwapClear with 77.9% share and Eurex with 22.1% in Sep 2021
With the conversion of outstanding EONIA trades to €STR at CCPs earlier this month, we expect to see much higher ESTR volumes going forward.
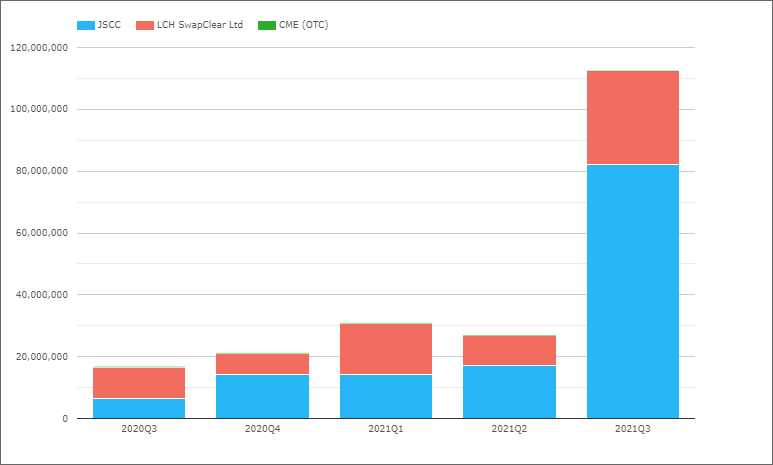
JPY IRS
JPY IRS only, so excluding OIS, Basis, ZC, VNS and FRAs.
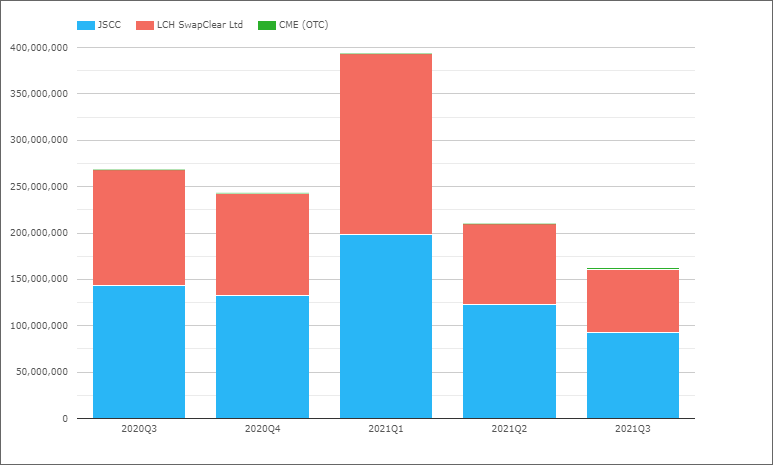
- 3Q 2021 with Y162 trillion, down from Y210 trillion in 2Q 2021 and Y268 trillion in 3Q 2020
- JSCC with Y93 trillion or 57.4% in 3Q 2021, down from 58.4% in 2Q 2021 and up from 53.3% in 3Q 2020
- LCH SwapClear with Y67 trillion or 41.7% in 3Q 2021, up from 41.4% QoQ and down from 46.7% YoY
JPY Swap volumes significantly lower in 2Q and 3Q than the corresponding quarters in 2020, as we would expect given the upcoming end of JPY Libor.
JSCC share increasing materially over the last 2 quarters, from 50.3% in 1Q to 57.4% in 3Q.
JPY OIS
Overnight Index Swaps that reference TONA.
- A huge jump in 3Q 2021 to Y112 trillion from Y27 trillion in 2Q 2021
- (see RFR trading is now at 50% in CHF and JPY)
- JSCC with Y82 trillion or 73% in 3Q 2021, up from 53.7% in 2Q 2021 and 39.5% in 3Q 2020
- LCH SwapClear with Y30 trillion or 27% in 3Q 2021, down from 36.1% QoQ and 59.7% YoY
JPY OIS volumes climbing steeply as we near the end of JPY Libor.
JSCC increasing market share hugely in OIS, from 39.5% a year ago to 73% in 3Q 2021.
AUD Swaps
AUD Swaps all types, IRS, OIS, Basis, ZC, VNS.
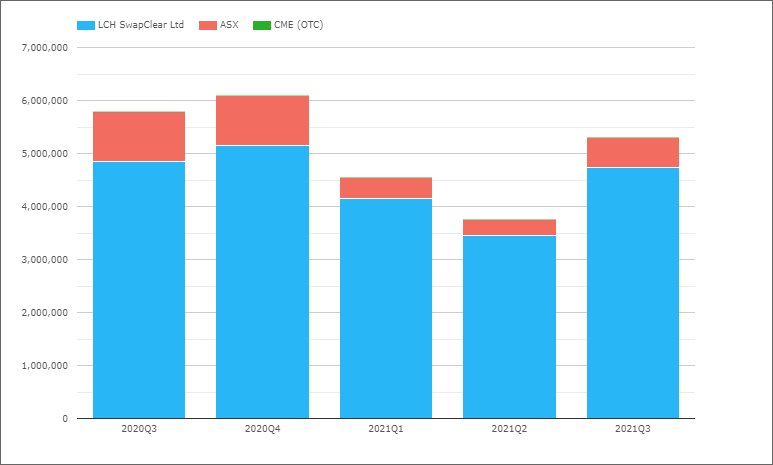
- 3Q 2021 with A$5.3 trillion, up from A$3.8 trillion in 2Q 2021 and down from A$5.8 trillion in 3Q 2020
- LCH SwapClear with A$4.7 trillion or 89.4% in 3Q 2021, down QoQ from 91.7% and up YOY from 83.8%
- ASX with A$561 billion or 10.6%, up from 8.2% QoQ and down from 16.1% YoY
AUD Swaps picking up, while market share is a touch down QoQ for LCH SwapClear but higher YoY.
CAD and GBP Swaps
I do usually cover CAD and GBP Swaps (see Volumes – 3Q 2020), however will skip this time; my two excuses being that the charts lack color with LCH SwapClear > 99% share and time is running out for me to complete this blog.
Of-course those of you with CCPView access, can login and check out the volumes yourself. For those without and interested in a subscription, please do contact us for details.
So let’s turn next to a Swap product with competitive market share.
Credit Default Swaps
Index – iTraxx Europe family
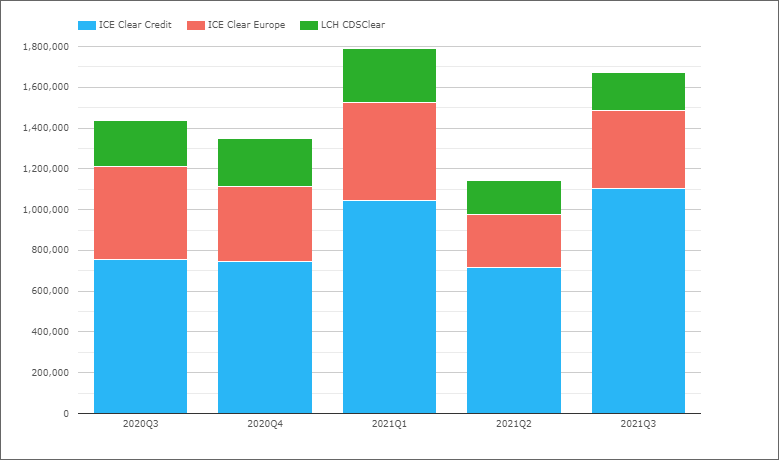
- 3Q 2021 with €1.7 trillion, up from €1.1 trillion in 2Q 2021 and €1.4 trillion in 3Q 2020
- ICE Clear Credit with €1.1 trillion in 3Q 2021, a share of 66%, up QoQ from 62.7% and up YOY from 52.7%
- ICE Clear Europe with €382 billion, a share of 22.9%, up QoQ from 22.7% and down YoY from 31.8%
- LCH CDSClear with €186 billion, a share of 11.1%, down QoQ from 14.6% and YoY from 15.7%.
ICE Clear Credit, the US domiciled CCP, gaining significant market share from the UK and EU CCPs, a Brexit related development that we have commented on before, see here.
Single Name in Euro
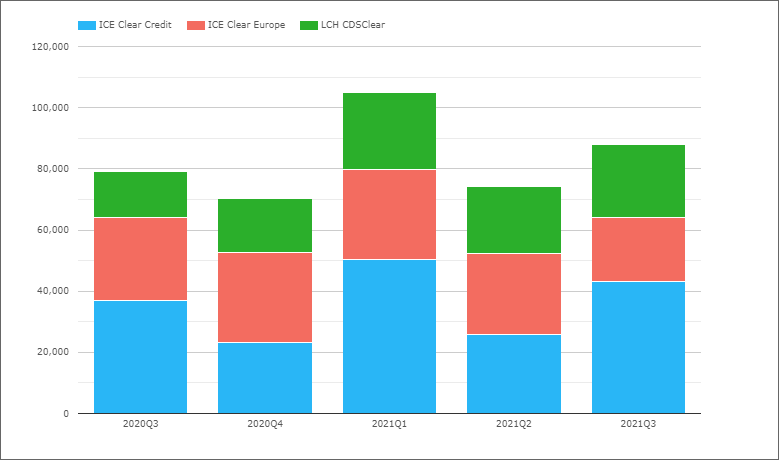
- 3Q 2021 with €88 billion, up from €74 billion in 2Q 2021 and €79 billion in 3Q 2020
- ICE Clear Credit with €43 billion in 3Q 2021, a share of 49.1%, up QoQ from 35% and 46.6% in 3Q 2020
- ICE Clear Europe with €20.9 billion, a share of 23.8%, down QoQ from 35.5% and YoY from 34.3%
- LCH CDSClear with €23.8 billion, a share of 27.1%, down QoQ from 29.4% and up YoY from 19%.
Volumes in cleared single-name in Euro at €88 billion, an order of magnitude lower than the €1.7 trillion in Credit Indices in Euro.
Again similar market share changes to that in CDS Index, with ICE Clear Credit gaining market share, however in addition for the first time we see LCH CDSClear with higher share in a quarter than ICE Clear Europe.
Index Options in Euro

USD Credit Index, Single-name and Options
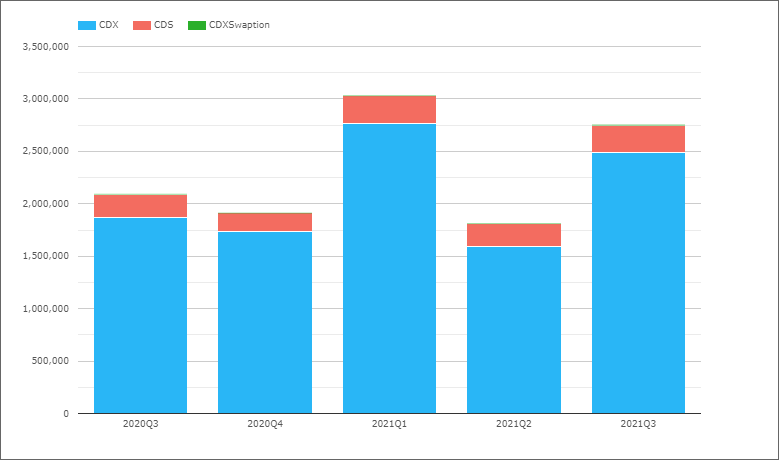
- As ICE Clear Credit has 97% market share, it is more interesting to get a product breakdown
- CDX in 3Q 2021 with $2.49 trillion, up from $1.59 trillion in 2Q 2021 and $1.87 trillion in 3Q 2020
- Single-name in 3Q 2021 with $262 billion, up from $216 billion in 2Q 2021 and $225 billion in 3Q 2020
- Index Options in 3Q 2021 with $8.1 billion, up from $4.9 billion in 2Q 2021 and started to clear in 4Q 2020 with $110 million
Good growth both QoQ and YoY in each of the three products, with USD Index at $2.49 trillion twice the size of the EUR Index market, USD Single-name also over twice the size of EUR, while USD Index Options are less than half the volume of EUR Index Options, which started clearing much earlier at LCH CDSClear.
Foreign Exchange
Cross Currency Swaps
At HKEX, the only CCP that clears this product.
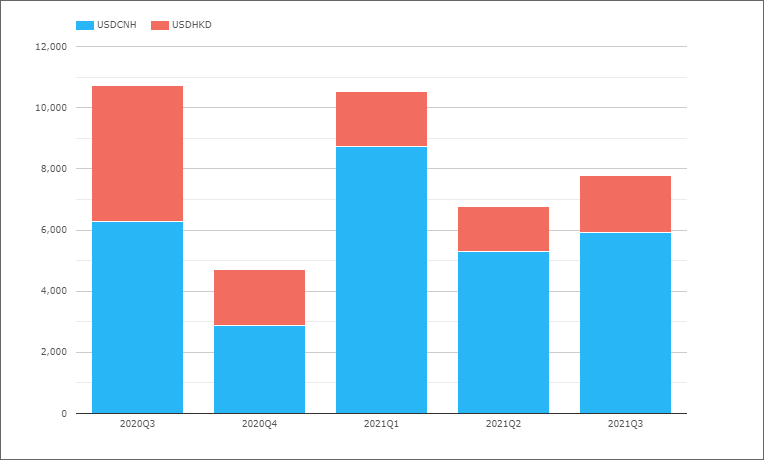
LCH SwapAgent does process (not clear) cross-currency swaps, but it’s volumes are not regularly published, 2020 figures can be seen in this press release.
Non-Deliverable Forwards
As LCH Forexclear has a 98% market share, it is more interesting to get a currency pair breakdown
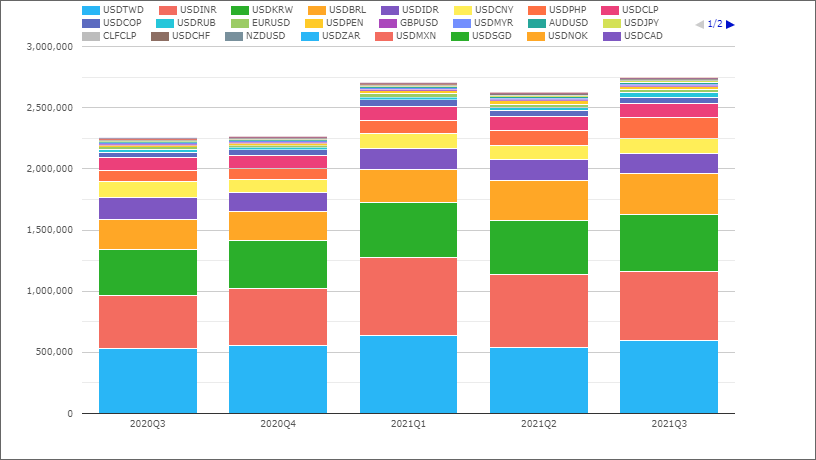
- 3Q 2021 with $2.7 trillion, up from $2.6 trillion in 2Q 2021 and $2.2 trillion in 3Q 2020
- USDTWD the largest currency pair with $600 billion in 3Q 2021
- USDINR next with $565 billion, followed by USDKRW $465 billion and USDBRL $340 billion
- USDPHP in particular at $165 billion in 3Q 2021 is much higher than $91 billion a year earlier
- Some volume in G10 NDF with $24 billion in EURUSD and $15.6 billion in USDJPY
So continued growth in FX NDF cleared volumes across many currency pairs.
FX Options
All at LCH ForexClear.
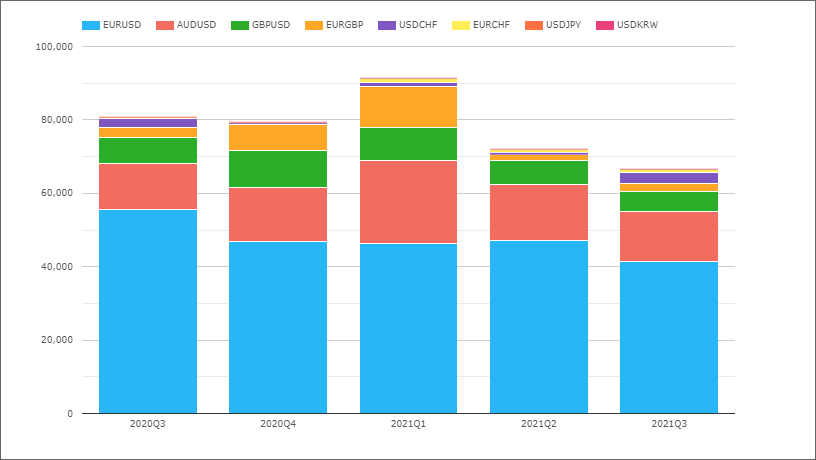
- 3Q 2021 with $66 billion, down from $72 billion in 2Q 2021 and $81 billion in 3Q 2020
- EURUSD the largest currency pair with $41 billion in 3Q 2021
- AUDUSD next with $14 billion, followed by GBPUSD with $5 billion
Lower volumes in most currency pairs over earlier quarters.
That’s It
There is a lot more data in CCPView.
Volumes by tenor buckets: 2Y, 5Y, 10Y, 20Y, 30Y.
Daily, weekly, monthly, quarterly or annual.
Volume, ADV, DV01, Open Interest, OI Change.
Swaps in many more currencies and product types.
EM with Asia Pac, EMEA, LatAm.
Also Futures and Options in major currencies.
Please contact us if you are interested in a subscription.