Bloomberg and ICAP are fighting it out for the number one position in our latest monthly review of Interest Rate Swap volumes. We show that February looked a lot like January for both SEFs and CCPs, and that nearly 25% of risk was traded as part of a strategy.
USD IRS On-SEF
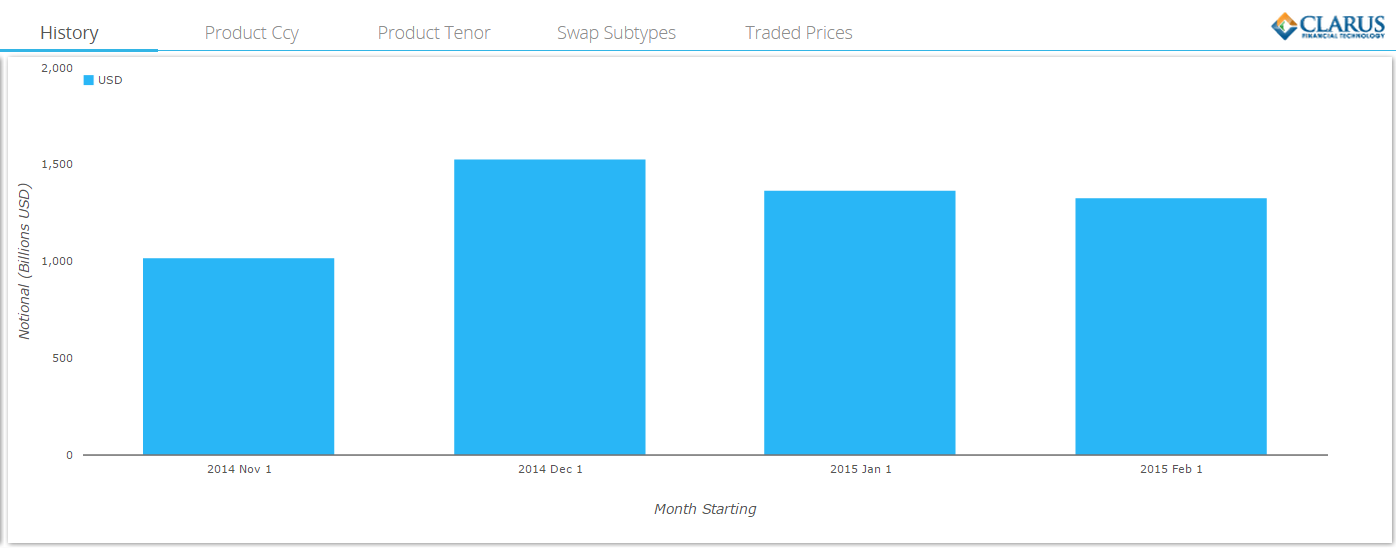
Broadly speaking, February 2015 looked a lot like January 2015 in notional terms. Volumes were virtually identical for the two months for USD-IRS traded on-SEF, between $1.3 and $1.4trn:
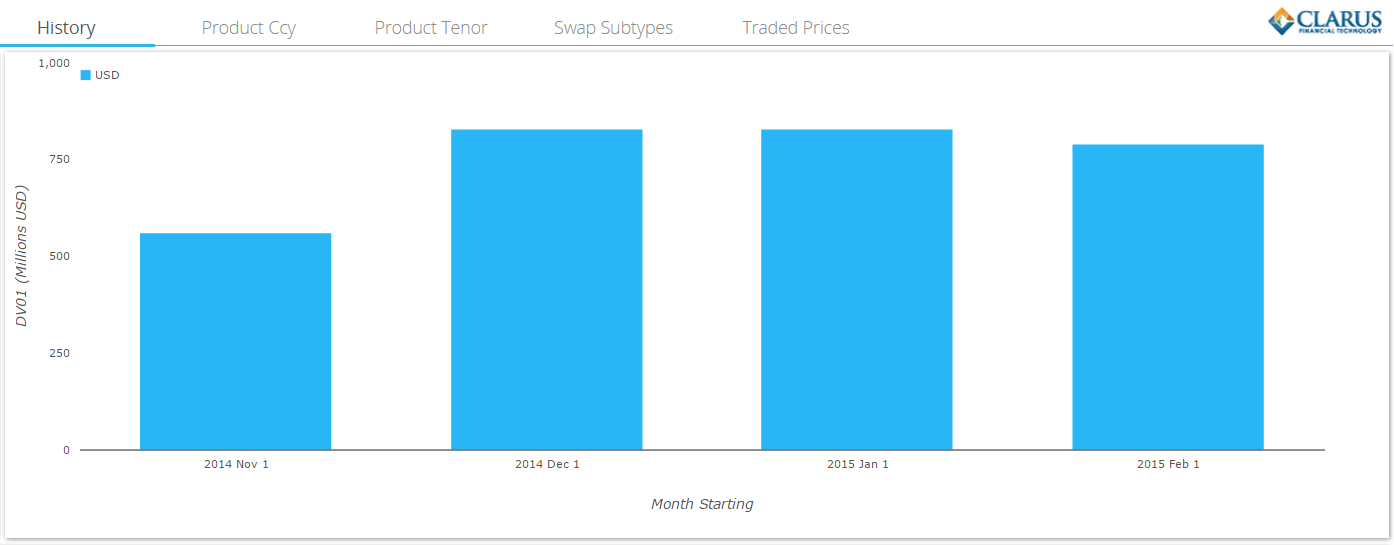
 The good news continues in DV01 terms, with trading so far in 2015 running at elevated levels. February recorded nearly 93% of October’s record month for on-SEF risk traded. The past 3 months have seen remarkably stable numbers, totaling around $800m DV01 per month. If we take into account there were only 19 trading days in February versus 20 in January, we see an almost identical per day average at $41.5m. DV01 figures below:
How Good are these volumes?
The only caveat with these numbers occurs when we look at the underlying markets themselves. Bluntly, we might expect SEF’s to be blowing the doors off due to the volatility we are seeing – particularly at the long-end. As Amir highlighted in January, market moves have been large in 2015. During February we saw the long end move another 30bp higher:
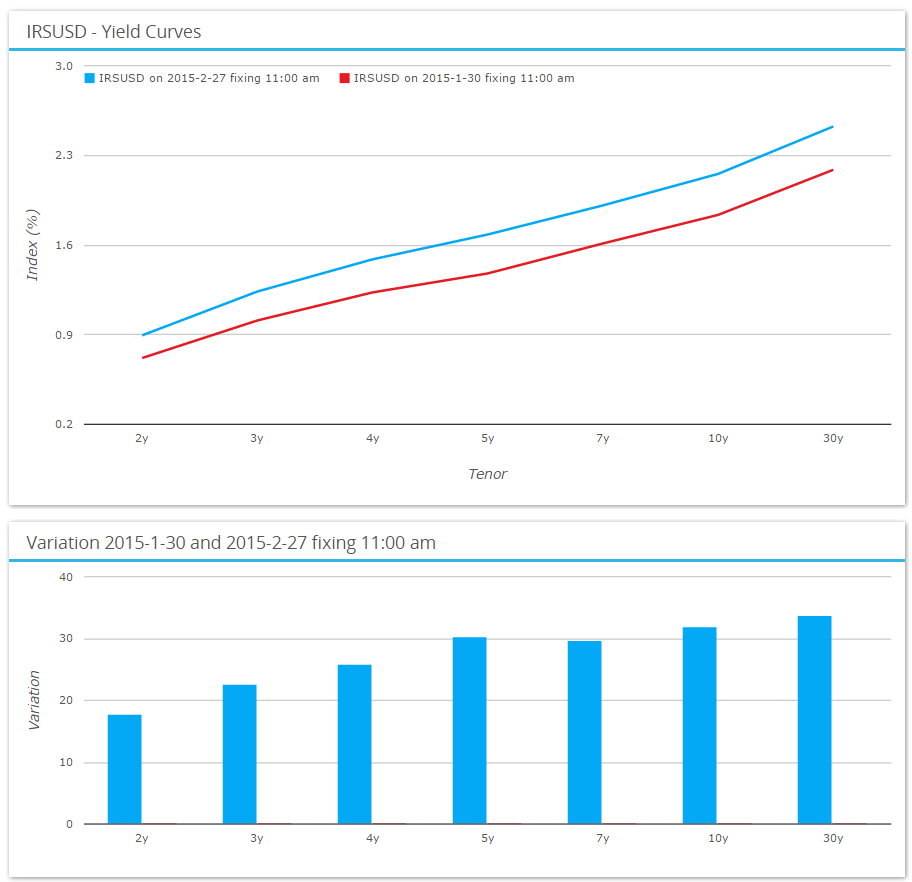
Amir used the number of days that we saw 5bp moves or greater last month as a nice visual way of representing volatility. This month, if I go with the numbers, realised volatility was identical in 5yrs at 51% (annualised) and slightly lower in 30 years at 31% (versus 40% for January). This is still pretty high compared to 2014, so it’s not a huge surprise that volumes are remaining healthy.
On-SEF vs Off-SEF
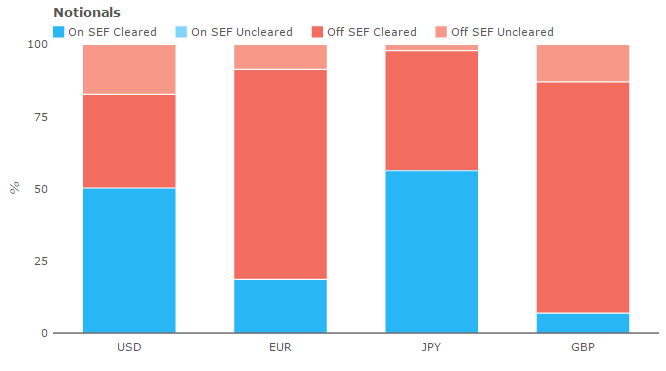 It is an open question as to whether this continued volatility is driving trading off SEF. What we can say is that February saw a drop in the percentage of trading occurring on-SEF for USD IRS, when only 50% by notional and 54% by DV01 was traded on-SEF. As the chart above shows, JPY-denominated swaps saw the largest proportion trading on-SEF, at 56% by notional (although this drops to 44% when measured in DV01). The proportion of EUR and GBP swaps transacted on-SEF was tiny – 16% and 8% in DV01 terms.
And for the whole market?
Using CCPView, we can get a clear global picture of the OTC markets. Looking at all currencies and all IRD products we see the following:
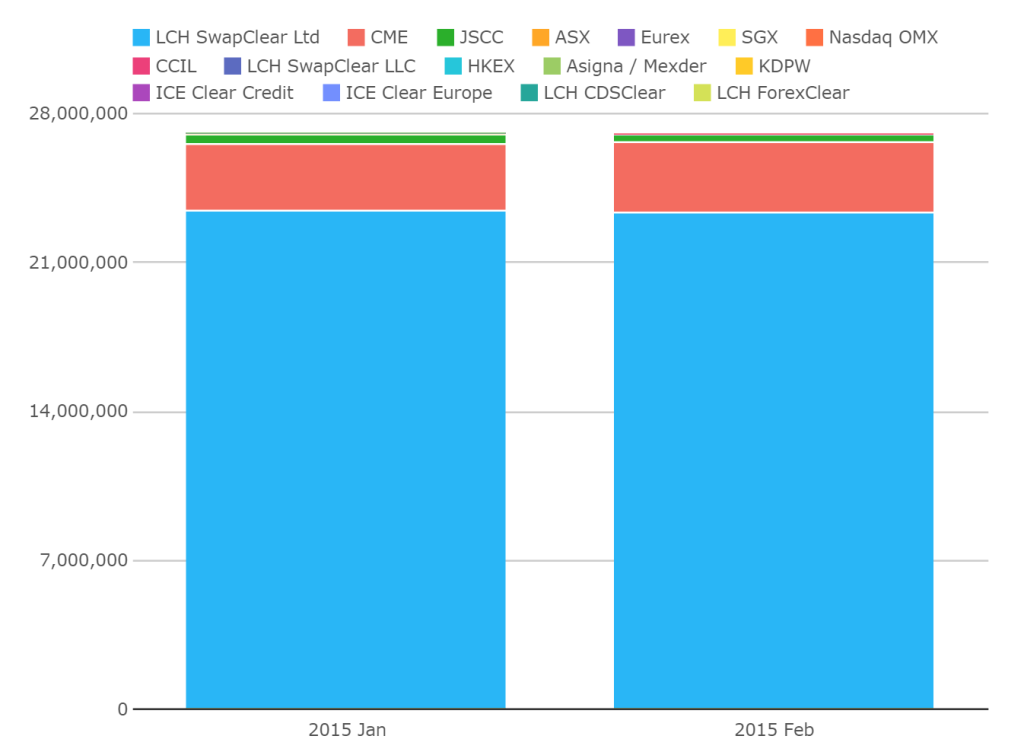
Once again, we are talking stability here. Freakishly stable actually – LCH’s cleared IRD volumes were 99.6% of January’s numbers for example.
As Tod looked at previously, we are fans of a metric we think of as Clearing Efficiency at the moment – looking at how the CCPs are managing Open Interest in light of industry-wide compression efforts. We can measure this by looking at Volumes during the month divided by change in Open Interest – as such, it is a measure of new cleared business per unit change of residual.
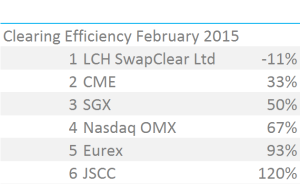
There has only been a small window of time since Tod’s last blog, but nonetheless we still see some notable changes in this metric. CME are continuing their compression efforts, with a decreasing ratio – which we highlight as part of TrueEx’s recent success below. Also, looking at February may be less skewed by a number of maturing trades at year-end – the LCH metric has collapsed from a clearly unsustainable -130% to a more-believable -11%. Still good to see the industry concentrating on compression however.
A small footnote on the JSCC numbers – as Tod mentioned, we look at our collated figures in USD terms, and of course USD/JPY has weakened by some 3% during the month. JSCC’s Open Interest has therefore increased by more than the volume traded but only in USD terms. Interestingly, this FX volatility is a symptom of how large the Open Interest is in relation to the monthly volumes, and applies just as well to the other CCPs in the table.
SEF Volumes and Market Share
And finally onto the winners and losers in the month. If we look at just USD Swaps, the picture looks very similar to last month….which seems to be the recurring theme of this blog so far!
Therefore, to avoid repeating ourselves, lets use the DV01 measure in SEFView to look at all Interest Rate Derivatives traded this month, across all currencies. This broader measure helps give a clearer view of all activity across the SEFs:
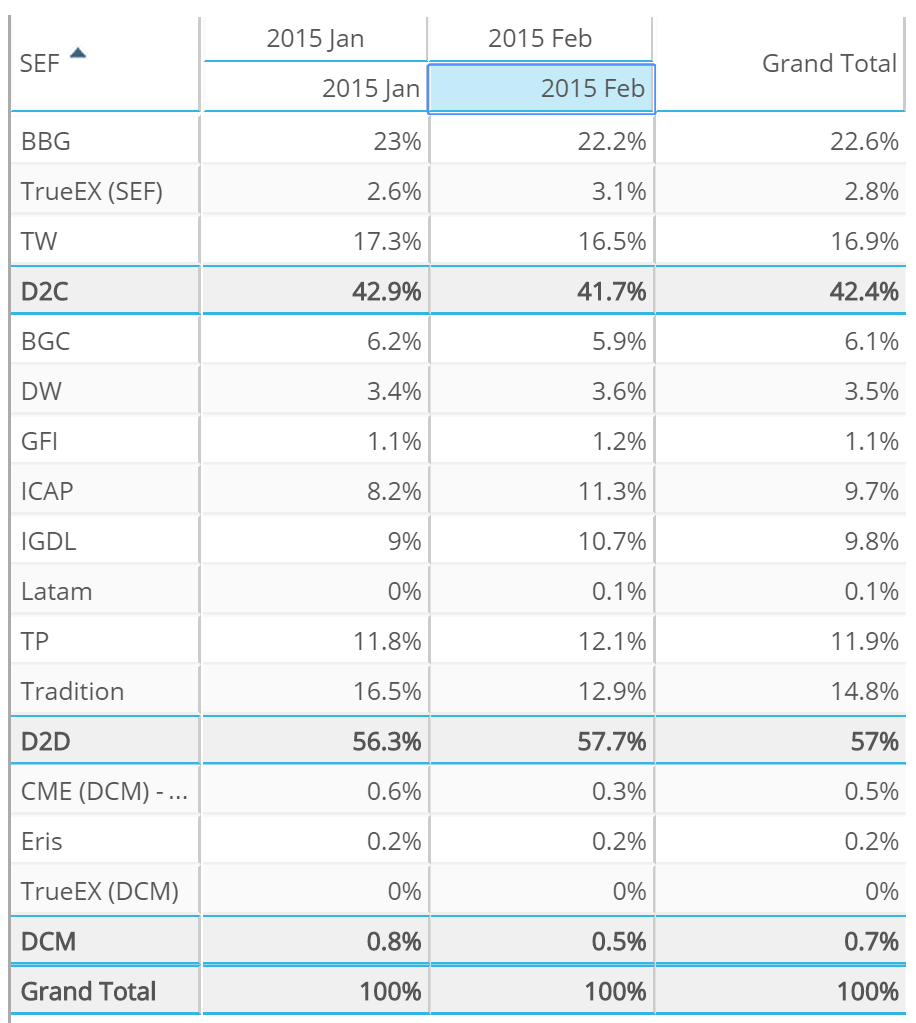
What this shows is:
- BSEF are (just) number 1, with 22.2% market share in Feb.
- But ICAP are virtually tied at 22% with them (remember to sum ICAP and IGDL).
- That leaves Tradeweb in third place, with Trads and Tullets to scrap it out for fourth.
- Plus another notable performance from TrueEx, who are continuing to build on January’s increase in volumes.
Just a cursory glance at one of the TrueEx drill-down reports in SEFView shows that much of this activity is down to Compression activity for CME-cleared IRS:
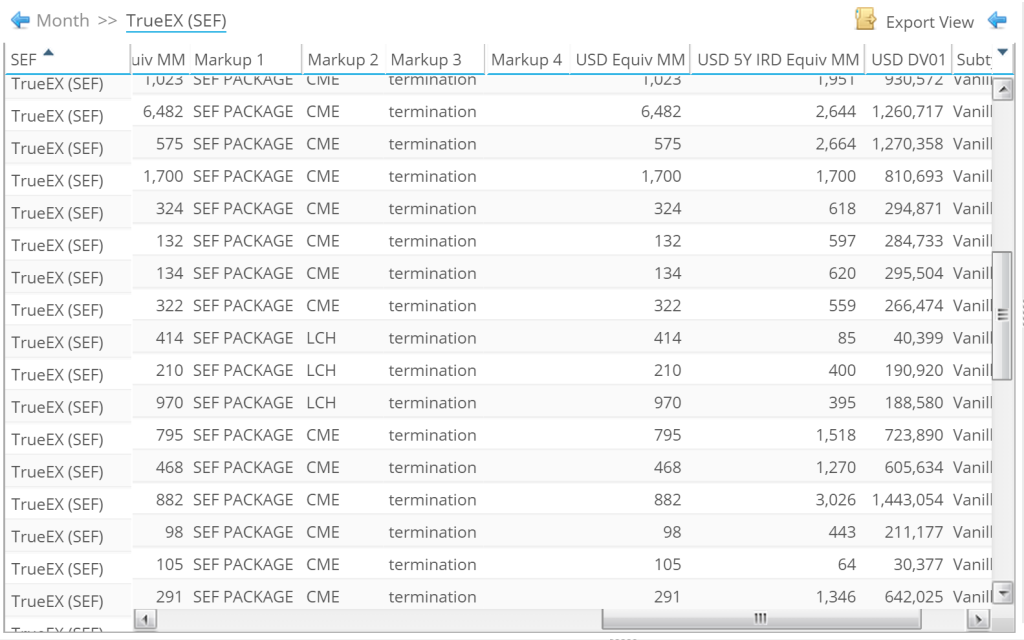
In fact, when I export these figures I see that 95% of the TrueEx volumes were labelled as CME Terminations, an area that is clearly driving their growth. And as we saw from CCPView, improving CME’s clearing efficiency metrics to boot!
SEFs and Curve Trades
We are now also able to separate the trading Universe into outright trades and Curve and Fly strategies. During February 2015, we see the following USD On-SEF Curve trades:
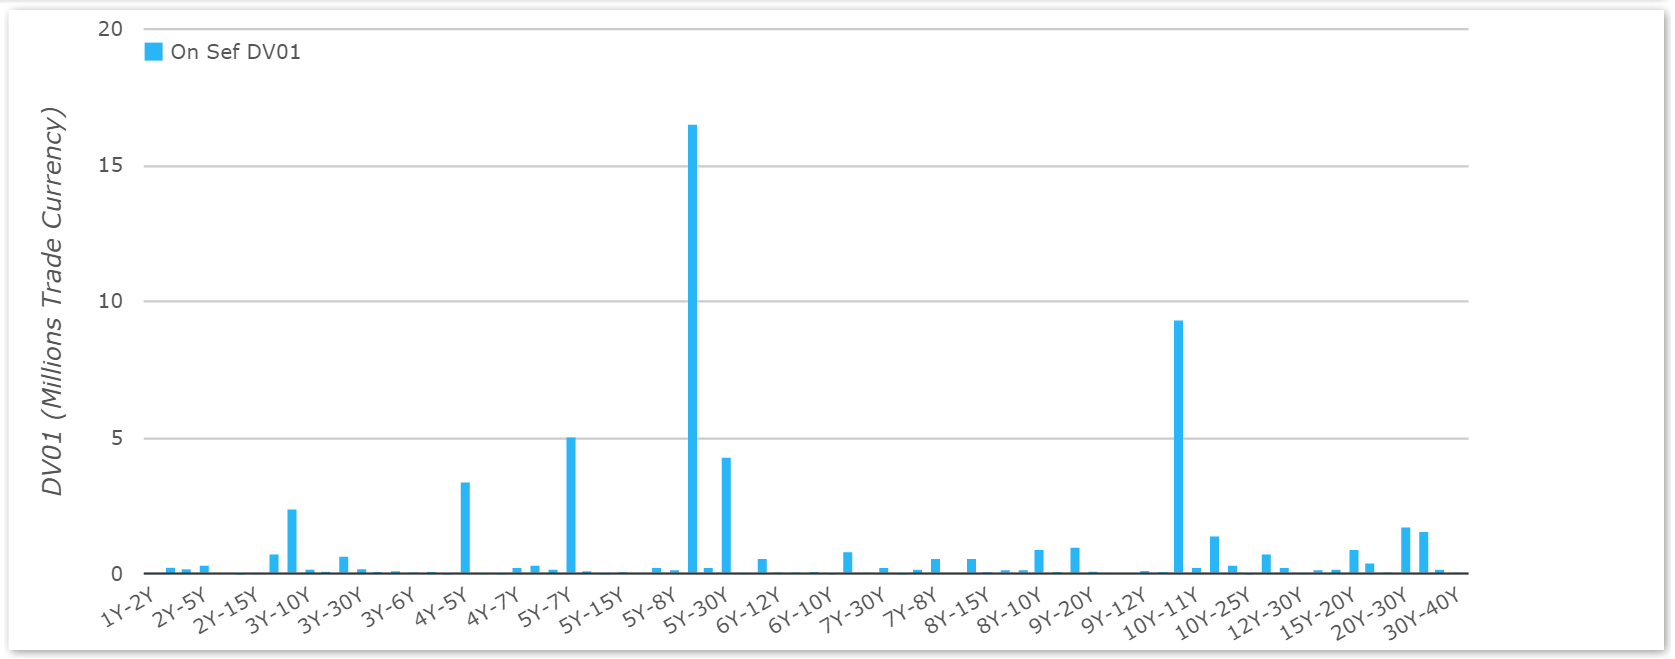
Picking out a couple of highlights in the chart above, we can see that this risk is concentrated mainly in 5y10y with significant volumes also evident in 10y30y. For an overview, please see my January review here.
SEFView shows us that USD on-SEF swaps trading totaled $833m DV01 in February. Using the data on Curve and Fly trades we can see that $189m of DV01 traded as part of a package. Overall we can therefore say that at least 22% of trades transacted were part of a strategy – and in reality, this figure will be higher as we identify a number of block trades within SDRView that are part of a strategy.
And on that bombshell…..til next week.