- We provide an update to our USD OIS Volumes blog from earlier last year.
- Highlighting that OIS structures that run from one FOMC meeting date to the next are the most common trades.
- This gives us a unique insight into market consensus pricing for the exact FOMC dates, unlike the 30-day Fed Fund futures contracts.
- We can therefore calculate the Volume Weighted Average Price for all trades going into any Fed announcement or event.
- This helps us in our bid to build a reliable Fed Surprise Indicator, which we introduced at the end of last year.
USD OIS Trade Counts
Following a client enquiry, I realised I may have jumped the gun a little bit last week. So let’s rewind slightly and revisit a few market statistics on USD OIS trading. We’ll then have a look at price information for the most-commonly traded structures – naturally, hand-in-hand with the volume information.
I traded Eonia swaps for a few years, therefore I got very used to trading swaps that mirrored the exact date-gap between the ECB meeting dates. These matched the so-called ECB “Maintenance Periods” and are the “purest” representation of ECB monetary policy decisions. The Eonia market has always seen peaks and troughs in the overnight fixings due to demand for cash at different times of the maintenance period, driven by the different ways that banks manage their balance sheets to meet average reserve requirements. (See Gary’s thoughts here on this so-called “heartbeat”).
Historically, whether due to liquidity, a tighter range in fixings or simply a bigger market, we have not seen a similar “heartbeat” in Fed Funds fixings. Therefore, I always thought that spot-starting, vanilla OIS trades such as 1 month, 2 month and 3 month maturities were most commonly traded in USD.
Whether my assumption was wrong, or whether the market is now worried about Fed balance-sheet unwinds affecting the range of Fed Fund fixings, the data shows that USD OIS is now most commonly traded on exact Federal Reserve (FOMC, Federal Open Market Committee) meeting dates:
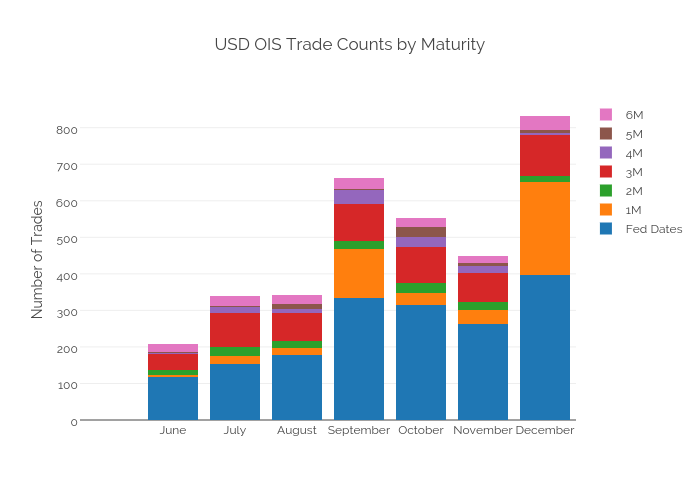
Showing;
- FOMC meeting dated OIS trades are the most commonly traded structure by trade count in the last six months of 2015.
- These are trades that start on the final day of the FOMC meeting and end on the final day of the next FOMC meeting (dates are freely available here)
USD OIS Trade Notional
As Amir pointed out in his original blog, OIS trades are large notional, short maturity trades. This means that trade count is actually a pretty good indicator for where liquidity is as well. And when we look at the notional traded in USD OIS, we see a decent concentration in FOMC-dated structures:
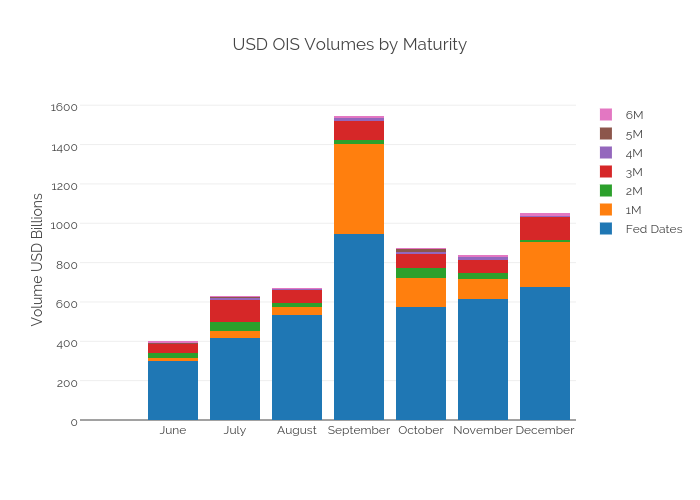
Showing;
- Due to their short-dated nature, an even greater percentage of OIS trades are done for specific Fed-dated structures compared to a vanilla trade count.
- Despite being similar in maturity to 1 month trades, Fed-dated structures have a much larger notional trading each month than 1 month or 2 month trades.
These two charts suggest that Fed-dated (FOMC-dated) OIS are the most liquid OTC instrument at the short-end and allows market participants to exactly hedge their exposures to rate-change decisions.
Are these traded On or Off-SEF?
Fed-dated OIS trades are amongst the lowest percentage (by unadjusted notional) to trade on-SEF:
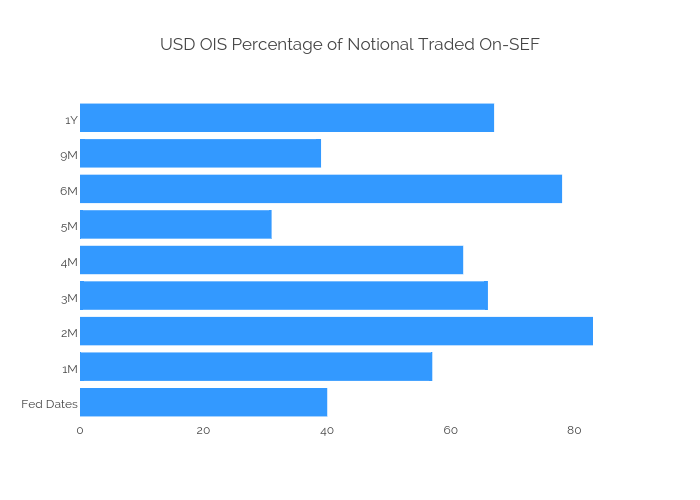
- Only 40% by notional of Fed-dated structures trade on-SEF.
- Due to them being the most traded products, this skews the overall picture for OIS trading.
- Meaning that less than half of all USD-OIS notionals trade on-SEF. Maybe Fed-dated OIS trades will be the first to be MAT’d for this asset class?
So much for volumes, what about prices?
With that background to volumes and execution in place, please consider this as another (small) stepping stone in my series about a “Fed Surprise Indicator“. Seeing as we know that the Fed-dated swaps are so liquid, that also means they contain some of the most valuable price information. So let’s have a close look at this.
VWAP Price Data
Volume Weighted Average Prices of these structures provide an important insight into what the market has traded, and with what kind of conviction. It’s consensus (and particularly the wrong consensus) that can cause sharp price moves (for example, due to stop-loss activity). Let’s see what the data has shown us for the past six months:
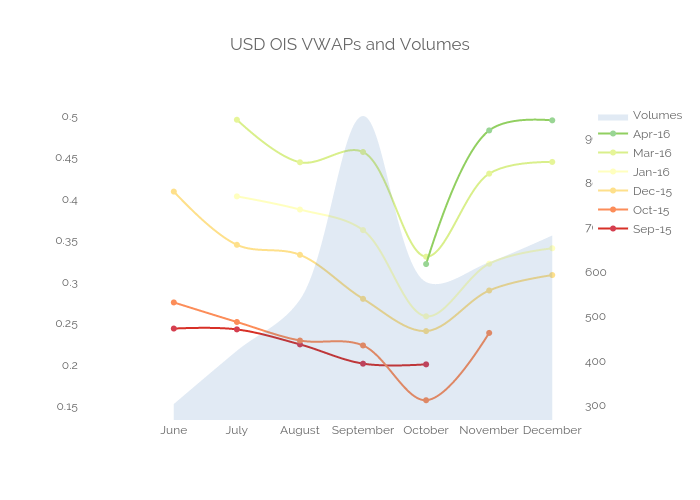
Showing;
- VWAPs for all Fed dates slowly decreased throughout the year, bottoming out in October.
- The chart also shows the evolution of volumes with respect to these price moves….
- Such as the sharp increase in volumes in September (due to the more dovish Fed) followed by a sharp drop in prices
- The combined chart tells a story of a market putting on increasingly hawkish positions as prices dropped into the September meeting…
- …with the drop in Volumes during October suggesting that much of this positioning was unwound after the September meeting…
- This is probably evidence of a market being caught sharply off-side and repositioning after the Fed September “surprise”.
- Volumes, then, reveal valuable information in this instance about market positioning.
Combining the two
This chart therefore has my curiosity piqued and acts as a nice follow-on to the previous blog about the Fed Surprise Indicator. The “surprise” level looks to be largest when volumes increase hand-in-hand with a change in VWAP. Therefore, by looking at the change in VWAP plus the volume, September would clearly come out on top- eliminating one of the weaknesses from last week’s analysis.
The next step is therefore a combination of these past two week’s work. We’ve looked at the change in volumes versus average volumes last week. Now we’ve looked at the change in prices in tandem with volumes.
Next week, we’ll look at the change in VWAP over increasingly granular periods, coupled with the volumes traded to try and finally arrive at a “Fed Surprise Indicator” that makes sense….and that fits with history!
In Summary
- The USD OIS market sees most trades in FOMC-dated structures.
- This may be due to concerns over changes in the Fed’s balance sheet causing increased volatility in Fed Funds fixings.
- Whatever the cause, we can take advantage of this market structure to reveal precise market consensus for future FOMC meetings.
- Combining this price information with volume information is the aim…
- …which will enable us to gauge the level of “surprise” in the market following Fed policy announcements, communications, data etc.
- We are not there yet, but a Fed Surprise Indicator looks achievable from our initial analysis.