I wanted to do a long-overdue follow-up on a blog I wrote in 2019, ISDA SIMM FX Optimization and NDFs.
That blog outlined the growth of G10 NDFs in response to the initial phases of UMR go-live from 2016 onwards, hypothesizing that multilateral FX IM optimization was driving the trend. (Note that another term was used for FX IM optimization.)
The blog suggested testing this hypothesis by looking at day-by-day NDF activity. Better six years later than never, I suppose.
Background
In this blog, we look at both SDRView and CCPView volumes. Note that SDRView accounts for about half of global cleared and uncleared volume, while CCPView is 100 percent of the cleared-only volume.
First let us look at the total volumes of FX products included in uncleared margin rules (UMR) scope.
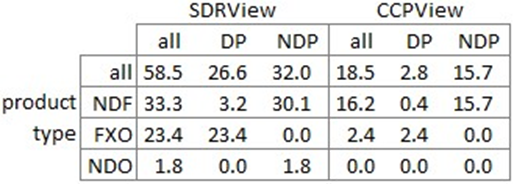
Table 1: 2024 volumes of FX products in UMR scope (notional $ trillions). Source: SDRView, CCPView.
Table 1 shows that, in 2024, NDFs and FX options (FXO) dominated UMR FX product volumes.
- Non-deliverable pair (NDP) trading was $32 trillion, dominated by NDFs but with $1.8 trillion non-deliverable options (NDO).
- Deliverable pair (DP) trading (which includes G10 pairs) was $27 trillion, dominated by FXO, but with $3.2 trillion NDFs.
Anecdotally, FX risk for non-linear products (FXO and NDO) is about 80–90 percent linear risk. It follows that being able to offset SIMM linear FX risk is the main job of FX IM optimizers. Given the three products available, the natural choice is NDFs, being the only product with only linear risk.
As we will see, observing trading activity patterns between DPs and NDPs separately helps us understand what is happening.
By platform type
First, let us look at the platform type share of 2024 US-reported NDFs.
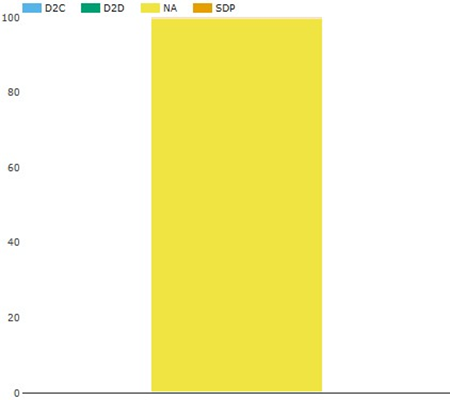
Chart 1a: 2024 DP NDFs platform type share. Source: SDRView.
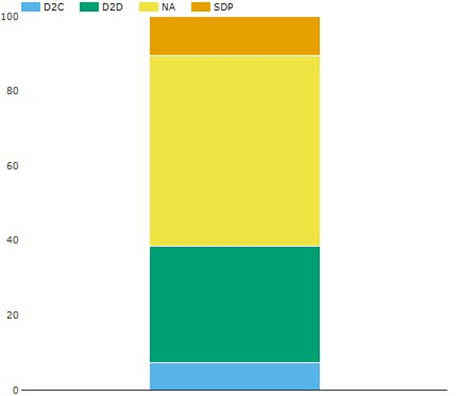
Chart 1b: 2024 NDP NDFs platform type share. Source: SDRView.
Chart 1a shows that DP NDFs are all off-platform (NA). Chart 1b shows that about half of NDP NDFs are off-platform, with material on-platform activity across D2C, D2D, and single-dealer platforms (SDP).
If the hypothesis is correct that FX IM optimization caused DP NDFs, then these charts suggest that this activity is all off-platform.
By day-by-day activity
Now we look at the day-by-day NDF activity profile for DPs and NDPs in turn. For readability, I have limited the data to a single quarter of activity (Q4 2024) and to seventeen DPs with over $1 billion activity each (totaling 99.6 percent of the DPs NDF activity) and twelve NDPs with over $10 billion activity each (totaling 99.2 percent of the DPs NDF activity).
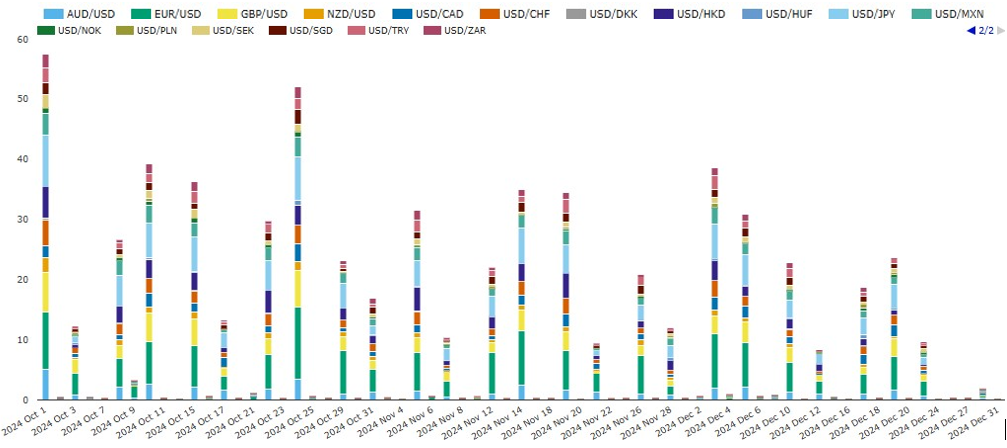
Chart 2a: day-by-day US-reported DP NDFs by currency pair (notional $ billions). Source: SDRView.
Chart 2a shows that DP NDFs execute almost exclusively on Tuesdays and Thursdays (apart from the tail off for the late December holiday period). There is a trickle of activity on other days in EUR/USD, GBP/USD, USD/JPY, and an occasional other pair.
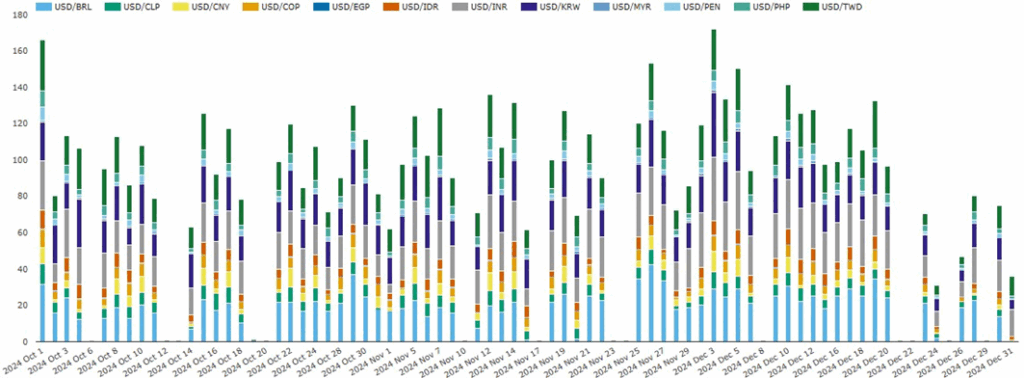
Chart 2b: day-by-day US-reported NDP NDFs by cleared vs uncleared (notional $ billions). Source: CCPView.
Chart 2b shows that NDP NDFs also have increased activity on Tuesdays and Thursdays, but the difference from the other weekdays is much less stark.
To avoid eyeballing dates one-by-one versus a calendar, I exported the data from the preceding SDRView charts, and for the Q4 2024 cleared NDF data from CCPView. Then I used excel to chart by weekday. Note the different scales on each chart.
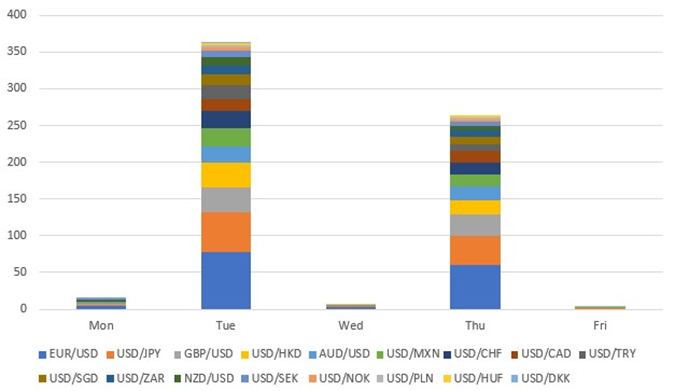
Chart 3a: Q4 2024 SDRView DP NDFs by weekday (notional $ billion).
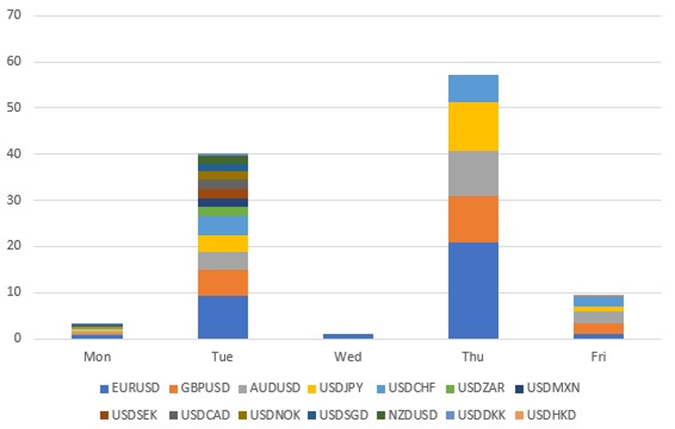
Chart 3b: Q4 2024 CCPView DP cleared NDFs by weekday (notional $ billion).
Charts 3a and 3b show that Q4 2024 DP NDF activity was dominated by Tuesday and Thursday.
- Tuesday had Q4 DP US-reported activity over $350 billion, and cleared activity of $40 billion.
- Thursday had Q4 DP US-reported activity over $250 billion, and cleared activity over $55 billion.
- Thursday activity was limited to 5 pairs: EURUSD, GBPUSD, AUDUSD, USDJPY, and USDCHF.
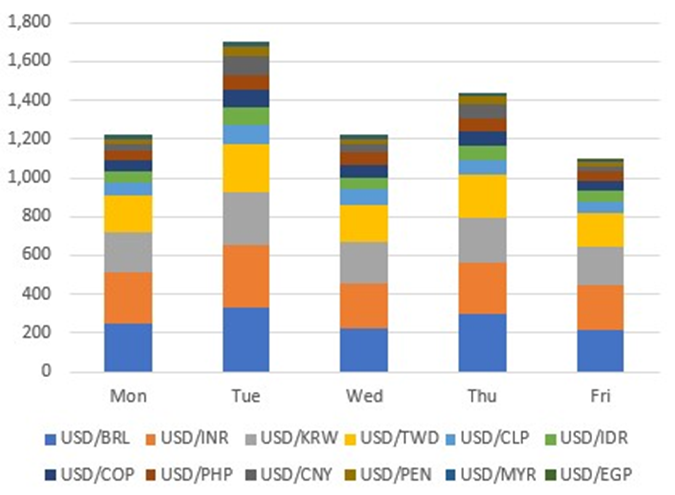
Chart 3c: Q4 2024 SDRView NDP NDFs by weekday (notional $ billion).
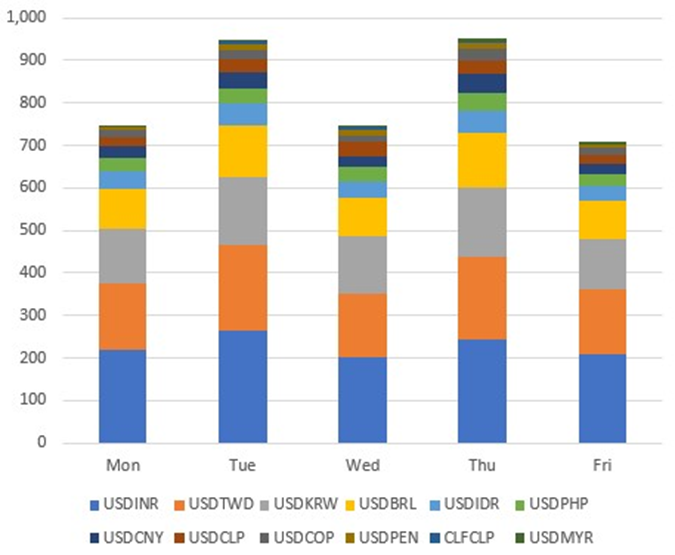
Chart 3d: Q4 2024 CCPView NDP cleared NDFs by weekday (notional $ billion).
Charts 3c and 3d also show Tuesday and Thursday substantially exceeding Monday and Wednesday.
- Tuesday Q4 US-reported NDP activity exceeded by over $400 billion, and cleared activity exceeded by about $200 billion.
- Thursday Q4 US-reported NDP activity exceeded by over $200 billion, and cleared activity exceeded by about $200 billion.
- The same currency pairs were traded every day in about the same proportions.
- Friday is a bit lower volume than Mondays and Wednesday.
If the hypothesis we are testing is true, then FX IM optimization runs happen on Tuesday or Thursday and generate NDFs in both DPs and NDPs. It makes sense that DP NDFs would be used to offset FXO trading-generated risk, and that there is no regular trading volume of DP NDFs. It also makes sense that NDP NDFs would be used to offset NDF trading-generated risk, hence the charts show combined activity from trading and optimization. It makes sense that cleared NDFs are also generated to reduce SIMM FX risk by moving it to clearing.
If you accept the hypothesis, we also have a rough estimate of Q4 2024 US-reported NDFs activity resulting from FX IM optimization runs of over $750 billion for Tuesday, and over $450 billion for Thursday – a total of over $1.2 trillion for the quarter.
Other parameters
Assuming DP NDFs are almost exclusively driven by FX IM optimization trades, we can use DP NDFs activity cut by other parameters as a proxy for FX IM optimization choices.
We start with tenors.
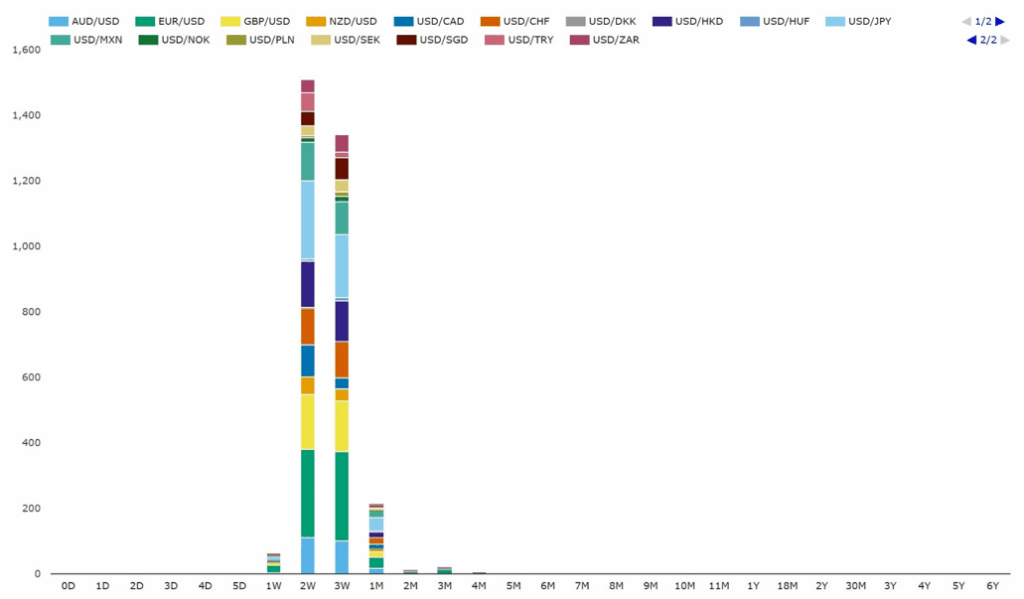
Chart 4a: 2024 US-reported DP NDFs by tenor (notional $ billions). Source: SDRView
Chart 4a shows that:
- DP NDFs in one-week, two-week, three-week, and one-month tenors combined for $3,147 billion (97.9 percent).
- Tenors inside 1W and outside 1M combined were $69 billion (2.1 percent).
By contrast, NDP NDFs break out by tenor as follows.
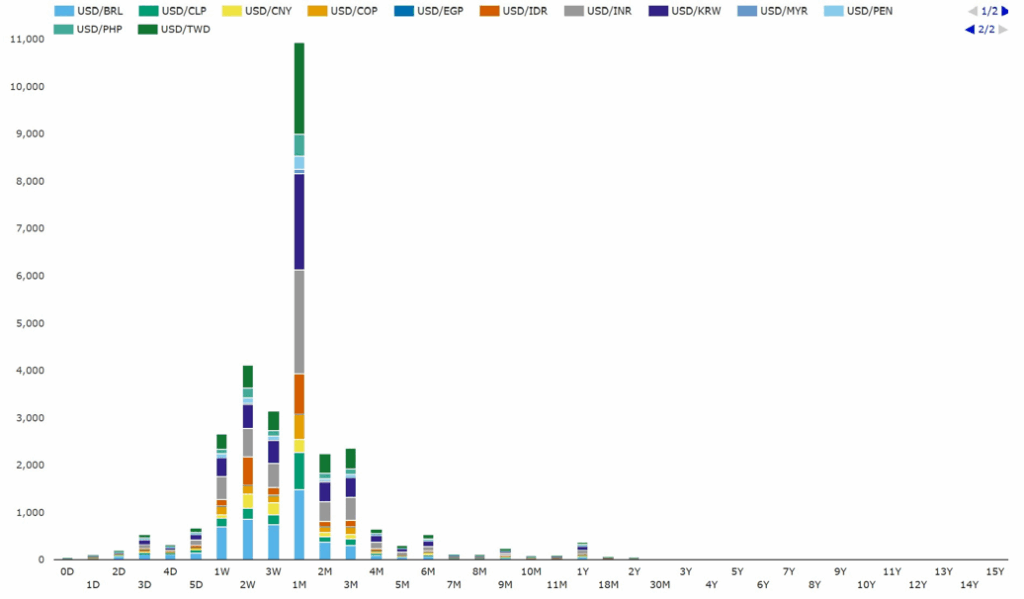
Chart 4b: 2024 US-reported NDP NDFs by tenor (notional $ billions). Source SDRView.
Chart 4b shows that:
- NDP NDFS in the same four tenors as above combined for $21.0 trillion (69.7 percent compared with 97.8 above).
- Two-month and three-month combined were $9.1 trillion (30.1 percent compared with 2.1 percent above).
So, we would infer that FX IM optimization-driven trades are focused on whole weeks up to 1M.
To speed up the reading here, I skip the individual charts per metric, and instead present several metrics – each calculated from an SDRView/CCPView query or two.
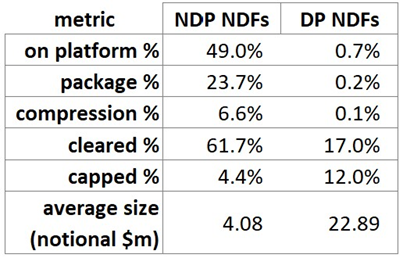
Table 2: Behavior contrast between NDP NDFs and DP NDFs. Source: SDRView, CCPView.
Table 2 allows us to infer that FX IM optimization driven-trades are off-platform, non-package, non-compression trades, which clear at a much lower rate, and are much larger in average size, and therefore are capped more.
Summary
The 2019 blog linked above hypothesized that deliverable pair (NDP) NDFs are almost exclusively driven by FX IM optimization.
If those services normally run on Tuesdays or Thursdays each week, Clarus data are consistent with that hypothesis, and with those services using non-deliverable pair (NDP) NDFs.
If the hypothesis is true, we can roughly estimate that US-reported FX IM optimization-driven volumes were over $1.2 trillion in Q4 2024.
If the hypothesis is true, we can use NDP NDFs as a proxy for FX IM optimization behavior – showing the activity is off-platform, mostly uncleared, and has much larger than average trade size.
Please contact us if you are interested in demonstrations of or subscriptions to or demonstrations of SDRView or CCPView.