- Uncleared Margin Rules (UMR) for IM have now been in place for two and a half years
- The ISDA Margin Survey Year-End 2018 provides a good overview of the regulatory IM received
- $83.8 billion at Dec 31, 2018, up from $73.7 billion at Dec 29, 2017, an increase of 14%
Timeline for Margin Rules
The following diagram from the last page of the ISDA Margin Survey is a nice summary.
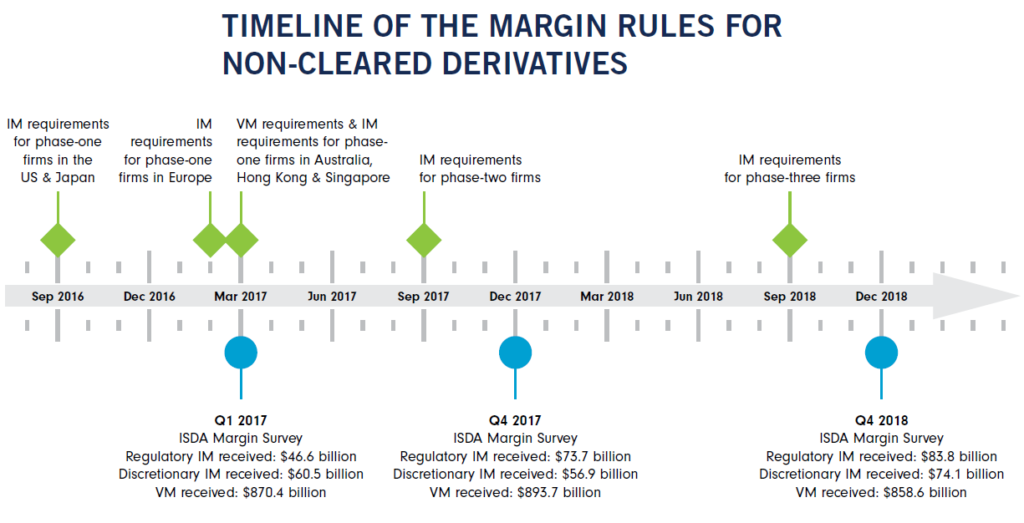
Showing:
- In March 2017, seven months after phase 1 firms in US & Japan implemented IM and one month after phase 1 EU firms, regulatory IM received was $46.6 billion
- This increased to $73.7 billion and $83.8 billion at year-end 2017 and 2018 respectively
- 27 firms were included in the latest survey, all twenty phase 1 firms, four out of six phase 2 firms and three out of eight phase 3 firms, however the figures in the above time-line are for phase 1 firms so as to provide a comparison over the period.
Table of results
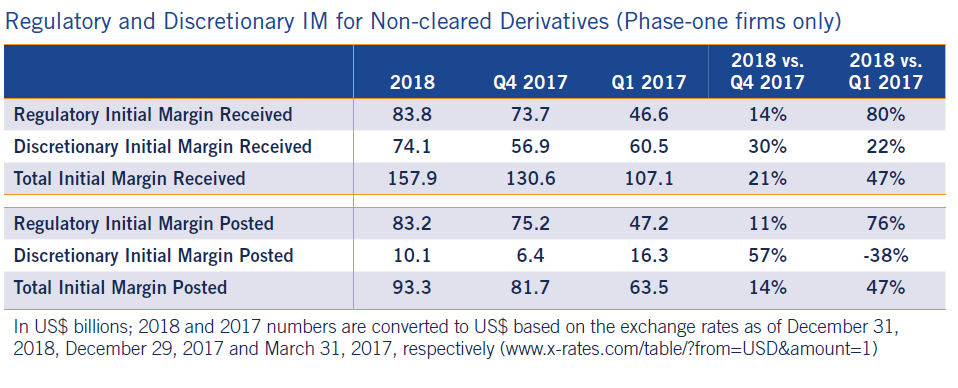
- This shows regulatory IM received as well as discretionary IM (not mandated by regulation), $83.8 billion and $74.1 billion, a total of $157.9 billion at end-2018.
- The total IM posted at end-2018 was only $93.3 billion
- Note that regulatory IM posted is similar to received but discretionary IM posted is a lot lower than discretionary IM received. This is due to the fact that many IM agreements are still one-way with only the dealer receiving IM. Over time as phase 4 & 5 firms are captured by UMR, most of the discretionary IM received amount will go into regulatory IM and the posted IM grand total will be similar to the $157.9 billion.
Phase 2 & 3 firms
In addition to the above figures for phase 1 firms, the ISDA Margin survey details that the four phase 2 firms and three phase 3 firms that participated in the survey, received a total of $4.8 billion of IM, of which $2.2 billion was regulatory and $2.6 billion discretionary.
So far lower than phase 1 firms, reflecting both the much smaller size of their derivatives activity and the shorter time period for their new trades to be included in UMR.
Increase in IM
On the face of it, I am surprised that regulatory IM for phase 1 firms has only increased 14% from $73.7 billion to $83.8 billion over the year. As a comparison IM for Cleared IRS & CDS for major CCPs as reported in the ISDA document, increased from $194 billion to $218 billion over the same period, an increase of 12%.
Intuitively I would have expected a greater percentage increase in the uncleared IM, given that more and more new trades are captured for phase 1 firms and as phase 2 & 3 firms are also included.
Granted we have noted in the past that UMR rules have also acted as an incentive for increased clearing and so acted to dampen growth in bi-lateral volumes for some products.
$800 billion
Those of you with long memories on UMR may recall a 2012 ISDA estimate that non-cleared margin could be reduced to $800 billion with a $50 million threshold, as opposed to an estimate of $1.7 trillion for internal models with zero threshold and $10 trillion with a standard model.
I covered this in my Sep 2017 and Sep 2016 articles and noted in the former that $800 billion IM total seemed too high as an estimate. Long range forecasting is notoriously difficult and only with hindsight do counter affects such as increased clearing become apparent.
If we assume that all the current discretionary IM will become regulatory IM, then as of Dec 31, 2018 there is a total of $158 billion of IM required for bi-lateral derivatives exposure. (In an earlier version of this blog, I had doubled this to add in the posted collateral, but that now seems a mistake as would be double counting because one firms received is another firms posted).
So the question then is what will this $158 billion number get to in Sep 2021, one-year after phase 5 firms are captured and what will be the steady state.
That is a difficult one to answer, more detail on the phase 1 firm regulatory IM make-up would help. For instance how much of this IM is in each product class ( RatesFX, Credit, Equity, Commodity) and the average maturity of the trades in these, to allow a comparison with the legacy book as more and more of this is turned over, until it is entirely replaced by trades include in IM. (Perhaps this detail should be a consideration for the 2019 Margin Survey).
The other effect is of-course the new firms captured in phase 4 and particularly phase 5, estimated by ISDA to be approximately 1,100. And it is not so much their individual exposures but the gross-up effect of so many relationships between phase 5 firms and earlier phases, estmated by ISDA to be > 9,000.
An Estimate
In my Sep 2016 article, I came up with a $650 billion estimate for Total IM, while in my Sep 2017 article I was not brave enough to put forward a new estimate.
Now with the latest ISDA Margin Survey and the figure above of $158 billion, I find it hard to imagine that Total Uncleared IM will reach $650 billion in it’s steady state.
Lets be brave and put a nice round figure of $500 billion on it by end 2022.
However even that seems on the high side to me. One only has to read about IM Optimisation to realise that the market is innovative and will come up with solutions to mitigate IM growth.
Any takers willing to bet on less than $400 billion as the steady state?
$350 billion?
That’s it
That is all I have time for today.
I do recommend you read the full ISDA Margin Survey, as it covers much more detail, including the composition of collateral, variation margin and cleared margin.