- ISDA SIMM is the industry standard for calculating Initial Margin on non-cleared derivatives
- The Clarus Microservices API makes it very easy to compute ISDA SIMM™ from Python
- What-if trades can be easily added to determine the incremental change in SIMM Margin
- Before and after SIMM Margin levels can be easily displayed in charts and tables
- CRIF format risk sensitivties can be generated
- Our Browser Sandbox allows you to try yourself before moving to Python on your own computer
Introduction
The International Swaps and Derivatives Association, Inc, launched the Standard Initial Margin Requirement in September 2016 after the release of the margin rules for non-cleared derivatives.
More commonly know as ISDA SIMM, its aim is to encourage market participants to use a single, standard methodology to calculate collateral requirements on non-cleared derivatives.
It has become the industry standard for calculating initial margin on non-cleared derivatives.
ISDA SIMM has been reviewed and upgraded four times since its launch. ISDA SIMM 2.0 is the fourth and latest version, which includes a number of updates to further improve the methodology. (See: ISDA SIMM 2.0 – What You Need to Know).
In this blog, we will show you a few examples of how easy and fast it is to calulcate ISDA SIMM from the Clarus Microservices API, and display the outputs in python dashboards.
Calculate SIMM Margin from trades
In our first example, we will generate CRIF format risk sensitivities using a single trade, and then calculate its SIMM Margin.
The ISDA SIMM model requires specific risk factor sensitivities. The Clarus API calculates these risk factor sensitivities and outputs the results in the ISDA Common Risk Interchange Format (CRIF).
CRIF is a file type in a format which the SIMM model requires in order to calculate Initial Margin.
response = clarus.simm.sensitivity(trades='Buy 500m USDJPY 2m 113')
print(response)
In the above code, we call the simm.sensitivity clarus API function on the trade passed in the trades parameter.
We use a trade in the Clarus QuickTrade format, which is a natural language way to represent a trade.
This returns us the below output in the ISDA CRIF format:
RiskType    Qualifier Bucket Label1 Label2     Amount    AmountCurrency   AmountUSD   ProductClass PortfolioID ValuationDate
Risk_IRCurve   USD      1       1m     OIS     -4356.63      USD           -4356.62      RatesFX       Adhoc     2018-07-18
Risk_IRCurve   USD      1       3m     OIS     -4501.85      USD           -4501.84      RatesFX       Adhoc     2018-07-18
Risk_IRCurve   JPY      2       1m     OIS    494046.24      JPY            4379.42      RatesFX       Adhoc     2018-07-18
Risk_IRCurve   JPY      2       3m     OIS    510514.45      JPY             4525.4      RatesFX       Adhoc     2018-07-18
Risk_FX        USD                            4982910.74     USD         4982910.74      RatesFX       Adhoc     2018-07-18
Risk_FX        JPY                        -5.6506538535E8    JPY         -5008963.6      RatesFX       Adhoc     2018-07-18
To calculate ISDA SIMM margin on this, we simply pass the above response to the portfolios parameter in the simm.margin API function:
response_margin = clarus.simm.margin(portfolios=response.text)
print(response_margin)
This gives us the ISDA SIMM Margin below.
SIMM         Margin
Adhoc      41771709
Margin     41771709
To convert this into a Dashboard display, we want to pass this output to an alert panel in a dashboard.
alert_panel = ui.Alert(message='{:,.0f}'.format(response_margin.total), title='SIMM Margin', icon='exchange', iconsize='lg', iconColour='Red')
dashboard = ui.Dashboard(alert_panel, style=ui.DarkStyle())
print(dashboard)
We set our parameters in the alert panel, which include the title, the icon, and the icon size and colour.
We then pass the alert panel to a Dashboard with the style set to a dark theme.
This gives us the below:

With just single lines of python code we were able to generate the CRIF format, calculate SIMM Margin on the output, and pass it into a panel display.
Calculate SIMM and Whatif SIMM on a CRIF File
The Clarus API also allows us to calculate SIMM by using our own CRIF file.
When using your own CRIF file, make sure to include the standard ISDA header names.
In this example, we will calculate SIMM Margin on a CRIF file which includes several Counter Parties.
We will then create a python dashboard displaying SIMM Margin with a what-if analysis.
response = clarus.simm.margin(portfolios=clarus.read('CRIF2.txt'), whatif='buy 100m USDKRW 2m')
The python code above is calling the Clarus API simm.margin function to calculate SIMM margin on our CRIF file, which we pass into the clarus.read function in the portfolios parameter.
To perform a what-if analysis, we pass in a trade in the whatif parameter to see what incremental change/impact it has on the SIMM margin level.
This gives us the below output grid:
SIMM          Account      WhatIf      Change       Margin
BankA        23653298     8223211        6881     23660179
BankBC       37798493     8223211     4995402     42793894
BankDEF       7665667     8223211     7858000     15523667
BankNO       10133395     8223211     7638869     17772264
BankP        64060317     8223211    -2428107     61632210
Margin      143311170    41116055    18071044    161382213
In the next few steps we will pass this response to a Table and Charts in a Dashboard.
First, we will construct a Table:
table = ui.Table(response, cssClass='table-inverse', headerColour='Green')
table.set_column_header_colour(2,'#d9534f')
table.set_column_header_colour(3,'#d9534f')
table.set_column_header_colour(4,'#d9534f')

dashboard = ui.Dashboard(table, style=ui.DarkStyle(), header='What-If Trade against Counter Parties')
print(dashboard)
All we are doing in the above few lines of python code is inserting the response object to the ui.Table function, to which we set the table-inverse style and the header colour to green in the parameters.
However, we want to differentiate SIMM Margin before and after what-if trade so in the next few lines we set a red colour to the last three table headers, which identify the impact of the what-if trade on the SIMM Margin.
This gives us the below:
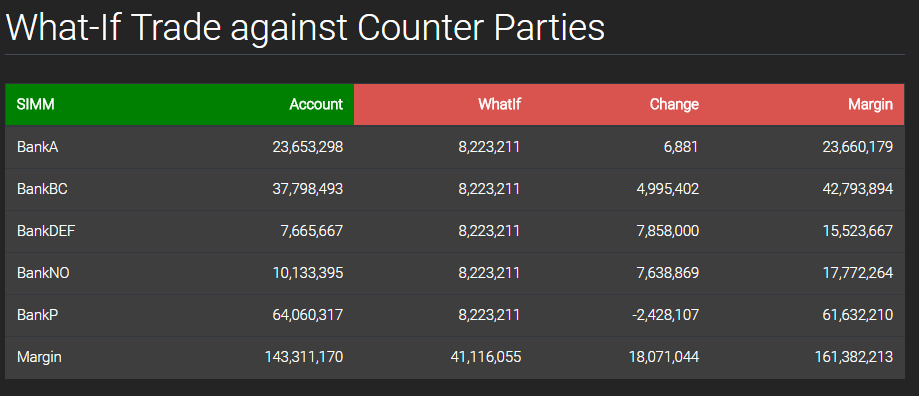
The above few lines of simple python code have created a nice display of the API response grid and we can see clearly that trading with BankP actually decreases our portfolio, so all else being equal (price, cost, available limit) we should do this trade with BankP.
Next, using the response output, we build the Donut charts.
donut_chart = ui.DonutChart(response, excludeRows='Margin', colFilter='Account', title='SIMM by Cptys', colours='Greens')
donut_chart_after = ui.DonutChart(response, excludeRows='Margin', colFilter='Margin', title='SIMM by Cptys', colours='Reds')

dashboard = ui.Dashboard([donut_chart,donut_chart_after], style=ui.DarkStyle(), header='SIMM Margin by Counter Parties')
print(dashboard)
In the first Donut chart we want to display the SIMM margin before what-if trade, so we insert the ‘Account’ column from the response grid in the colFilter parameter.
In the second Donut chart we want to display SIMM Margin after what-if trade, so we insert the ‘Margin’ column in the colFilter parameter, which represents SIMM Margin after what-if trade.
To distinguish between the two charts, we also set the colours parameter to Greens for the first chart and Reds for the second.
We then insert these in a Dashboard, side by side, and Print to get the below:
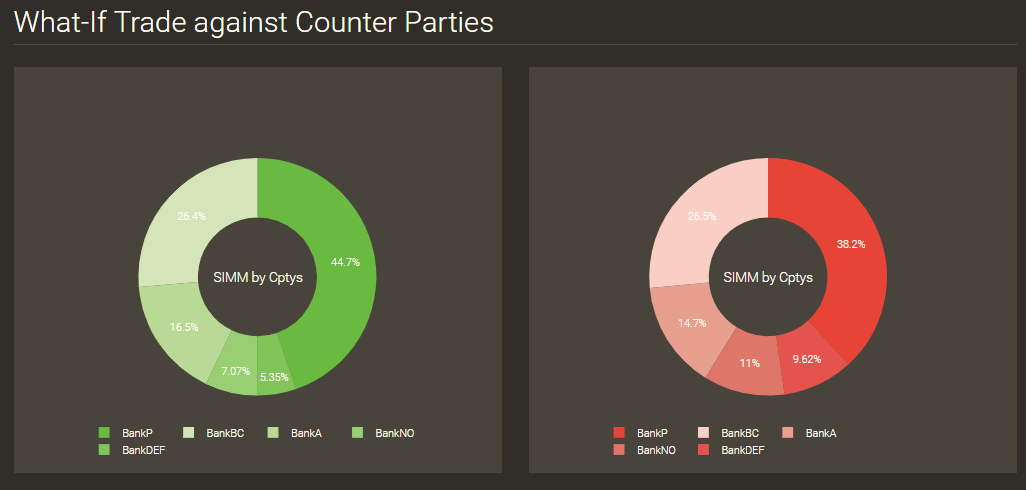
Again we can see clearly that trading with BankP would be most optimal as it has lead to a reduction in Margin level from 44.7% to 38.2%.
Alternatively, we can create a Dashboard with both the Table and the Donut Charts.
dashboard = ui.Dashboard(table, [donut_chart,donut_chart_after], style=ui.DarkStyle(), header='SIMM Margin by Counter Parties')
print(dashboard)
Which would look like this:
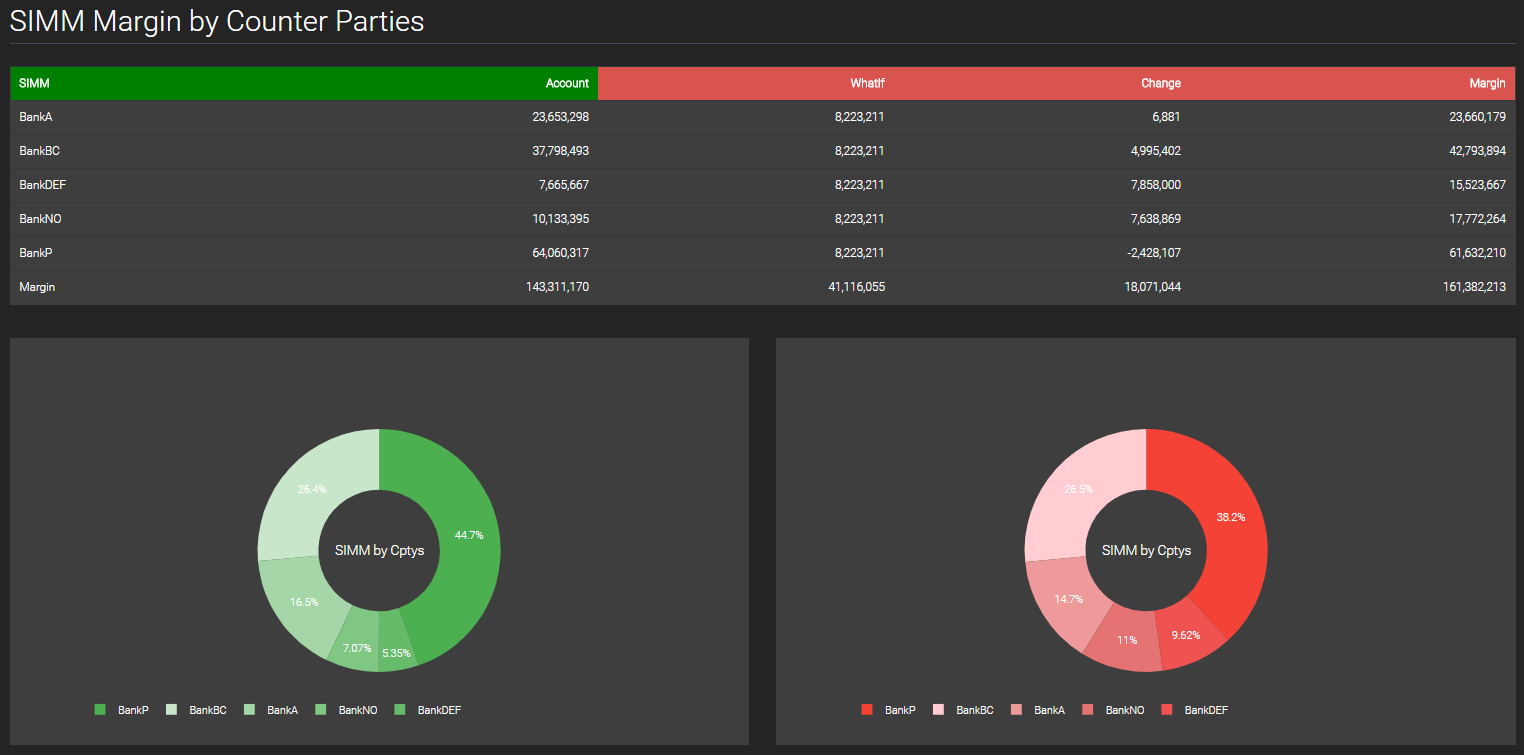
(click on image to zoom)
Clarus Dashboards allow you to make visual comparisons easily with just a few lines of python code!
The above dashboard allows you to easily identify the incremental change in SIMM Margin from the what-if trade on each counter party and identifies which counter party would be most optimal to trade with.
SIMM Margin Impact of par swaps of specified dv01 size
Clarus API simm.impact function also allows us to see the impact on our margin in standard risk sizes.
response = clarus.simm.impact(portfolios=clarus.read('CRIF.txt'), parSwapTenors='5Y,10Y,30Y')
bar_chart = ui.BarChart(response, colours='Purples')
dashboard = ui.Dashboard(bar_chart , style=ui.DarkStyle(), header='SIMM Marginal Impact of USD par swap of specified tenors')
print(dashboard)
We call the clarus simm.impact API function on our CRIF file, and input three major tenors in the parSwapTenors parameter.
The Dashboard below shows this for USD Libor Swaps in 50k DV01 for the major tenors 5Y, 10Y and 30Y.
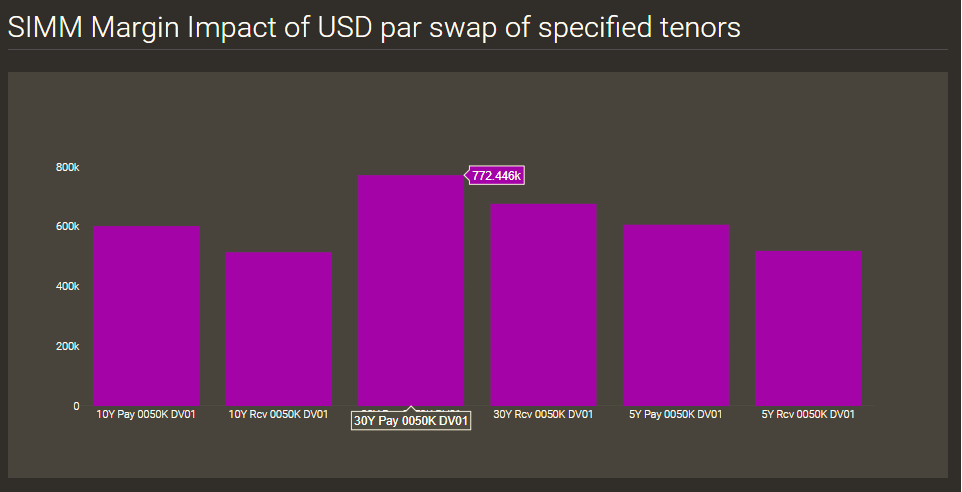
The bar chart shows that the 30Y tenor has the largest SIMM Margin change.
Hovering over each Bar displays the exact value at that point.
Comparing SIMM versions
In this example we compare the different versions of ISDA SIMM with a Bar Chart.
Clarus API supports all versions of the SIMM methodology and enables you to compare SIMM Margin in different version.
response = clarus.simm.margin(portfolios=clarus.read('CRIFEquity.txt'), version='Compare')
bar_chart = ui.BarChart(response, colours='Blues', xlabel='SIMM version', ylabel='SIMM Margin')
dashboard = ui.Dashboard(bar_chart, style=ui.DarkStyle(), header='Comparison of SIMM versions')
print(dashboard)
To get SIMM Margin for all version, we input ‘Compare’ in the version parameter in the simm.margin API function.
This is then passed into a Bar Chart and Dashboard to give us the below:
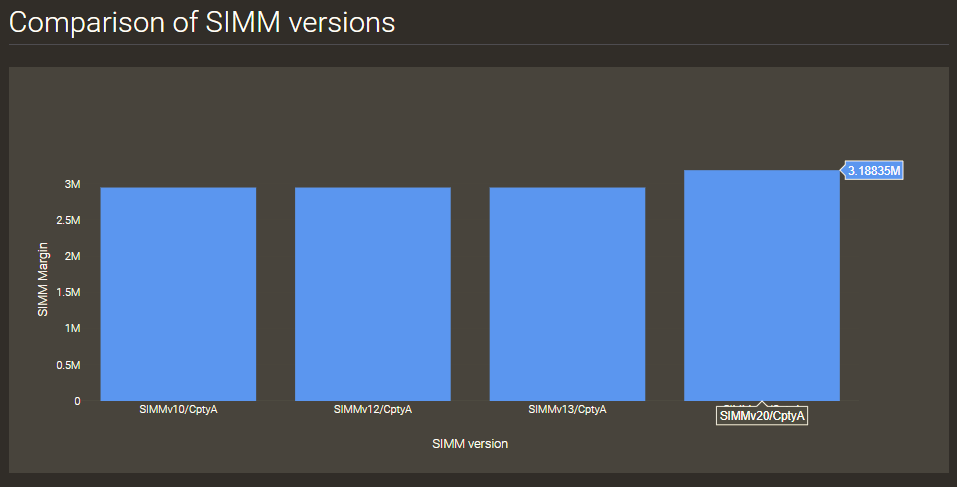
The Bar Chart gives a quick and easy comparison between the models.
It shows that SIMM version 2.0 has a slightly higher margin than the prior versions.
Try it Yourself
It is really easy for you to try the above examples yourself.
We provide Clarus python packages to make it convenient to call the Clarus API.
First you need to register for a free trial account here.
(Only for potential customers, no vendors please).
When you have been authorised, login and try out the examples above.
The Clarus API Reference Page allows you to try out the examples within a Sandbox environment, before installing on your computer.