A client recently asked us if we had ever calculated our RFR Adoption Indicators for individual CCPs. The answer was a surprising “No” so I thought I should rectify that in today’s blog.
This was somewhat motivated by this Risk.net story on JPY this week. The story highlights how different CCP market shares are at different maturities in JPY IRS. For example, CCPView shows that JSCC has a larger market share in 10Y and 30Y tenors:
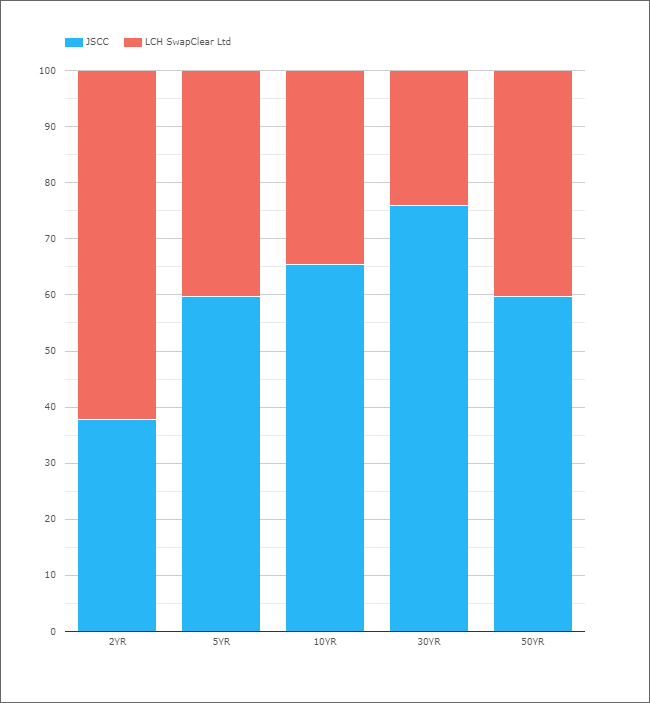
Showing;
- DV01-weighted market share per tenor bucket for Q1 2021 in JPY swaps.
- JSCC has a 38% share in 2Y swaps.
- This increases to 60% in 5Y.
- And to 65% and 75% in 10Y and 30Y.
- 50Y is bizarrely more like the 5Y split (I expected it to be closely aligned with the 30Y market share), with LCH seeing a market share of 40%.
JPY TONA
JPY TONA trading has been extremely slow to take-off. The RFR Adoption Indicator in JPY was just 2.4% in March 2021.
Whilst there is only a relatively small amount of JPY TONA risk traded, there IS activity across the whole curve. For example, of the TONA risk that is traded, nearly 80% of it is in tenors longer than 2 years:
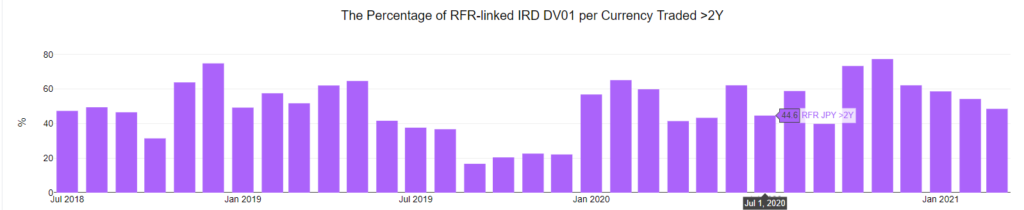
This chart looks only at TONA risk. There is no LIBOR or TIBOR risk on this chart. It is only the proportion of TONA risk that is traded in tenors longer than 2 years. Hope that is clear….it is resolutely NOT saying that up to 80% of all JPY risk longer than 2 years is executed as TONA. This should be evident if we consider that the overall RFR adoption indicator for JPY lies at just 2.4%.
JSCC RFR Adoption Indicator
With JSCC exclusively clearing JPY-denominated products, and clearing just over half of the market, what is the RFR Adoption Indicator for this CCP?
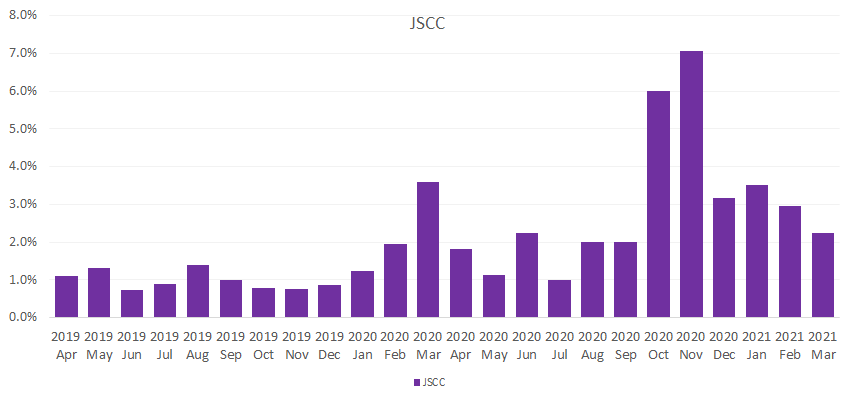
Showing;
- March 2021 saw JSCC with a 2.2% RFR Adoption Rate.
- This means that just 2.2% of all JPY risk, as measured by DV01, was executed as TONA.
- This is entirely consistent with the overall market.
- JSCC did see some significant increase in TONA trading during October and November 2020, where 6-7% of the JSCC volumes were transacted versus TONA. This was somewhat higher than the overall 4.5-5% seen in the market, and so suggests it was a uniquely JSCC effect (i.e. we likely did not see the same increases at LCH).
On this first evidence it looks like the RFR Adoption Indicator for a specific currency at a specific CCP looks almost identical to the overall market – even when there exist a difference in maturity profiles at the two CCPs. That is not necessarily what I expected to see.
CME RFR Adoption Indicator
Having looked at JPY, let’s now look at USD. What does the RFR Adoption Indicator look like for swap (OTC) products at CME?
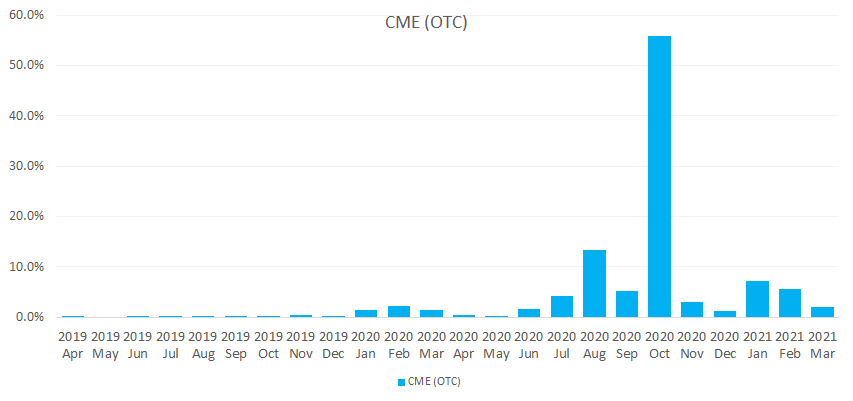
Readers should be aware that over 98% of risk across the six currencies (USD, EUR, JPY, GBP, AUD and CHF) traded at CME each month is USD denominated. Therefore, we would naturally expect the CME chart to look a lot like the USD SOFR RFR Adoption chart below:
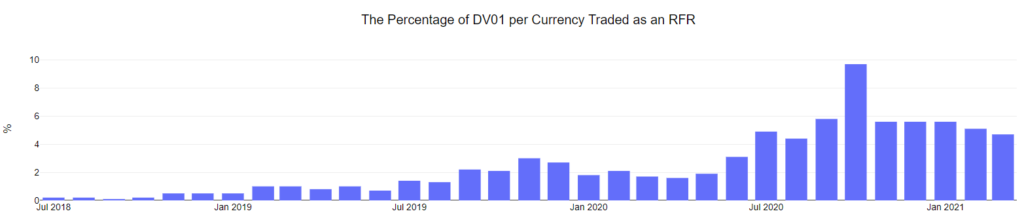
Spot any differences?!
- Wow that spike in October 2020 at CME was pronounced! Our data has not previously highlighted that 56% of CME risk in October 2020 was in SOFR!
- However, that was mainly a one off. There is no particular pattern for the adoption of RFRs at CME – some months, more of the CME risk has traded versus an RFR (e.g. 7.3% in January 2021) and some months less (e.g. March 2021 with 2.1%).
In Summary
- The adoption of RFRs appears to be homogeneous across CCPs.
- The proportion of risk traded as TONA at JSCC is very similar to the overall market.
- The proportion of risk traded as SOFR at CME is somewhat similar to the overall market.
- There can be specific events, such as the discounting switch from Fed Funds to SOFR, that cause differences in particular time periods.
- CCPView makes it simple to run these comparisons, with DV01 analytics included in all subscriptions.