A lack of market volatility didn’t prevent healthy volumes this month. CCP Basis trading emerged in the D2D market. In USD IRS, extensive activity in Butterflies led to a rebound in volumes from the April lows. Most of this increase was seen on Dealer to Client SEFs, helping them to a 55% market share year-to-date.
USD On-SEF Activity
Let’s get straight into it and look at USD IRS On-SEF Volumes this month. First from SDRView:
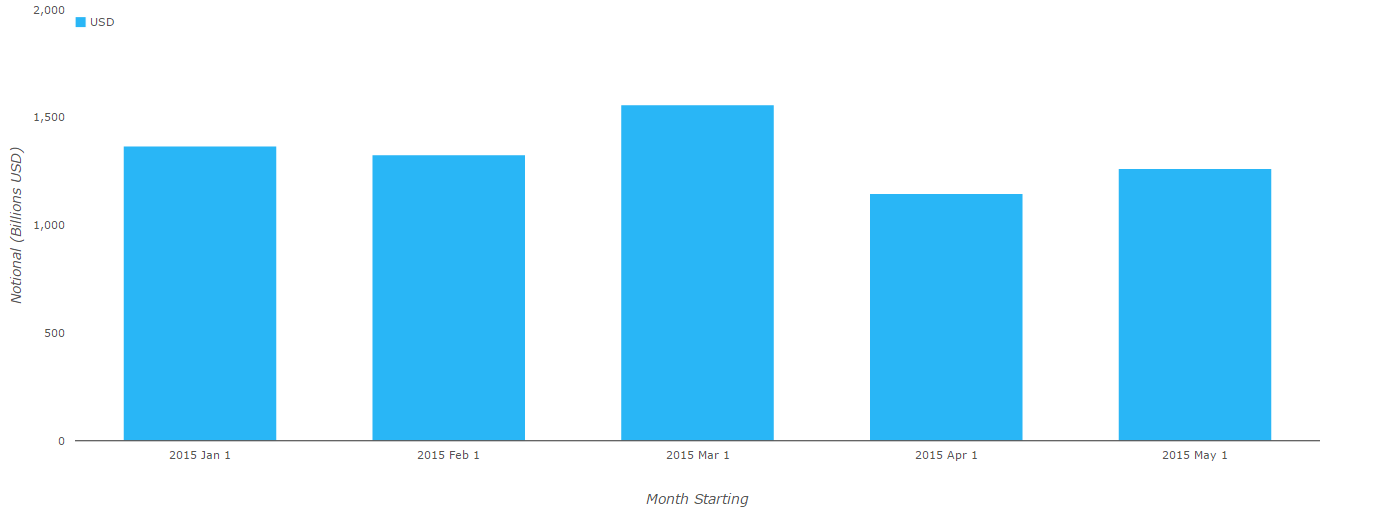
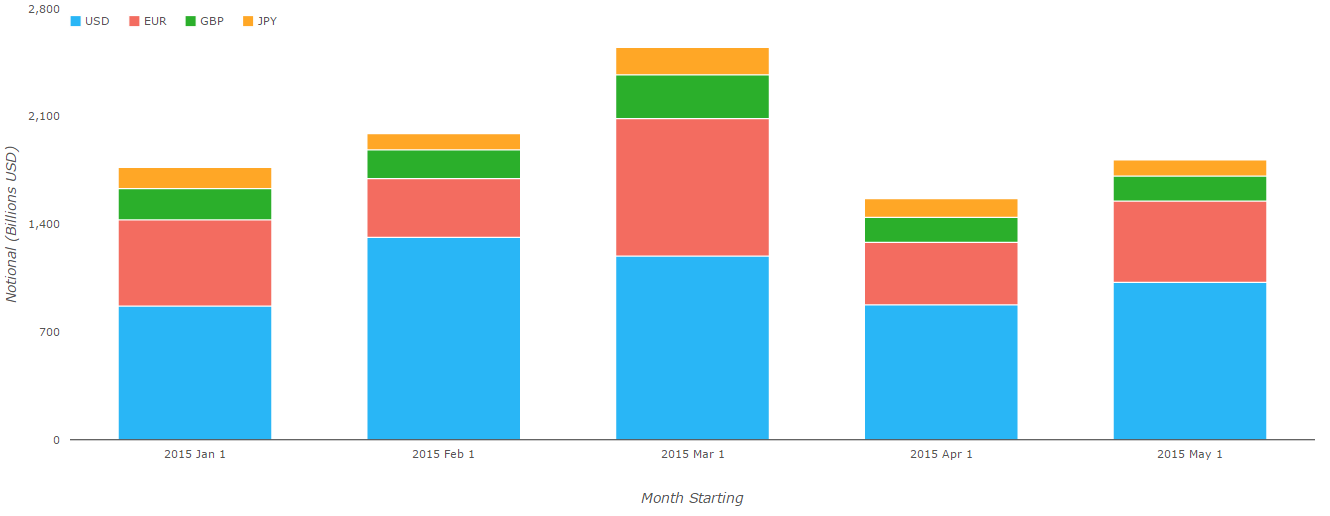
This makes May look like a fairly average month. However, take a look at the chart from SEFView instead. Remember that SEFView does not cap the notional of block trades, and as a result we see a markedly different story:
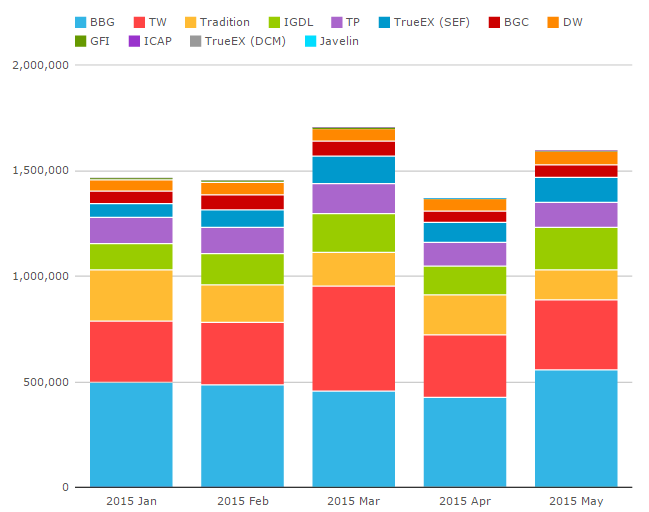 Showing that May has been the highest volume month so far of any in 2015, excluding March which was an IMM roll month. Interesting. We will see further down that there are a number of different reasons for these healthy volumes. But we can state here that this means more volume has gone through as part of block trades than has typically happened during 2015.
Volume by Product Type
It is worth considering just what types of trade we have seen this month. The SDRView chart on the right shows the following splits:
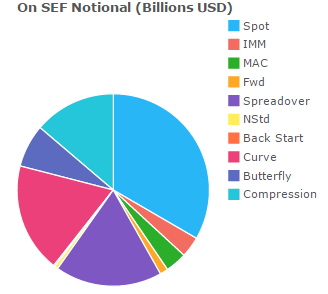
By Notional, for USD Swaps traded on-SEF this month we saw:
- 33.4% spot-starting outrights
- 18.4% curve trades (“maturity switches”)
- 18.0% spreadovers (vs UST)
- 13.8% compression
- 7.2% butterflies
- IMM, MAC, Back Start and Non-Standard structures make up the remaining 9.2%.
When we also look at these volumes by product type as a time-series, we see that Butterflies had their highest ever recorded month, as per the SDRView chart on the right. This probably helps explain the discrepancy between SDRView and SEFView notionals this month, as butterflies are far more likely to be traded above block size.
SDRView Pro allows us to see exactly which butterflies traded in the month. Looking at the DV01 traded in the belly, we see that 5y7y10y was the most traded butterfly:
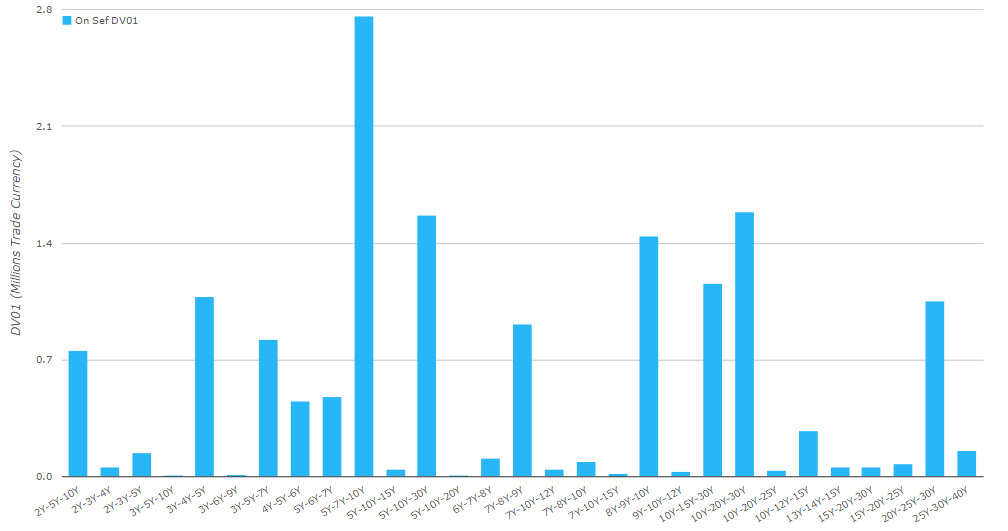 I think this is a really cool chart! It shows that:
- Long-end flies were active, including 10y15y30y, 10y20y30y and 20y25y30y.
- 2y5y10y did not trade in significant amounts.
- A fair number of 1y gaps traded: 2y3y4y, 3y4y5y, 4y5y6y, 5y6y7y, 6y7y8y, 7y8y9y, 8y9y10y, 13y14y15y.
Market Moves May 2015
It seems that we can relate the popularity of Butterfly structures directly back to the price-action (or lack there-of) during the month. SDRFix shows that Rates moved a mere 1bp higher in 5 years, with a marked steepening on the curve:
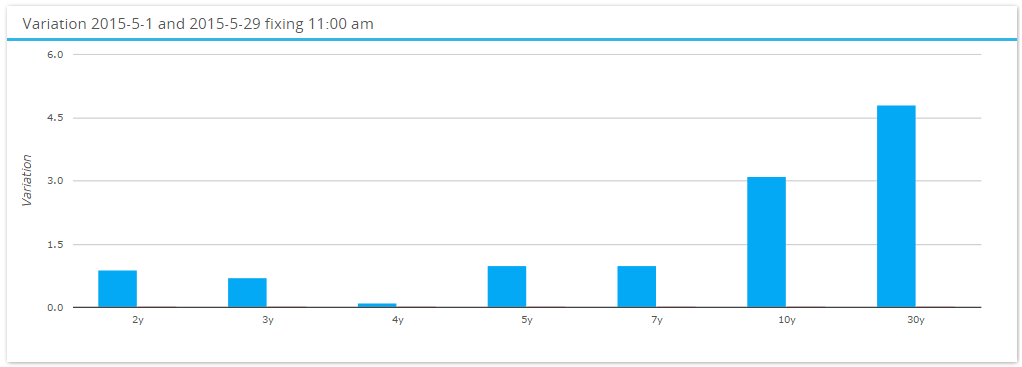
With price-action this dull, it would appear that traders across the Rates complex took the opportunity to tidy-up positions and hedge risks that may otherwise get ignored in more volatile markets.
CCPView
Whilst this lack of market volatility did not negatively impact IRS in USD, it looks like other currencies did not fare quite so well. CCPView shows the entire market for Centrally Cleared Rates products. We see that May was a below-par month compared to 2015 so far.
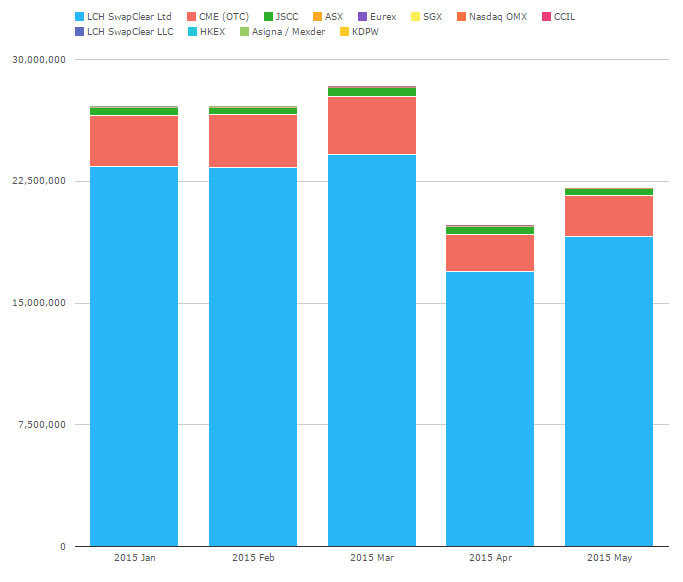
To save you the bother, I took a quick look at the above chart by currency, and it is fair to say that whilst USD volumes have been consistent this year, EUR IRS suffered a large dip in volumes during April which has been slow to rebound in May. It is hardly surprising (or news) that the long-awaited initiation of QE in Europe led to strong trading volumes during the traditionally busy Q1 period. These volumes are yet to be matched again this year.
CCP Basis Volumes
A theme to markets this month has been the emerging Basis differential between CCPs – particularly in USD Swaps between CME and LCH. Clarus have been on top of this from the start of the month, and our 3 blogs on the subject during May saw considerable interest from a variety of market participants. Please read Amir’s first blog if you would like further background on these trades.
Updating our volumes since Amir last reported, we see the following for TradX and Tulletts:
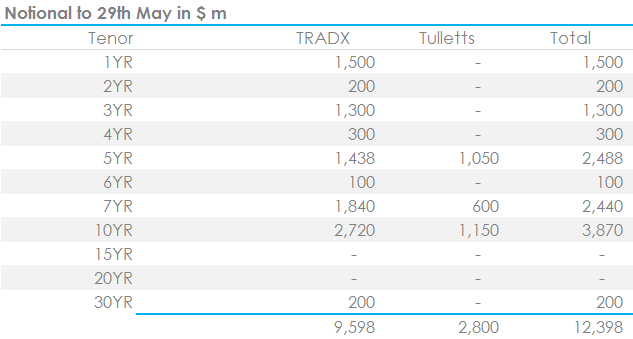
Interestingly, these TradX volumes are actually lower than for April, which saw them trade nearly $13bn. However, that April number was hugely skewed by the last 3 trading days of the month, highlighting what a recent phenomenon these structures are.
Outside of our SEFView figures, I understand that ICAP have traded approximately $14bn in notional since the start of April. So it would appear that TradX enjoy around a 57% market share at the moment.
Off-SEF Swap Activity
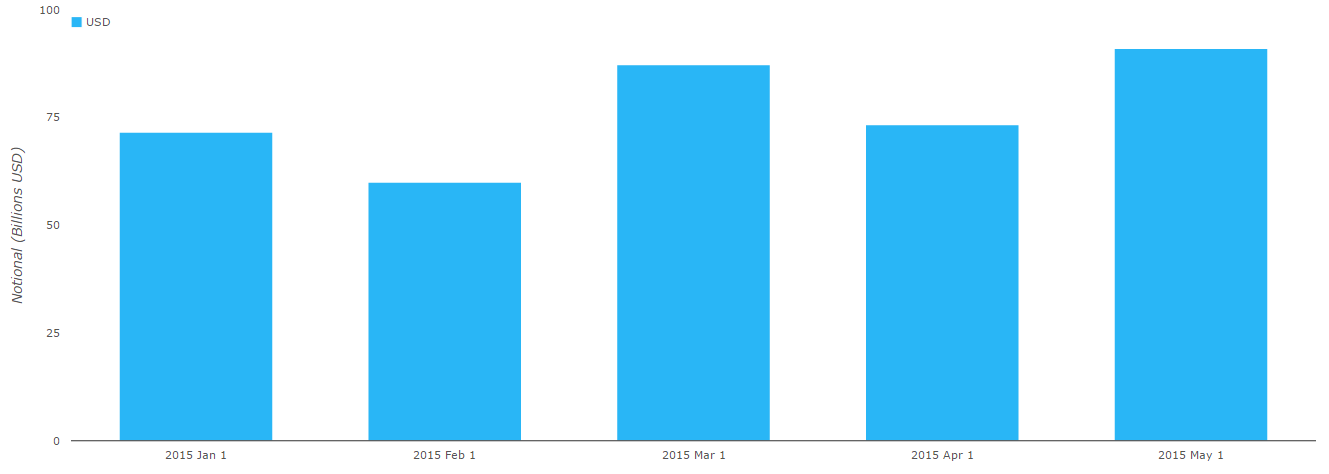
 Although over 60.7% of all USD Risk was traded on-SEF, this does mean that there continues to be a significant volume of trades executed off-SEF each month, as the chart to the right shows.
Just as we did with on-SEF volumes, we can analyse these numbers further to get a feeling for what structures are trading. But for the sake of brevity, I’ll have to leave that for our users to explore.
SEF Volumes
Revisiting the same numbers we have used for March and April, SEFView shows the market share across EUR, USD and GBP in DV01 terms (excluding FRAs):
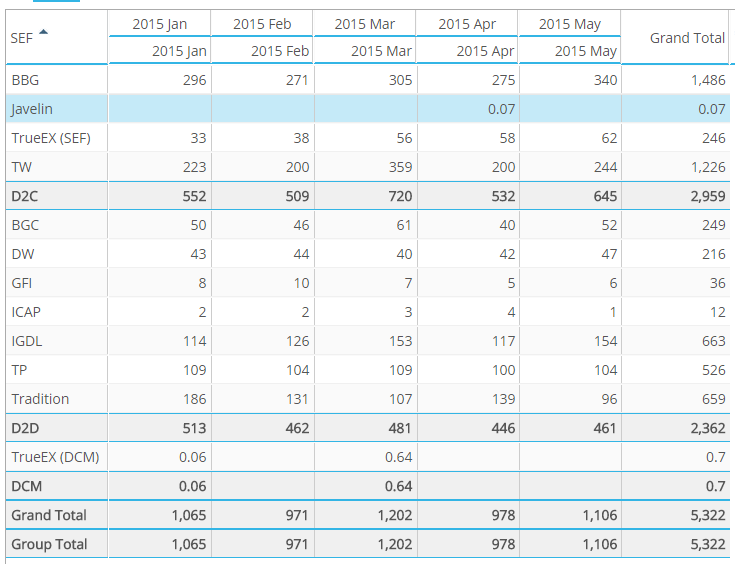
What is immediately noticeable is the big increase in Dealer to Customer business during May. The D2C SEF’s enjoyed a 21% increase in business last month, whilst the D2D business could only muster a 3% pick-up. That means during 2015, 55% of volumes have been conducted via D2C markets.
What is going on here? My assumption in the past month has been that due to lower volatility, the banks have been happier to leave client business unhedged and wait for the other side to come up on an RFQ. One day we’ll be able to tell that kind of thing when hedging is automated via CLOBs….for now, this seems like a straight-forward assumption to make.
Or is it down to Compression on D2C SEFs?
SEF Compression
So let’s take a look at compression volumes for May:
- Bloomberg compressed $19m in DV01, vs $16m in April.
- TrueEx compressed $61m in DV01, a new high for them. This was, in part, driven by an impressive increase in non-USD currencies, with $13.8m compressed in EUR and GBP.
- We still do not have exact figures for Tradeweb. Using the assumptions we have come to rely upon, we estimate $112m in DV01 compressed across the three currencies. This gives them a 58% market share in May for Compression activity.
SEF Market Share ex-Compression
And so we conclude by taking a look at SEF Market Share with figures that allow for fair comparisons to be made. The table below shows the DV01 traded (in $ millions) on each SEF, both including and excluding compression:
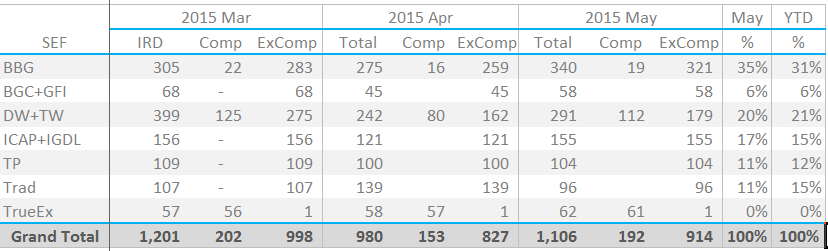
As I like to think of it, the true picture of liquidity at each SEF excludes both compression and FRA volumes. On this basis we see that:
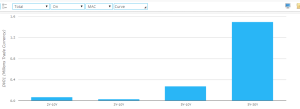 BBG continue to do well. A 35% market share in May was above their YTD average. They saw some particularly large trades going through in unusual structures. For example, SDRView Pro shows 5y30y MAC spreads traded in nearly $1.5m DV01:

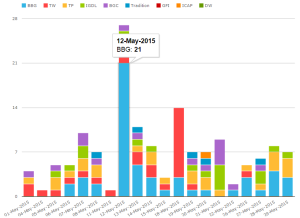 BBG had some particularly large days in MAC swaps, with 12th May being the largest single day, as the SEFView chart on the right highlights.

- Tradeweb are second, with May running in-line with their YTD average around 21%
- ICAP had a good month.
- Trads were surprisingly below their YTD average, despite a healthy portion of CCP Basis business. Perhaps the preponderance of butterfly trading did not suit their franchise?
In Summary
Overall, even excluding Compression volumes, D2C SEFs enjoyed a 19% increase in volumes during May 2015. This wasn’t mirrored in the D2D space, which in many ways is surprising. The lack of market volatility may explain this, but it is surprising that neither CCP basis nor the size of block trades were able to make-up for the reduction in outright market activity.
The amount of activity in butterflies this month, coupled with the disparity between SDR-reported volumes and SEF-reported volumes, leads us to believe that customers were active in large curve trades. The data further tells us that these large trades, with a focus on the longer-end of the curve, were predominantly transacted across Dealer to Customer platforms.