As Jan 3, 2018 is now just three months away, I wanted to update my February 2016 article MiFID II and Transparency for Bonds, in particular as ESMA have now published Transparency Calculations and compare these to transparency in the US Corporate Bond market with FINRA TRACE.
Background
Post-trade transparency and pre-trade transparency for Bonds is meant to establish a level playing field so that price discovery of a particular financial instrument is not impaired by fragmentation on liquidity.
Trading Venues and Investment firms are required to make data public in as close to real-time as possible and within a maximum of 15 minutes from execution, dropping to 5 mins after Jan 1, 2020.
A time deferral of two business days is available for post-trade disclosures for bonds which do not have a Liquid Market (LM) or are Large in Scale (LIS) compared to normal market size or above a Size Specific to the Instrument (SSTI) trading on a venue.
Pre-trade disclosure (bid, offers, depth, quotes) is not required for bonds which do not have a LM or are LIS or SSTI. (Three new acronyms we now need to know. 🙂 )
UPDATE: National Competent Authorities (NCAs) have the discretion to extend the deferral from two business days to four weeks and at the time of going to press, out of 27 EU Countries, only Denmark had not done this.
Liquid Market
The Liquid Market assessment of individual bonds is not currently available from ESMA, but will be published by Dec 1, 2017. These will apply from Jan 3, 2018 to May 15, 2018 after which they will be updated quarterly.
The Criteria for this assessment is available and includes an average daily notional amount of >= €100,000, an average daily number of trades >= 2, percentage of days traded over the quarterly period >= 80% and issuance size thresholds based on the type of bond.
For more detail see the Liquid Market section in MiFID II and Transparency for Bonds.
Transparency Calculations
ESMA has recently published Transitional Transparency Calculations (TTC) for Bonds using data from 2016 trading activity provided by trading venues, which will apply from Jan 3, 2018 to May 31, 2019.
The TTC for Bonds are as follows:
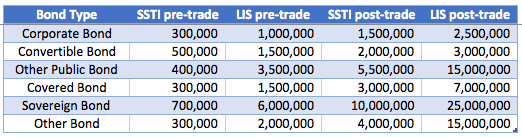
So for a Corporate Bond the LIS pre-trade threshold is €1m and post-trade is €2.5m, while for a Sovereign Bond it is €6m and €25m respectively.
The trade percentiles used to determine these are 60%, 70%, 80% and 90% (from left to right in the table).
The next version of this TTC for Bonds will be published on April 30, 2019 and be applicable from Jun 1, 2019 for one-year with annual updates thereafter.
Corporate Bonds
Lets take Corporate Bonds and work through some examples.
Post-Trade
A €1m par value trade in a corporate bond that is not a liquid market.
This trade will be disclosed with a delay of two business days or four weeks.
A €1m par value trade in a corporate bond that is a liquid market.
This trade will be disclosed within 15 mins, with execution time, venue, ISIN, price, notional.
A €2m par value trade in a corporate bond that is a liquid market.
This trade will be disclosed with a delay of two business days or four weeks.
A €10m par value trade in a corporate bond that is a liquid market.
Disclosed with a delay of two business days or four weeks, with a notional of €10m.
Update: So there is no practical difference between SSTI and LIS and SSTI as the lower threshold will always be the one used in practice.
Pre-Trade
An order or response to an RFQ for €250k of a corporate bond that is not a liquid market.
No pre-trade disclosure.
An order or response to an RFQ for €250k of a corporate bond that is a liquid market.
Price and size is made public for both orders and RFQs.
An order or response to an RFQ for €500k of a corporate bond that is a liquid market.
RFQ is not made public but orders are made public.
An order or response to an RFQ for €2m of a corporate bond that is a liquid market.
No pre-trade disclosure.
There you have it, not too many end states given the rules.
FINRA TRACE
The only comparable public transparency data for Bonds that I am aware of is in the US with FINRA operating the Trade Reporting and Compliance Engine (TRACE), where all broker-dealers who are FINRA member firms have an obligation to report transactions in corporate bonds to TRACE under an SEC-approved set of rules.
This requires transactions in corporate bonds to be reported within 15 minutes of execution and there is public dissemination with Investment Grade (IG) bond trades disclosed as $5million+ (capped) even if they are much larger in size and High Yield (HY) bond trades disclosed as $1million+ (capped).
Note there is no definition of liquid market, so all trades are reported and there is no 2 business day deferral (there is a T+1 deferral for list, fixed offering price or takedown transactions, but I don’t know what these are to be able to have an opinion on their prevalence, answers on a post-card please or even better a comment).
TRACE has no pre-trade reporting or disclosure.
Other Bond types that are reported to TRACE include Convertibles, Agency, ABS, CMO, MBS, TBA.
FINRA began requiring firms to report transactions in Treasury securities on July 10, 2017, but there is currently no public dissemination.
ESMA Thresholds on TRACE Data?
I thought it might be interesting to apply the ESMA LIS and SSTI thresholds to TRACE data and see what these would show and how that compares with the existing transparency in US Corporate Bonds, which has been in place for many years and the subject of a number of research papers listed on the FINRA site.
Not being an expert in TRACE data, I asked the bond experts at FactEntry to use the TRACE data and construct a few tables for me.
First, TRACE corporate bond trades in a recent month categorised into ESMA threshold bands.
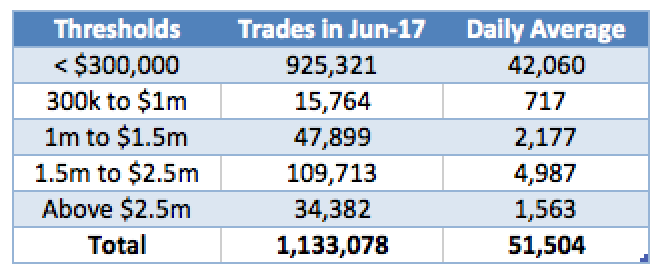
Showing that there were 1.13 million trades in June 2017, a daily average of 51,500 trades and the number of trades that fall into one of the five bands.
Post-Trade
The ESMA SSTI and LIS for post-trade are €1.5m and €2.5m respectively.
Using $1.5m as equivalent to €1.5m, as in this case I don’t think converting with FX rates makes much difference, we can use the table above to see:
- 988,984 trades or 87% are less than $1.5m notional
- 1,098,697 trades or 97% are less than $2.5m notional
So not too far off the 80% and 90% trade percentiles used by ESMA to determine the SSTI and LIS thresholds.
However as trades above the SSTI of $1.5m would be deferred for two business days or four weeks, this means that 13% of trades would not be publicly disseminated within 15 minutes as they are in the US.
And trades above the LIS of $2.5m would be deferred , while TRACE uses cap sizes of $5m for IG and $1m for HY and public dissemination within 15 minutes.
It is also important to understand that while 3% by trade count are > $2.5m and 2% greater than $5m (for IG), the notional this small trade percentage represents in the US is approximately 50% of overall volume.
Pre-Trade
The ESMA SSTI and LIS for pre-trade are €300k and €1m respectively and using these on the above table:
- 925,321 trades or 81% are less than $300k notional
- 941,085 trades or 83% are less than $1m notional
Which are much higher percentiles than the 60% and 70% used by ESMA on European data.
Of-course European Corporate Bond markets are different in detail to US Corporate Bond markets and it may well be that there are more issues and smaller trades in US markets. Anecdotally I recall that US Corporates make much more use of Capital markets than European ones, which rely more on their Banks for credit, or at least that was true prior to the Great Financial Crisis.
Liquid Market and ISINs
There is the determination of Liquid market, which may rule out some (or many?) of the TRACE trades from both pre-trade and post-trade public dissemination.
We could apply the ESMA criteria for Liquid Market determination on the TRACE data, but that is a task for another day.
I do have another interesting table to share created for me by the FactEntry folks.
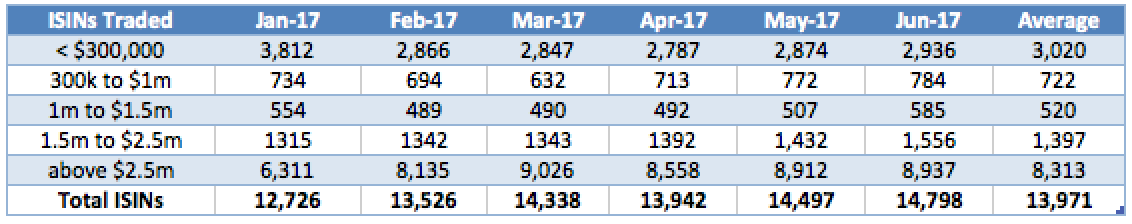
Showing:
- Monthly data for the first six months of 2017
- On average 14,000 ISINs trade in a month
- Splits by ESMA thresholds
- So 8,300 ISINs have trades > $2.5m
Interesting I wonder if European markets have a similar number of issues that trade actively or is it far less? We will soon find out. Before we end with TRACE, a few links for those interested in more detail on the TRACE data:
- MarketAxess provide nice visualizations on their Market Insights page
- FINRA has lots of data both in the TRACE FACTBook and MarketAggregateStats
Lets end by comparing the existing transparency in the US with the upcoming EU one.
Comparison of Europe and US
Post-trade transparency for Bonds in the EU will become similar to the US.
It will be less timely as some trades will have a 2 day deferral.
However NCAs can extend this to 4 weeks, which 26 out of 27 have chosen to do so.
US regime has a cap on disclosure of notional, while the EU one does not.
ESMA have created much more work for themselves or NCAs.
To calculate LM, SSTI and LIS on an annual or quarterly basis.
And the operation of rules for public dissemination is more complex.
More work and cost for APAs or other reporting entities.
Pre-trade pubic dissemination does not exist in US but will in the EU.
It will be interesting to see how this operates and the impact it has.
Much depends on good data to calculate LM, SSTI, LIS.
Much depends on NCAs and their discretionary deferral of 4-weeks.
Only a few more months before it all starts.
With a big bang or a whimper?
Only time will tell.
Hi, small point, but just to mention that the ISIN level liquidity test for bonds is >15 trades per day for the first period (you state 2 trades). This will reduce annually to 10 trades, 7 trades and finally 2 trades respectively, if ESMA can demonstrate no impairment to liquidity from the regime
The comparison of the proposed EMEA regime vs the US regime highlights the issues around equivalence and more fundamentally the difference between the US and the European attitude to commerce generally, and that’s before Mr Trump gets to work on the US version. Regulation is very important and appropriate transparency particularly so but when it is over done at the expense of clarity, the damage is likely greater than the benefit. Rule 1 for Regulators should be “Keep it Simple Stupid…”
Great article – than you. Why are you thinking that notionals greater than LIS do not need to be reported as the actual value & can be reported as LIS? I didn’t see anything in the regulation indicating that.
Thank you for your comment.
I ploughed thru many of the 400 pages of the RTS doc to look for this and am not able to find. I could have sworn it was somewhere. For the moment am going to update my blog to make clear that I am not sure on this point.
Later when I have a de-facto answer will correct.
Thanks again.
Updated based on subscriber feedback :
1. National Competent Authorities (NCAs) can extend the deferral period from 2 business days to 4 weeks and 26 of the 27 EU countries have stated that they will do this, with Denmark the only exception.
2. There is no capping of notional, so after the deferral period of 4 weeks, the full notional will be disclosed.
3. In practice the LIS thresholds are that ones that will be used and LIS are moot, certainly for post-trade and also for pre-trade for Bonds which is an RFQ market.
Thank you for the article. Very helpful. I have a couple of questions, please.
Am I correct in thinking that in the case of investment firms trading OTC in liquid corporate bonds
1) are subject to pre-trade transparency up to the SSTI
2) have to post-trade report as close to real-time as possible
3) can defer publication if above LIS for 2 days (or can be up to 4 weeks)
Next, what happens in the same OTC example as above the size is greater than the SSTI and less than the LIS. What happens then?