
This blog reviews Q1 2026 US SBSDR-reported OTC equity derivatives volumes – focusing on total return swaps (TRS) on the top five currencies – USD, EUR, JPY, GBP, CNY – which were 88 percent of the volume.
Key takeaways
Q1 2026 total SBSDR-reported notional volumes of equity TRS were as follows:
- USD TRS were up 96 percent year-on-year (YoY) to $3.38 trillion.
- EUR TRS were up 62 percent YoY to $926 billion.
- JPY TRS were up 95 percent YoY to $432 billion.
- GBP TRS were up 66 percent YoY to $423 billion.
- CNY TRS were up 146 percent YoY to $411 billion.
I am interested in your thoughts on the drivers of some of the dramatic volume increases noted.
We expect to cover this topic at least quarterly going forward.
Read on for the charts and tables created in SBSDRView.
Volume context
We begin by breaking down Q1 2026 volumes by currency.
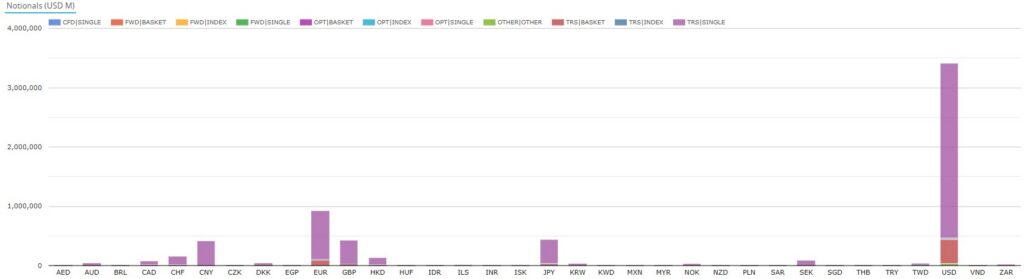
Chart 1: US SBSDR-reported EQD volumes by currency, product type, and subtype (notional USD millions). Source: SBSDRView
Chart 1 shows that the total $6.39 trillion notional of EQD in Q1 2026 broken down as follows:
- $3.41 trillion (54 percent) in USD.
- $931 billion (15 percent) in EUR.
- $438 billion (6.9 percent) in JPY.
- $424 billion (6.7 percent) in GBP.
- $415 billion (6.5 percent) in CNY.
- $519 billion (8.2 percent) in the next five currencies – CHF, HKD, SEK, CAD, AUD.
- $218 billion (3.4 percent) in the remaining 24 currencies.
Product type total return swaps (TRS) had 99 percent of the volume with the remaining 1 percent comprising contracts for difference (CFDs), options (OPT), forwards (FWD) and other (OTHER).
We limit the remainder of the blog to product type TRS (including all subtypes: single-name, basket, index, and other) in the top five currencies above, which were 88 percent of the volume.
Keep in mind that US SBSDRs are limited to trades reported with a US party on one or both sides and are a large fraction of global volumes which can vary over time. Nonetheless, volume growth percentages by currency are a good guide to that currency’s global volume growth.
USD TRS
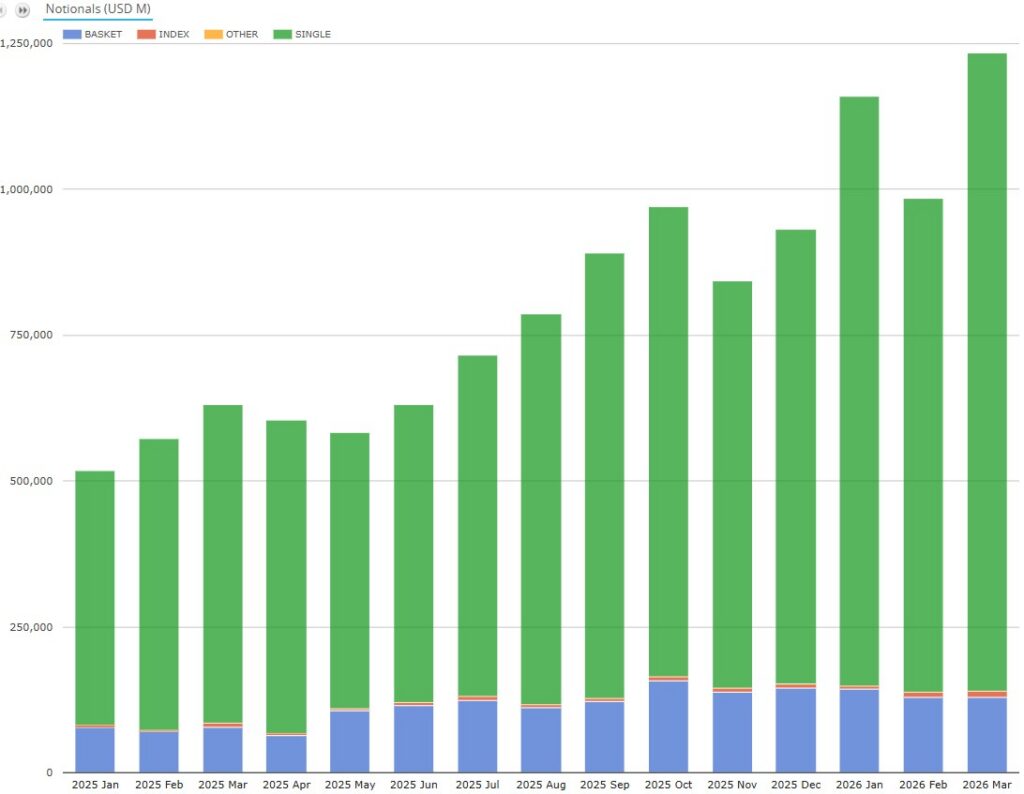
Chart 2: US SBSDR-reported USD equity TRS volumes by subtype (notional USD millions). Source: SBSDRView
Chart 2 illustrates the total USD equity TRS volume in Q1 2026 of $3.38 trillion, a new record quarter – up 96 percent YoY and up 23 percent quarter-on-quarter (QoQ) from $2.74 trillion, the previous high set in Q4 2025.
- While single-name TRS doubled YoY, basket TRS and index TRS also grew YoY by above 75 percent.
- All three months in Q1 exceeded $970 billion, the previous highest month set in October 2025.
Now we look at the most actively traded names. Here, SBSDRView’s calculations decomposed basket TRS and index TRS into constituent stocks and added them to the single-name TRS.
Top 10 USD TRS most actively traded names (ranked by USD notional). Source: SBSDRView
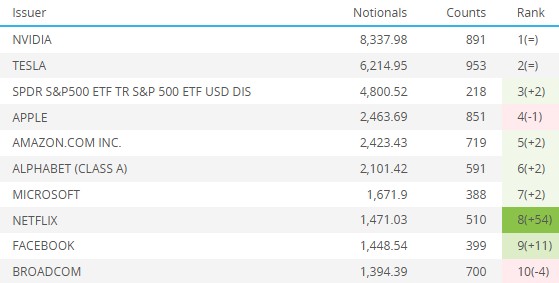
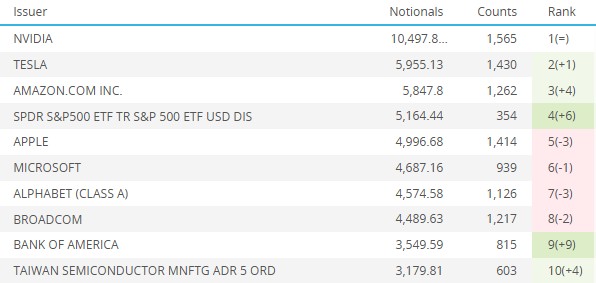
Table 1: March 2025
Table 2: March 2026
Tables 1 and 2 show the top ten names most actively traded in USD TRS in March 2025 and March 2026 for YoY comparison. As usual, the list is dominated by semi-conductors, Tesla, big tech, and the S&P 500 index ETF, except for Netflix in the March 2025 list and Bank of America in the March 2026 list.
Eight of the ten featured in both lists. Netflix and Facebook in the March 2025 list were replaced by Bank of America and Taiwan Semiconductor in the March 2026 list.
EUR TRS
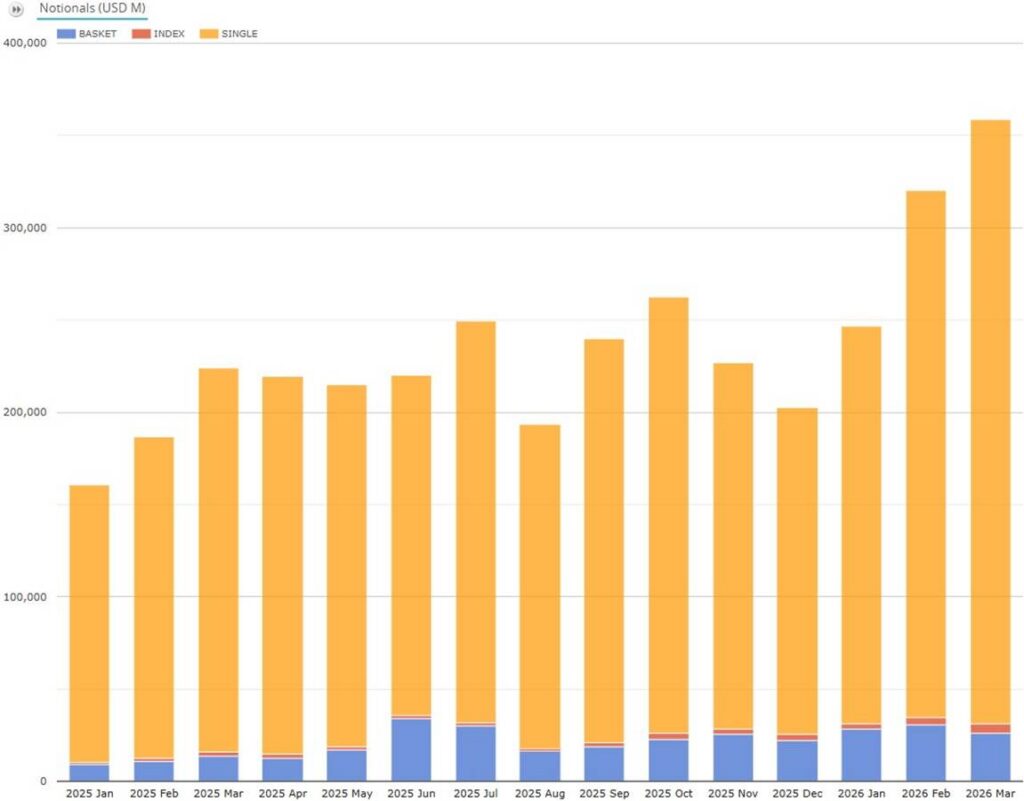
Chart 3: US SBSDR-reported EUR equity TRS volumes by subtype (notional USD millions). Source: SBSDRView
Chart 3 illustrates the total EUR equity TRS volume in Q1 2026 of $926 billion, a new record quarter – up 62 percent YoY and up 34 percent QoQ from the previous high in Q4 2025 of $692 billion.
- While single-name TRS dominated TRS volumes, basket TRS and index TRS each more than doubled YoY in quarterly volume.
- February ($320 billion) and March ($359 billion) were consecutive new monthly highs. Each comfortably exceeded $263 billion, the previous highest month set in October 2025.
Top 10 EUR TRS most actively traded names (ranked by USD notional). Source: SBSDRView
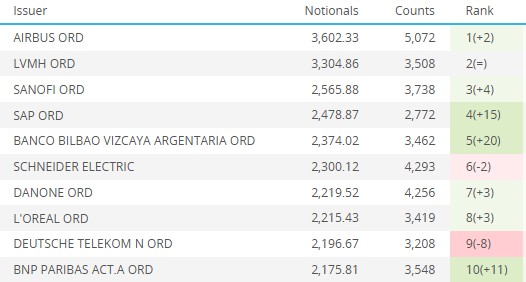
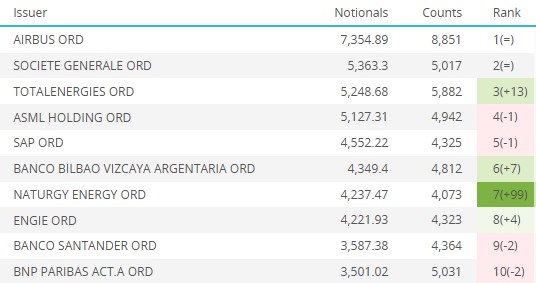
Table 3: March 2025
Table 4: March 2026
Tables 3 and 4 show the top ten names most actively traded in EUR TRS in March 2025 and March 2026 for comparison.
Four of the ten from March 2025 made the ten in March 2026: Airbus, SAP, Banco Bilbao, BNP Paribas.
JPY TRS
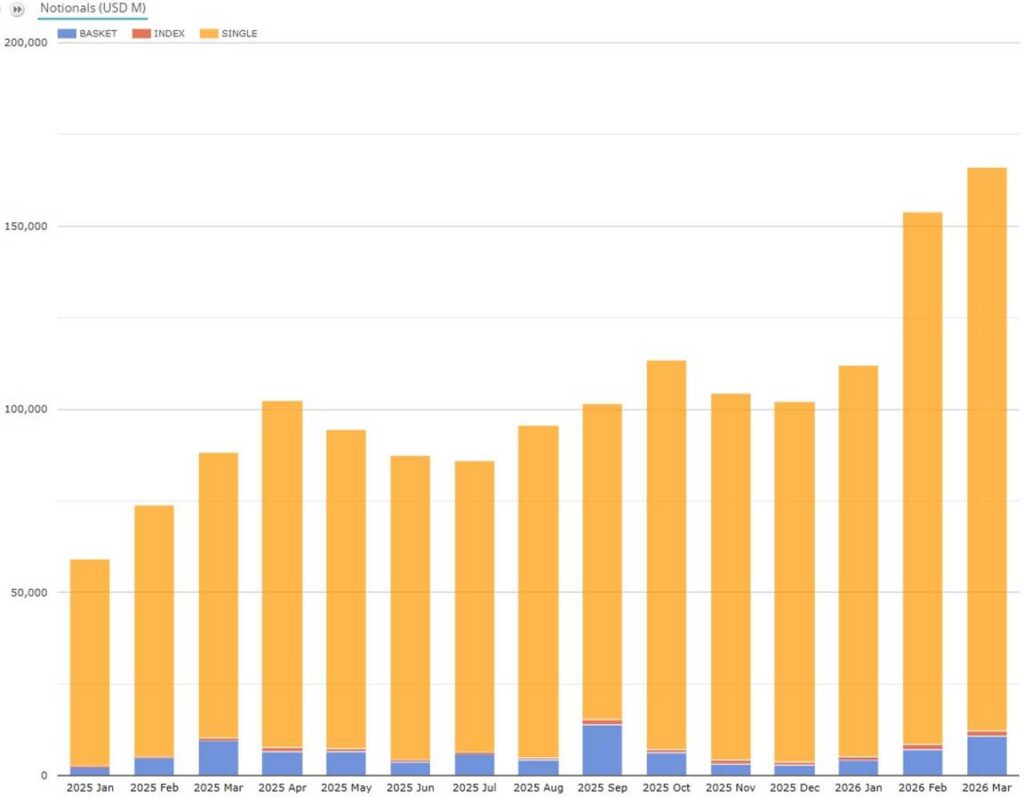
Chart 4: US SBSDR-reported JPY equity TRS volumes by subtype (notional USD millions). Source: SBSDRView
Chart 4 illustrates the total JPY equity TRS volume in Q1 2026 of $432 billion – up 95 percent YoY and up 35 percent QoQ from $320 billion, the previous high set in Q4 2025.
- Single-name TRS dominated volumes, but index TRS grew disproportionately by 144 percent YoY.
- February ($154 billion) and March ($166 billion) were consecutive new highs – each comfortably exceeding the previous high set in October 2025 of $114 billion.
Top 10 JPY TRS most actively traded names (ranked by USD notional). Source: SBSDRView
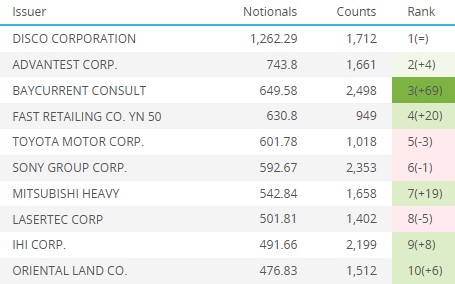
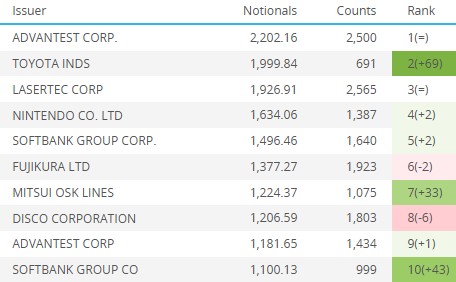
Table 5: March 2025
Table 6: March 2026
Tables 5 and 6 show the top ten names most actively traded in JPY TRS in March 2025 and March 2026 for comparison. There are three semiconductor manufacturing support companies here (Disco, Advantest, Lasertec) and Softbank invests in or owns tech companies.
Four of the ten from March 2025 made the ten in March 2026: Toyota plus the three semiconductor-related names noted above.
GBP TRS
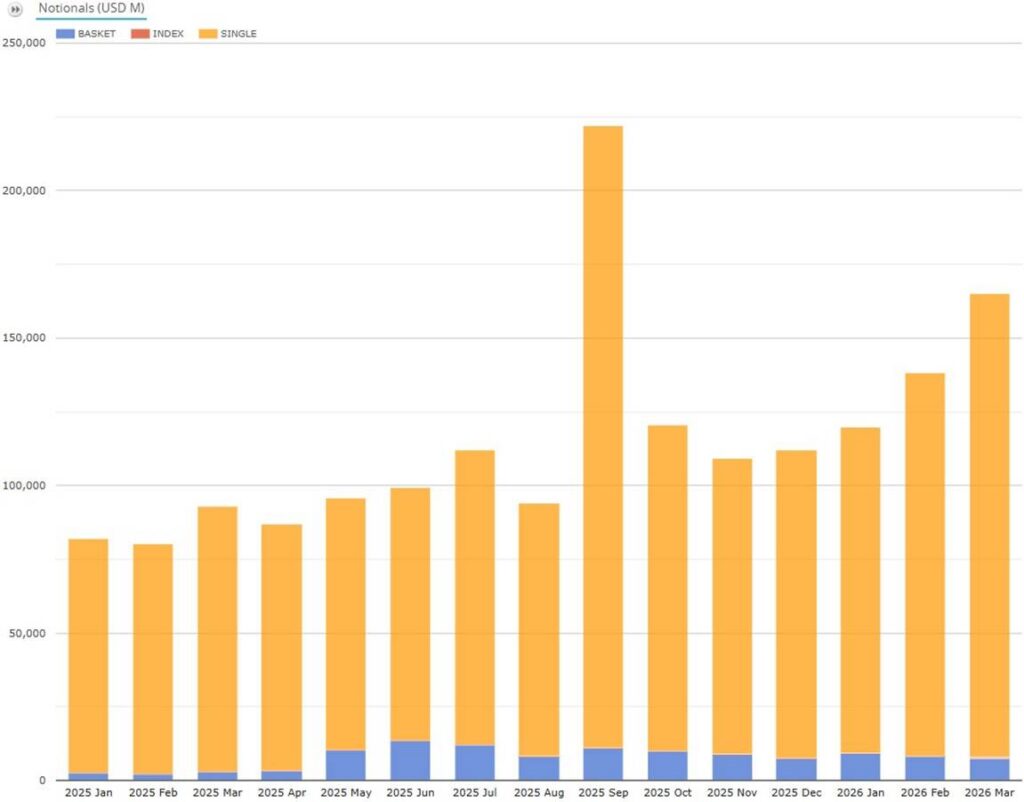
Chart 5: US SBSDR-reported GBP equity TRS volumes by subtype (notional USD millions). Source: SBSDRView
Chart 5 illustrates the total GBP equity TRS volume in Q1 2026 of $423 billion – up 66 percent YoY and up 24 percent QoQ.
- Each month in Q1 2026 was comfortably below the previous monthly high set in September 2025 of $222 billion.
- Single-name TRS made up the bulk of the trends mentioned above, while basket TRS were $24.9 billion in the quarter – up 227 percent YoY but down 4.7 percent QoQ and from the recent peak in Q3 2025.
GBP TRS most actively traded ten names (ranked by USD notional). Source: SBSDRView
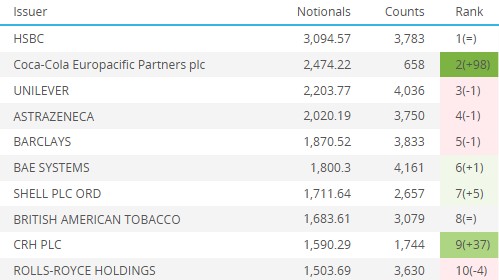
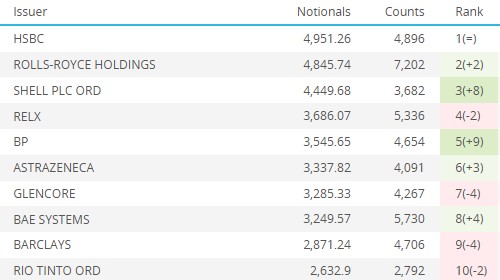
Table 7: March 2025
Table 8: March 2026
Tables 7 and 8 show the GBP TRS ten most actively traded names in March 2025 and March 2026 for comparison.
Six of the ten from March 2025 stayed in the ten from March 2026: HSBC, AstraZeneca, Barclays, BAE Systems, Shell, Rolls-Royce.
CNY TRS
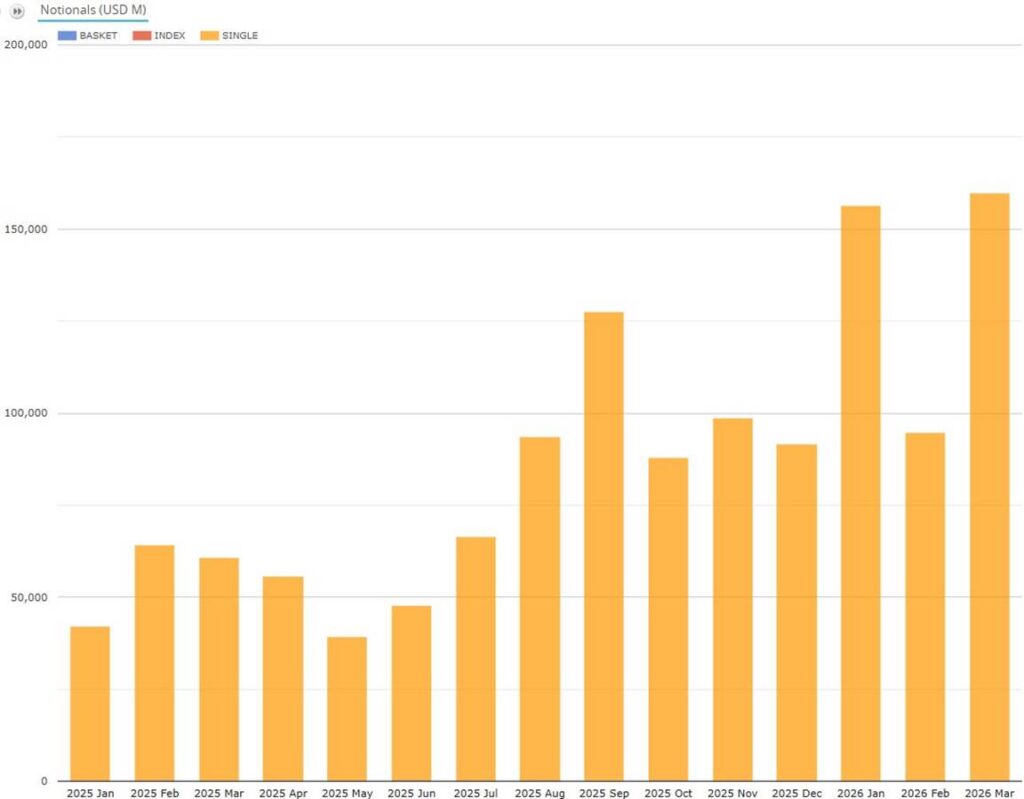
Chart 6: US SBSDR-reported USD equity TRS volumes by subtype (notional USD millions). Source: SBSDRView
Chart 6 illustrates the total CNY equity TRS volume in Q1 2026 of $411 billion – up all of 146 percent YoY and up 48 percent QoQ.
- Each of January ($156 billion) and March ($160 billion) comfortably exceeded the previous high set in September 2025 ($128 billion).
- All the activity was in single-name TRS (no basket TRS or index TRS were reported in Q1 2026).
Thanks to Google Finance, the top ten most actively traded CNY stocks (by cash equities dollar volume) in Q1 2026 were a range of companies including only one EV manufacturer, one semiconductor manufacturer, a battery maker, two optical component manufacturers, and no big tech firms. The limited inclusion of EV manufacturers and big tech firms may be because such Chinese companies often list (denominated in HKD) on the Hong Kong Exchange.
End note
Skip back to the top to reread the key takeaways if you like.
We used six charts and eight tables for an overview, but there is a lot more data in SBSDRView.
Please contact us for information or for details on the above analysis.