This blog gives an update on swap clearing broker concentration risk and asks whether the recent increase in the number of swap FCMs heralds an improvement.
Key takeaways
At the end of Q1 2025:
- Though unshackled by bank leverage and capital ratios, the eleven new entrant broker-based swap clearing brokers (CBs) which led to the increase in swap FCM count, are not large enough to offer porting capacity to alleviate swap CB concentration risk.
- CB concentration in fact continues to increase, though at a glacial, non-headline grabbing pace. This is an unsolved problem, not a non-problem.
- One of the dominant original nine large-bank-owned swap FCMs has withdrawn about every five years resulting in their client portfolios being absorbed by the remaining seven swap FCMs in that group, increasing swap FCM concentration.
- Since we have not experienced a large swap CB/FCM default, we cannot know that CCPs closing out one of those seven swap FCMs can promptly and completely port client portfolios totalling a minimum of 9 percent of the total US FCM customer swap margin requirement.
- Ironically, only an actual swap CB default will tell us whether current swap CB concentration risk levels are manageable.
Introduction
Whilst client-cleared financial futures have been around a lot longer, client-cleared swaps started at LCH SwapClear in December 2009, about a year after the start of the global financial crisis (GFC) when G20 regulators’ were clearly going to push swap client clearing. Since then, the largest global investment banks consistently dominated swap client clearing and thus swap CB concentration risk has been a regular discussion point.
Besides antitrust or oligopoly power concerns, concentration risk is about CB default risk. A defaulting CBs house portfolio close-out is designed to be covered by the CCPs’ default resources, but porting risk is not covered by CCPs’ default resources at all. “Porting risk” is the risk that the defaulting CB’s clients cannot be promptly and completely shifted to other willing CBs.
In general, porting risk increases the higher the aggregate risk in the defaulting CB’s client portfolios (for which the aggregate margin requirement is a reasonable proxy), and the fewer the number of other CBs available to which to port. Note that porting risk is hard to quantify because it depends partly on private decisions by each CB and their bank parent on strategic client acquisition appetite and on allocation of leverage and capital capacity.
A useful reference for this blog is the July 2024 paper How concentrated is the clearing ecosystem and how has it changed since 2007? from Ketan Patel of the Chicago Fed. The paper is much broader in scope than this blog and contains many interesting points not covered here. Please have a read. Like this blog, it uses IOSCO concentration disclosures (but focused on US futures exchanges) and the CFTC FCM Financial Data (but combines ETD and swap balances per FCM).
This blog looks specifically at the IOSCO disclosures of the largest swap CCPs and the swap client clearing balances only from the FCM Financial Data.
IOSCO disclosures
Among the many other IOSCO disclosures, CCPs report quarterly statistics on the count of their members which clear for clients and the total client transactions share of their top five and top ten such members. The CCPView disclosures tab can chart each of these statistics and more for every CCP. For brevity however, I used spreadsheet downloads to combine the three stats into a single chart for each of the largest rates and credit swap CCPs.
Year-end CB concentration for top swap CCPs. Source: CCPView disclosures tab
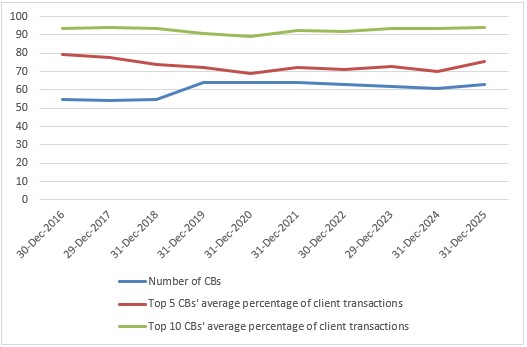
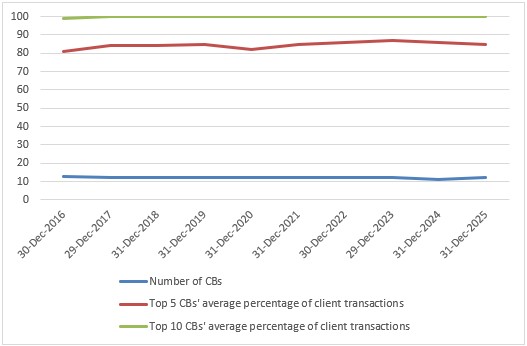
Chart 1: LCH SwapClear
Chart 2: ICE Clear Credit (ICC)
Please forgive me for cheating a bit by putting a count (the number of CBs) on the same chart scale as two percentages (the shares of client transactions of the top five and top ten CBs).
At the end of 2025 we see that:
- The number of CBs was 63 at SwapClear and 12 at ICC (both down 1 from their peaks).
- The top ten CBs’ December monthly average share was 94.2 percent at SwapClear and 100 percent at ICC (both their highest in the period shown).
- The top five CBs’ December monthly average share was 75.5 percent at SwapClear and 85 percent at ICC (both close to but below their peak in the period shown).
Despite the divergent number of CBs, the top five CBs shares are not that different. A top five CB default would on average require porting of clients amounting to 15.1 percent and 21 percent of the total client transaction volume of SwapClear and ICC, respectively.
Public FCM data and charts
On its Financial Data for FCMs page, CFTC publishes monthly FCMs balances covering both exchange-traded derivatives (ETD) and cleared swaps which are available all the way back to the start of 2002. The monthly report includes each FCM’s name, capital, segregated customer assets, and margin requirements for both ETD (“Customers Seg Required 4d(a)(2)”) and swaps (“Customer Amount Cleared Swap Seg Required”).
At the end of March 2026 the data show 71 US FCMs among which 52 have ETD client balances and 24 have swap client balances. This already shows the narrower participation by FCMs in swap client clearing than futures client clearing.
Based on the CFTC-published data, FIA provides a handy chart.
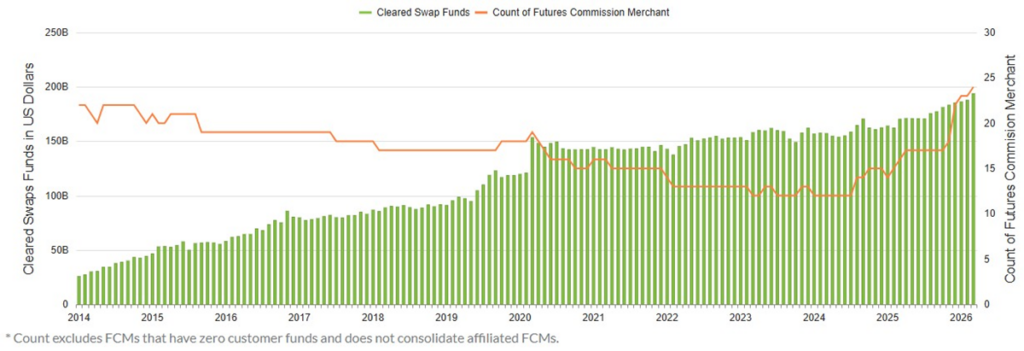
Chart 3: Month-by-month customer cleared swap funds and FCM count. Source: FIA
Chart 3 shows that US FCMs’ customer swap IM requirements increased more steeply before 2020 than subsequently. This may be because the likelihood of new trades’ netting off within the CCP IM calculation improves as a client’s post-mandate portfolio transition to clearing approaches completion.
- FCMs’ total customer swap IM required reached $194 billion at the end of March 2026.
- The count of swap FCMs was 22 for most of 2014, 12 for the first seven months of 2024, and 24 in March 2026.
The recent increase in FCM count suggest we might be able to relax about swap FCM concentration. Before we go there, we need to analyze the entity level data.
Analyzing by entity
With a bit of AI help, I pulled the December reports from 2016 onwards and the monthly reports from January 2023 until March 2026 into a 3,000-row table. I added together FCMs from the same bank group – among others combining BofA with Merrill Lynch, two Goldman Sachs entities, and two BNP Paribas entities.
The data show that the G14 banks dominated customer swap IM requirements.
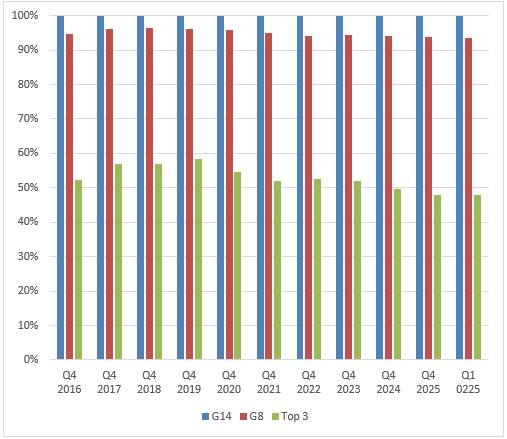
Chart 4: Selected quarter ends’ share of share of customer swap margin requirement by selected FCM groups. Source: FIA
Chart 4 shows the percentage share of customer swap margin requirement for three groups.
- “G14” is a conventional term in the industry meaning the fixed list of banks listed under Chart 5 below. G14 banks had more than 99.8 percent of customer margin requirement throughout the period. After Deutsche Bank and Credit Suisse withdrew by the end of 2016 and 2021 respectively, the remaining 12 banks picked up their clients. Then, Deutsche Bank restarted its swap FCM in 2025. The G14 were now 13.
- “G8” is a term I define here to mean the first 8 banks listed under Chart 5 below. G8 banks also had stable market share within 1.5 percent of 95 percent throughout the period. After Credit Suisse’s withdrawal in 2021, the other seven picked up their clients. The G8 became 7.
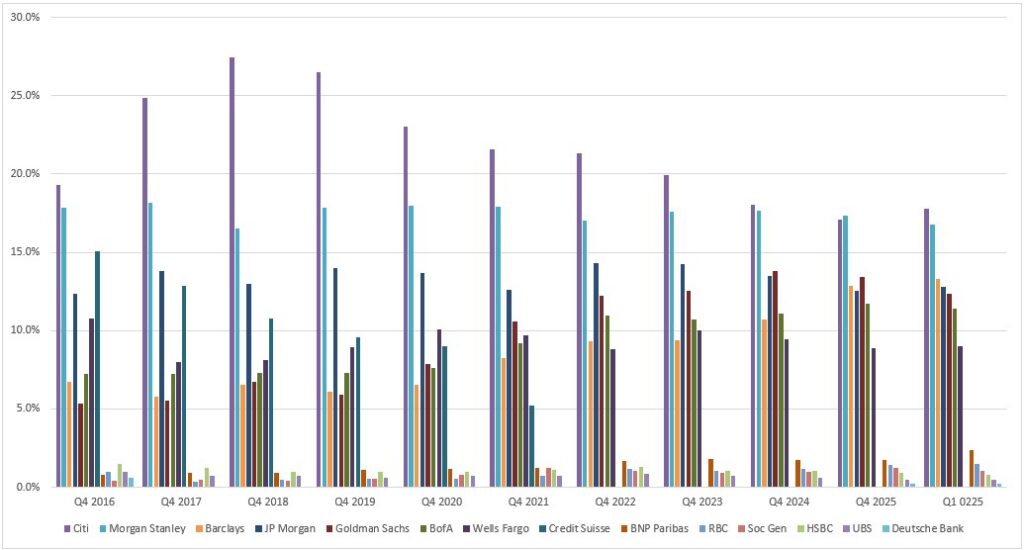
Chart 5: Selected quarter ends’ share of customer swap margin requirement by G14 bank. Source: FIA
Chart 5 shows the shares of the individual banks making up the groups in Chart 4. You can eyeball each bank’s shares across the years. Comparing end Q1 2026 and end Q4 2016, the highlights are:
- Citi drove the top three share dynamic as Morgan Stanley and JP Morgan saw much less varied shares. Notably, Barclays reached third at the end of Q1 0205 for the first time in the period.
- G8 banks bar Credit Suisse consistently held over 5 percent and over 8 percent from 2022 onwards. Barclays, Goldman, and Bank of America (BofA) picked up a combined 17.7 percent from Credit Suisse’s 15.1 percent and the drops in share from Citi (2.2 percent) and Wells Fargo (1.8 percent). Clients were likely mostly recycled within the G8 group.
- Among the remaining 6 G14 banks, none exceeded 2 percent share before BNP Paribas hit 2.4 percent at the end of Q1 2024.
Essentially, the withdrawal of one swap CB in 2016 (Deutsche Bank, mostly before this period starts) and another in 2021 (Credit Suisse) has led to seven large bank-owned US swap FCMs sharing a similar dominant share as nine had shared before. This is increased swap CB concentration.
What the data show is that a default of one of the seven large swap FCMs would require rapid porting of client portfolios covering at least 9 percent of total swap FCM client margin requirements to the other six large swap FCMs or perhaps in part to other smaller swap FCMs. This would force to happen in a few days what Credit Suisse made happen over months or even years during its voluntary withdrawal.
We have not seen a major swap CB default since the start of swap client clearing (perhaps in part a result of post-GFC bank regulator safeguards). Ironically, only an actual swap CB default will tell us whether current swap CB concentration risk levels are manageable.
What about the brokers?
Non-banks and brokers not owned by banks are spared the balance sheet constraints placed on bank CBs. This should help them compete with bank CBs.
After we subtract the 13 remaining G14 banks from the 24 swap FCMs counted by FIA, we have 11 non-banks with a combined 0.1 percent or $194 million of the Q1 2026 customer seg requirement total of $194 billion. These 11 brokers comprise:
- Four with 20 million or more: Marex ($72 million), Wedbush ($52 million), Robinhood ($25 million), and Interactive Brokers ($20 million).
- Seven with $10 million or less including three financial brokers (Plus500US, Webull, and UDM), one digital currency firm (Coinbase), and three prediction markets firms (Fanduel Prediction Markets, Performance Predictions, Sleeper Markets).
So far these firms are too small by one or two orders of magnitude to provide comfort to our CB concentration concerns. Time will tell whether they grow dramatically enough to change that.
End note
Skip back to the top to reread the key takeaways if you like.
Contact us if you are interested in a CCPView subscription.