This post continues our quarterly strikes analysis of USD swaptions, which are typically 50 percent or more of swaptions volumes in all currencies.
We use SDRView data, which captures OTC derivatives trades reported by US financial firms to US SDRs.
Key takeaways
- In Q1 2025:
- SDR-reported USD swaptions package notional executed was up 14.1 percent year-on-year (YoY) despite lower volatility YoY in underlying SOFR swap rates.
- Package count executed increased YoY by 7.2 percent and average package size increased YoY by 6.4 percent.
- We analyze volumes by option type, strike and major tail – enabled by SDRView trade data download to a spreadsheet.
Swap market context
If you are new to swaptions, some basics are outlined at the start of the earlier Q1 2025 blog. You may also wish to keep open for reference our recent blog on 2025 swaption volumes.
Q1 2026 saw the following daily activity and price moves in 10-year SOFR swaps.
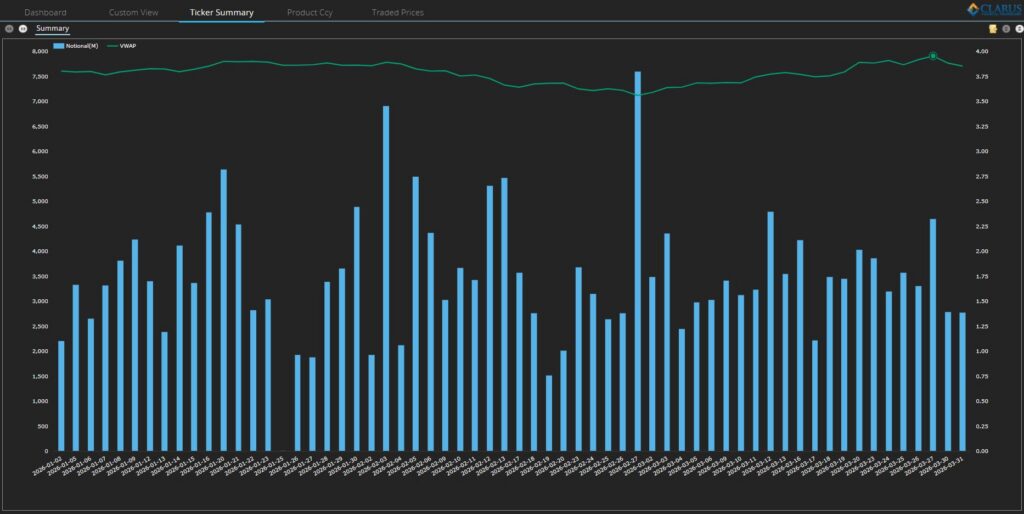
Chart 1: Q1 2026 USOSFR10 day-by-day swap USD notional and VWAP. Source: SDRView
Chart 1 shows that 10Y USD SOFR swap rate (ticker USOSFR10) increased to touch 3.9 percent in the first half of January, declined in February to just breach 3.6 percent at the end of the month before increasing to just exceed 3.95 near the end of March.
- The VWAP range from 3.56 percent to 3.95 percent was 39 basis points (bps) – down YoY from 58 bps in Q1 2025 but up QoQ from 29 bps in Q4 2025.
Swaptions activity overall
Note: all swaption activity counts and notional volumes are package-adjusted. For example a straddle containing 2 swaption trades each with $100 million notional would contribute 1 package count and $100m package notional to the statistics. In practice, only straddles are the only package type and swaption type adjusted in this way.
Activity was up in Q1 2025 after the lull in Q4 2025.
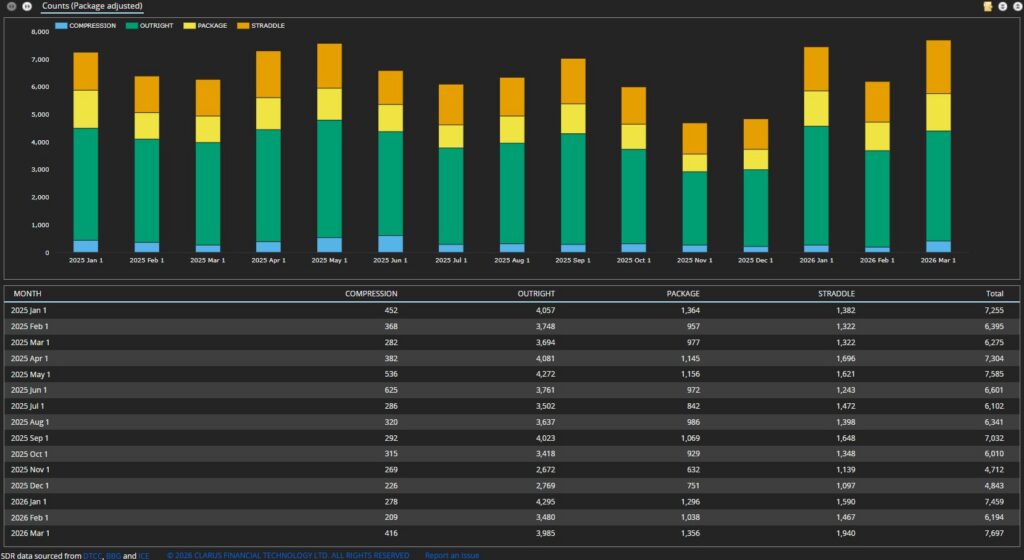
Chart 2: Month-by-month package count of USD swaption packages executed by package type. Source: SDRView
Chart 2 shows that there were 21,350 swaption packages executed in Q1 2026 – up 7.2 percent YoY, and up 37 percent QoQ.
- March 2026 was up 23 percent YoY and was the main driver of the Q1 YoY increase.
The volume increases came despite the lower volatility in underlying SOFR swap rates noted in Swap market context above.
If we look at the same trades but analyzed by notional, we see a subtly different picture.
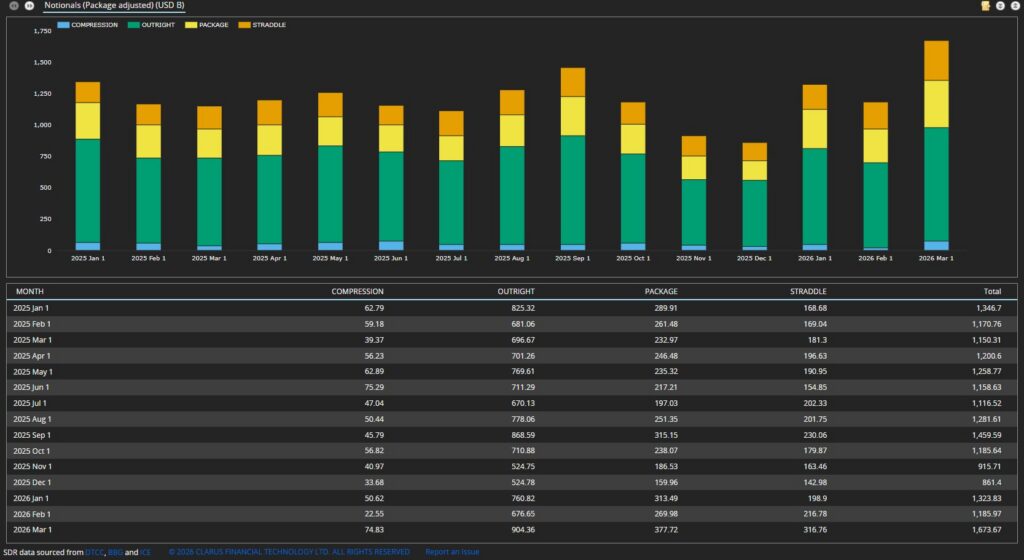
Chart 3: Month-by-month notional volume of USD swaption packages executed by package type ($ billions). Source: SDRView
Chart 3 shows that Q1 USD swaps saw package notional volume of $4.18 trillion executed – up 14.1 percent YoY and up 41 percent QoQ.
- Swaption compressions volumes (which are an indicator of rates IM optimization activity) similar notional volumes in Q1 2026 as those in Q3 and Q4 2024, down YoY by 18 percent.
We now look at average package sizes by dividing total notional by total count for each quarter.
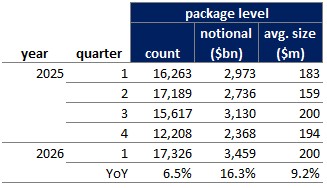
Table 1: quarter-by-quarter USD swaptions package count, notional, and average size. Source: SDRView, author analysis
Table 1 shows that the Q1 2026 average size of major tenor USD swaptions packages was $196 million – up 6.4 percent YoY, consistent with the different YoY increases in package count and package notional.
Let us take a quick look at USD swaptions’ capped trade percentages.
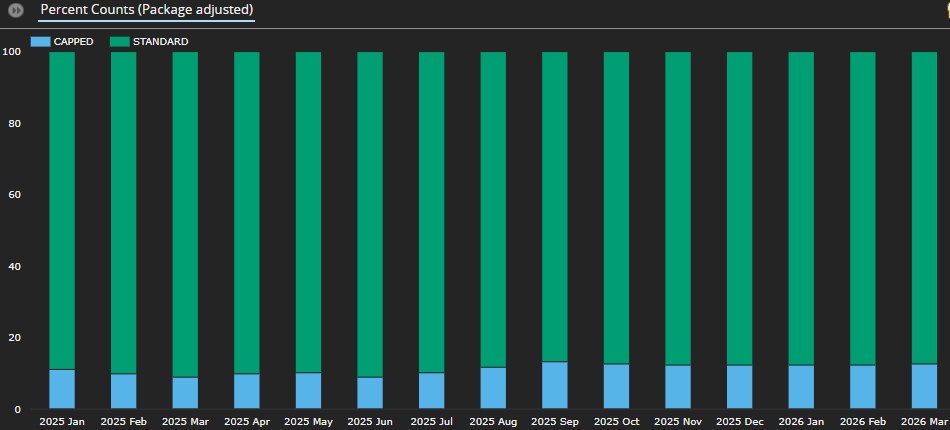
Chart 4: Month-by-month USD swaption package count capped percentage. Source: SDRView
Chart 4 shows that the capped percentage of USD swaption packages was above 12 percent in each month of Q1 2026, as it was in each month of Q4 2025 after the peak above 13 percent in September 2025. These were up YoY from an average of around 10 percent in Q1 2025.
The larger capped percentages in Q3 2025, Q4 2025 and Q1 2026 are consistent with the larger package sizes noted in Table 1 above.
Swaptions activity by strike
SDR data for all USD swaptions reported in Q1 2026 (including packages) can be used to create the following heatmaps of swaption activity. Table 2 shows all option types combined while payers, receivers, and straddles are each broken out in turn in subsequent tables.
Each table shows new package notional volume (in $ millions) of USD swaptions traded in major whole-year tails (in the vertical axis) in 25 bps strike ranges. For context, the tails excluded comprise about 1/6th of the total volumes covered in Swaptions activity overall above.
- We group expiries by tail. For example, we group a 3M10Y (that is, 3-month expiry, 10-year tail) with a 1Y10Y, if traded at the same strike.
- Red areas show the “hottest” strike-tail combinations, meaning those which saw the most notional traded.
First, we look at the summary across all option types.
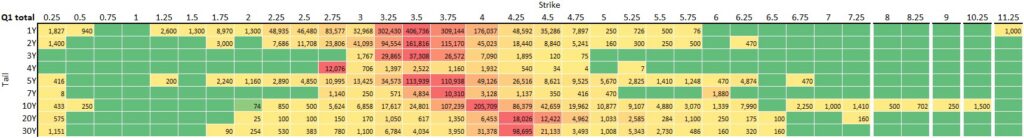
Table 2: Q1 2026 USD swaption package volumes by major tail and strike (notional USD millions). Source: SDRView
Table 2 shows the breakdown of Q4 USD swaption package notional volumes by major tails and strikes. These were up 16.3 percent YoY, with the 1Y growing comparatively slowly at 6.4 percent while 5Y, 10Y, and 30Y tails (among others) grew by over 20 percent.
- The red areas for strikes near to at-the-money rates ranged from 3.25, 3.5, and 3.75 for 1Y tails to around 4, 4.25, and 4.5 for 30Y tails.
- Across all tails, the range of strikes trading over $20 billion in the quarter was from 2.25 to 5.25, wider than the Q4 2025 range from 2.25 to 4.75.
- While all tails increased in volume from Q4 2024, the most active tail remained 1Y which traded $1.52 trillion notional – driven by $1.19 trillion in strikes of 3.25, 3.5, 3.75, and 4 percent.
Now, we look at fixed-rate receiver swaptions.
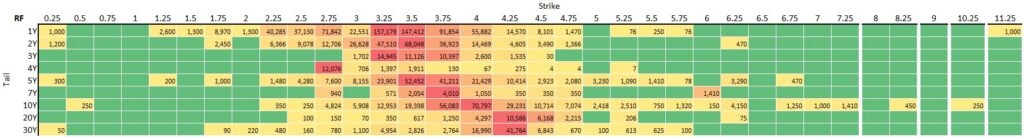
Table 3: USD receiver swaptions notional volumes by major tail and strike in USD millions. Source: SDRView
Table 3 shows the breakdown of Q1 2026 fixed-rate receiver swaptions activity, which made up 43.9 percent of USD swaption major tenors package notional traded – up from 39.2 percent in Q4 2025.
- The most active tail was 1Y, which saw more than $10 billion traded in each strike from 2.25 to 4.25 percent
- Of all activity in 4Y tails, receivers were 81.3 percent, of which 59.3 percent was in 2.75 strikes alone.
- Of all activity in 20Y tails, receivers were 50.5 percent, of which 40.7 percent was in 4, 4.25 and 4.5 percent strikes.
Next, we have fixed-rate payer swaptions.
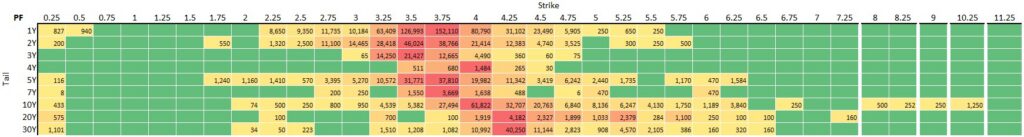
Table 4: USD payer swaptions notional volumes by major tail and strike in USD millions. Source: SDRView
Table 4 shows the breakdown of Q1 2026 fixed-rate payer swaptions activity, which made up 34.7 percent of USD swaption major tenors package notional traded – down from 40.8 percent in Q4 2025.
- The most active tail was 1Y, of which the most active strikes were 3.5 percent and 3.75 percent – as in Q4 2025.
- Of all activity in 3Y tails, payers were 51.0 percent, of which almost all was in strikes of 3.25, 3.5, 3.75, and 4 percent.
- Of all activity in 30Y tails, payers were 43.9 percent, of which 33.9 percent was in strikes of 4, 4.25, and 4.5 percent.
Finally, there are swaption straddles.
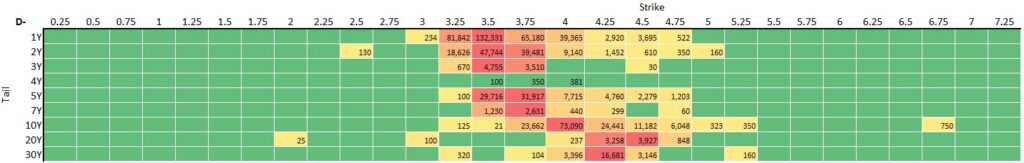
Table 5: USD swaption straddle package notional volumes by major tail and strike in USD millions. Source: SDRView
Table 5 shows the breakdown of Q1 2026 swaptions straddle activity, which made up 20.8 percent of USD swaption major tenors package notional traded – down slightly from 21.9 percent in Q4 2025. (Reminder: as noted above, straddle notional volumes are package-adjusted).
- As usual, the Q3 range of strikes was more compressed for swaption straddles than for payers or receivers. See the Q1 2025 blog for an explanation.
- The most traded straddles were 1Y tails at 3.25, 3.5, 3.75, and 4 percent strikes, then 10Y at 4 percent, then 5Y at 3.5 and 3.75 percent, then 2Y at 3.5 and 3.75 percent.
- The 1Y tail alone accounted for over $326 billion or 46.1 percent of straddle activity.
End note
Skip back to the top to reread the key takeaways if you like.
Contact us if you are interested in an SDRView subscription.