This blog is the first edition of what will become a regular quarterly blog on competition between rates derivatives exchanges and CCPs measured by market share of trade notional cleared.
Key takeaways
In Q1 2026, the exchanges and CCPs market shares of the more competitive cleared derivatives products were as follows.
- EUR swaps: Eurex’s share increased to 13.2 percent (to LCH’s 86.8 percent) – up 2.6 percent year-on-year (YoY). This was partly driven by the Active Account Requirement (AAR) go live in June 2025.
- JPY swaps: LCH’s share reached 59.5 percent (to JSCC’s 40.5 percent) – up 8.8 percent YoY. After CFTC’s September 2025 lifting of its restriction on their clearing at JSCC, US buy-side firms are being onboarded by JSCC in the hope of reversing the trend.
- CNY swaps: Shanghai Clearing House (SCH) reached 73.0 percent (to LCH’s 27.0 percent) – up 12.6 percent YoY. Swap Connect contributed 7.7 of the 73.0 percent.
- INR swaps: LCH reached 72.5 percent (to CCIL’s 27.5 percent) – up 5.2 percent YoY.
- USD SOFR futures: FMX/LCH’s Q1 2026 share was 0.60 percent (to CME’s 99.4 percent) and its Q1 volumes were up 18x YoY. It is unclear at what market share level this exponential growth will flatten off.
- EUR Euribor futures and €STR futures combined: ICE’s Q1 2026 money market (MM) futures share was 94.2 percent (to Eurex’s 5.6 percent) – up 5.5 percent YoY. ICE had over 80 percent of €STR futures for the first time.
- JPY TONA futures: after a big market share upswing in Q4 2025, JPX retreated to 40.6 percent in Q1 2025, while TFX increased to 37.7 percent and SGX increased to 21.8 percent, respectively. TONA futures remain the most competitive product covered here.
Read on for more details.
Introduction
I pick up this thread from previous blogs on exchange/CCP competition for Q3 2025 rates swaps, 2025 rates ETD and Q3 2025 rates ETD. I checked across the board and found the same currency and product combinations as mentioned above remain truly competitive. I define truly competitive to mean more than one CCP has market share above 5 percent. I make an exception to this rule only for USD SOFR futures due to the dramatic startup growth in the second exchange/CCP.
EUR swaps: LCH versus Eurex
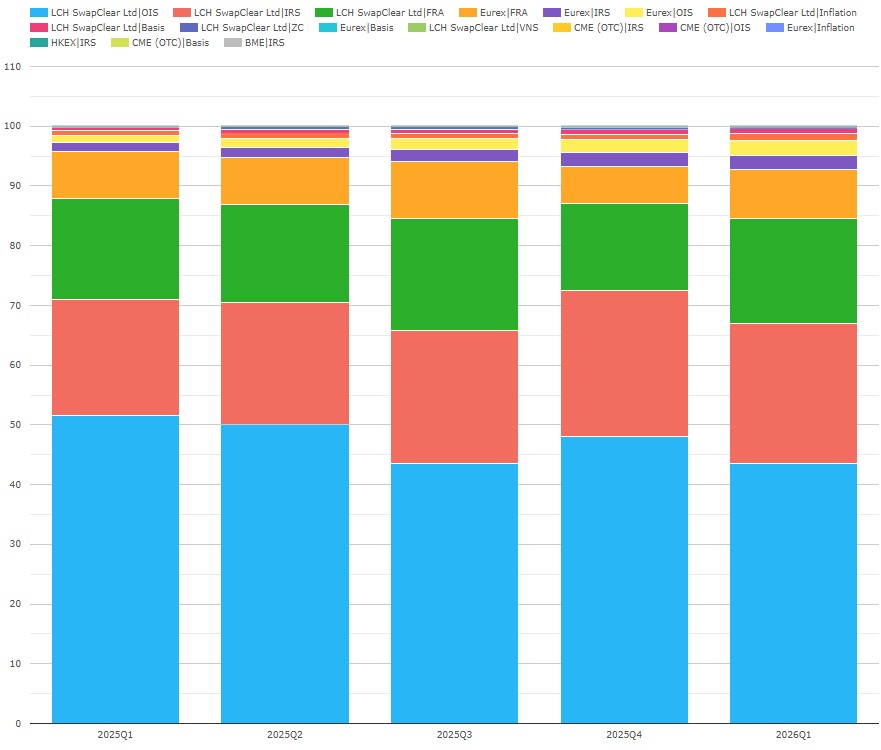
Chart 1: volumes of cleared EUR swaps by CCP and product type (percent of EUR notional). Source: CCPView
Chart 1 illustrates Eurex’s share of Q1 2026 EUR swaps of 13.2 percent to LCH’s 86.8 percent. Eurex’s share was up 2.6 percent YoY.
- CME had 0.0068 percent down YoY from 0.033 percent.
Chart 1 figures can be used to compute shares of the big three products:
- EONIA OIS: Eurex had 5.5 percent (up YoY from 2.2 percent) to LCH’s 94.5 percent.
- Eurex had 9.3 percent (up YoY from 6.9 percent) to LCH’s 90.7 percent.
- Eurex had 31.7 percent (down YoY from 31.9 percent) to LCH’s 68.3 percent.
The market share shifts are consistent with our discussion of AAR in the rates swaps blog linked above. AAR go live in 24 June 2025 probably led some banks to shift volumes to Eurex to meet their 300 trade per year minimum for each of OIS, IRS, and FRA. That blog noted a shift to Eurex in OIS and IRS after Q1 2025 and in FRAs before Q1 2025, which is consistent with the figures above.
Let’s see if CCP shares settle at this level in future editions of this blog.
JPY swaps: LCH versus JSCC
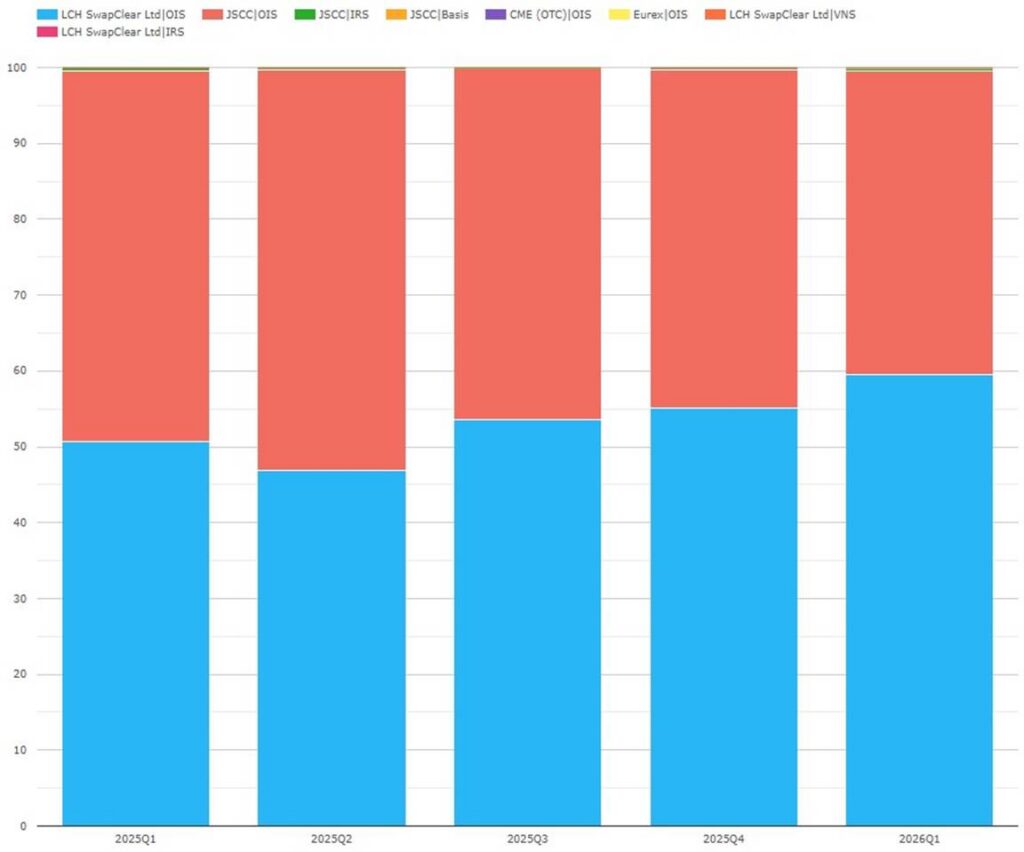
Chart 2: volumes of cleared JPY swaps by CCP and product type (percent of EUR notional). Source: CCPView
Chart 2 shows that LCH’s share of Q1 2026 JPY swaps was 59.5 percent to JSCC’s 40.5 percent. LCH’s share was up 8.8 percent YoY.
- Eurex had 0.0068 percent, having last cleared JPY swaps in Q2 2020.
As noted in the swap competition blog linked above, LCH benefited from last year’s increased buy-side interest in trading JPY swaps while US buy-side firms were restricted from clearing at JSCC until September 2025, when CFTC lifted the restriction.
It’s too early to tell but Q1 2026 weekly figures indicate an upward intra-quarter trend in JSCC market share.
CNY swaps: Shanghai Clearing versus LCH
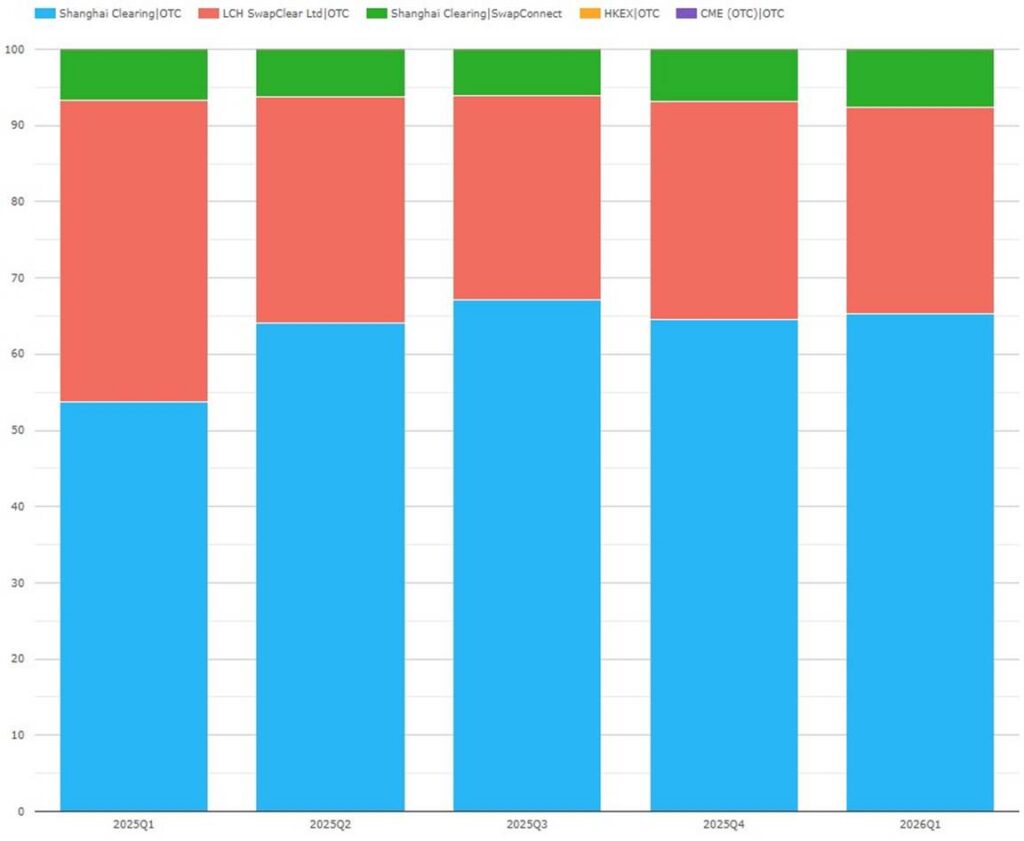
Chart 3: volumes of cleared CNY swaps by CCP and exchange (percent of CNY notional). Source: CCPView
Chart 3 shows that SCH, including direct clearing and via Swap Connect, had share of Q1 2026 cleared CNY swaps of 73.0 percent to LCH’s 27.0 percent. SCH’s share was up by 12.6 percent YoY.
- HKEx had 0.031 percent – up YoY from 0.024 percent.
Swap Connect enables participants offshore from China to clear deliverable CNY swap at SCH which they could not do otherwise. Therefore, volumes from Swap Connect are incremental to SCH’s direct cleared volumes, not substitutes for them.
INR swaps: LCH versus CCIL
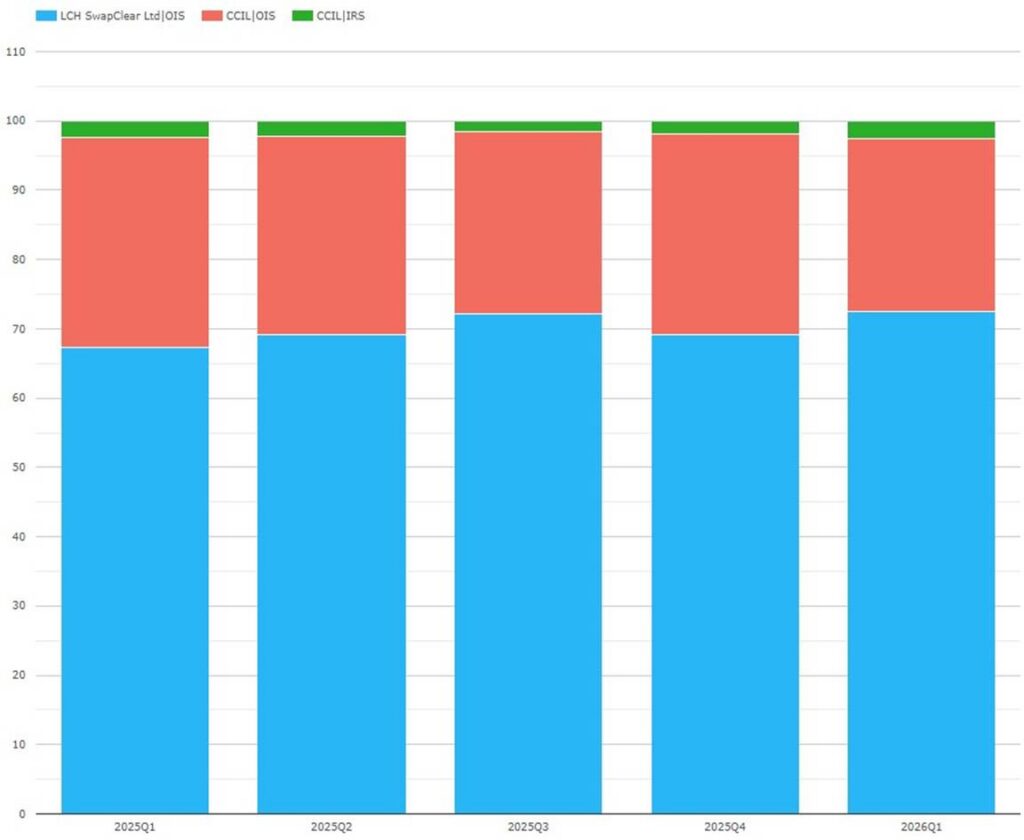
Chart 4: volumes of cleared INR swaps by CCP and product type (percent of INR notional). Source: CCPView
Chart 4 shows that LCH’s share of Q1 2026 INR swaps was 72.5 percent to CCIL’s 27.5 percent. LCH’s share was up by 5.2 percent YoY.
I wonder here whether buy-side interest in INR is also driving the (more moderate) trend, as it has at JSCC.
USD SOFR futures: CME versus FXM/LCH
We focus here only on SOFR futures, which is where all the USD MM futures competition is. Other USD MM futures products are currently only offered by CME – the most voluminous being FedFunds futures, which amount to about 40 percent of SOFR futures notional volumes.
CME remains dominant with over 99 percent of notional volumes, but FMX/LCH’s volumes show exponential growth that is better understood via numerical grids than charts.
SOFR futures by exchange/CCP. Source: CCPView
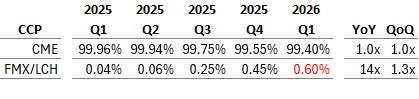
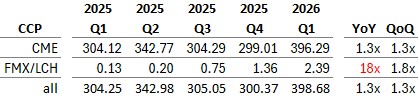
Table 1: market share (percentage of notional)
Table 2: Volumes (notional USD trillions)
Table 1 shows that FMX/LCH’s market share was 0.60 percent – up 14x YoY and up 1.3x QoQ. Table 2 shows that FMX/LCH’s Q1 2026 volumes were $2.39 trillion – up 18x YoY and up 1.8x QoQ.
FMX and LCH hope that cross-margining FMX/LCH SOFR futures versus LCH cleared rates swaps will enable them to overcome the liquidity dominance of CME. Market participants’ open derivatives portfolios vary in size, but many will have much bigger swap portfolios at LCH than they have at CME. Sometimes this should make trading SOFR futures at FMX benefit from reduced LCH IM. If true competition is reached, participants might need margin analytics to make pre-trade choices of exchange for their SOFR futures trades.
Such exponential growth will inevitably slow one day but only time will tell when and by how much. It seems likely that FMX/LCH will approach a one percent share during 2026. A longer-term target of 5 percent would constitute true competition.
EUR Euribor and EONIA futures: LCH versus Eurex
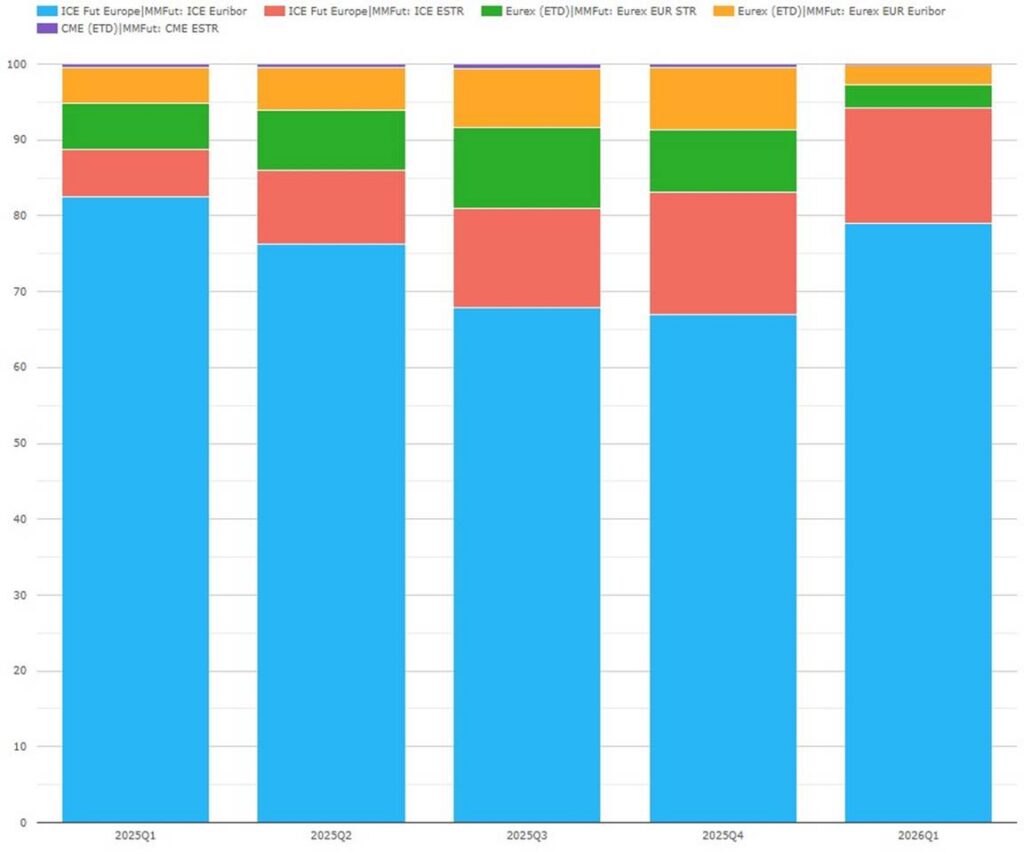
Chart 5: volumes of EUR MM futures by exchange/CCP and index (percent of EUR notional). Source: CCPView
Chart 5 shows that ICE’s share of Q1 2026 EUR MM futures was 94.2 percent to Eurex’s 5.6 percent. ICE’s share was up YoY from 88.7 percent, while Eurex’s share was down YoY from 10.8 percent.
- CME’s share was 0.15 percent – down YoY from 0.51 percent.
Chart 5 figures can be used to compute shares of futures by index.
- Of Euribor futures, ICE had 96.8 percent (up YoY from 94.6 percent) to Eurex’s 3.2 percent.
- Of EONIA futures, ICE had 82.6 percent (up YoY from 49.1 percent) to Eurex’s 16.6 percent and CME’s 0.79 percent.
ICE’s share was above 90 percent for the first quarter since Q4 2023.
JPY MM futures (TONA): JPX versus TFX versus SGX
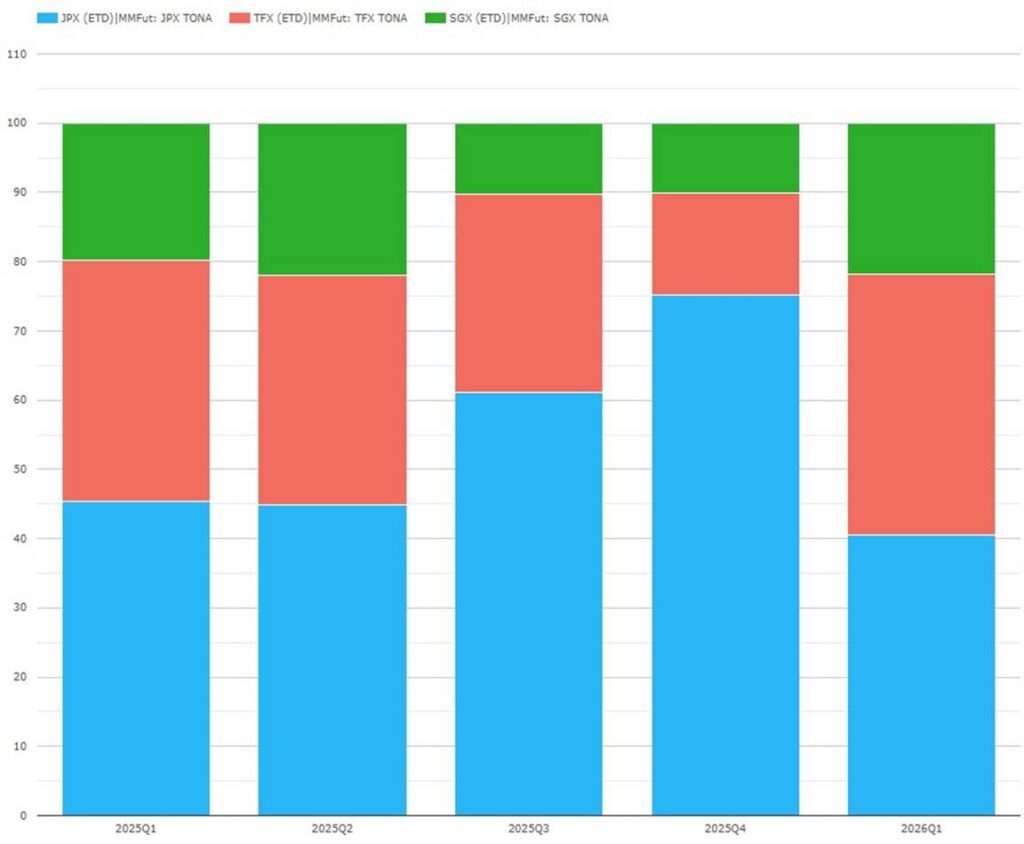
Chart 6: volumes of JPY TONA MM futures by exchange/CCP (percent of JPY notional). Source: CCPView
Chart 6 shows dynamic quarter-by-quarter market share shifts which need to be summarized exchange-by-exchange.
- JPX had 40.6 percent – down YoY by 4.9 percent and down QoQ by 34.5 percent.
- TFX had 37.7 percent – up YoY by 2.9 percent and up QoQ by 22.9 percent.
- SGX had 21.8 percent – up YoY by 1.9 percent and up QoQ by 11.7 percent.
After a dynamic Q3 and Q4 2025, Q1 2026 saw TFX nearly catch JPX, while SGX returned to a share above 20 percent as in Q2 2025, after commencing trading TONA futures only in Q3 2024.
Q1 2026 competition overview
Lastly, I included market share overview charts below. These show how the competitive currencies stand out and also allow look up of the dominant exchange/CCP in cleared swaps and MM futures for currencies not covered above.
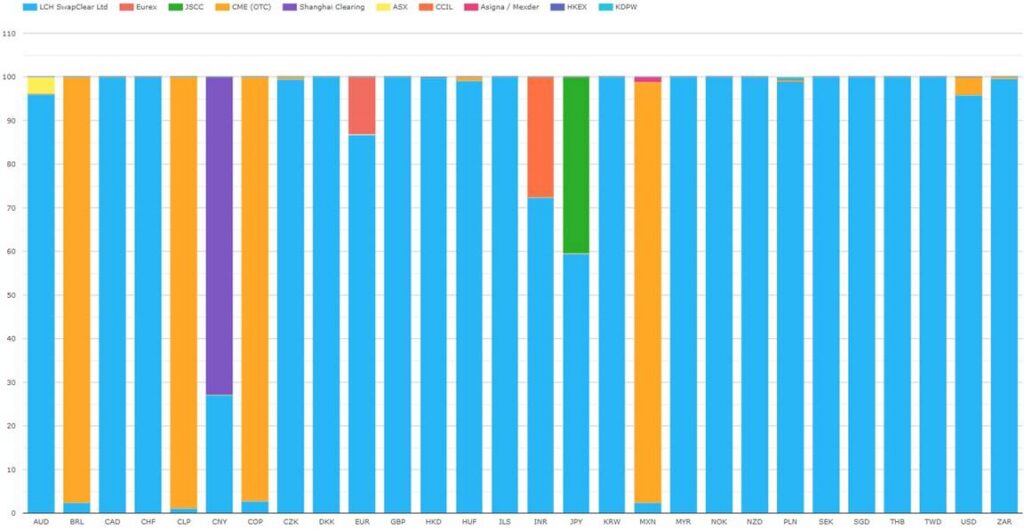
Chart 7: CCP market shares of swap volumes by currency (percent of USD notional). Source: CCPView
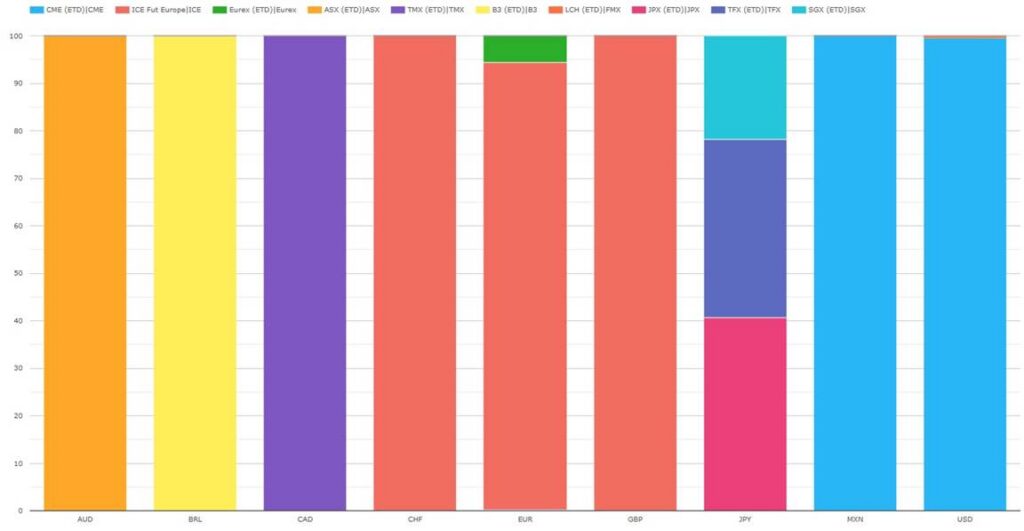
Chart 8: CCP/exchange market shares of MM futures volumes by currency (percent of USD notional). Source: CCPView
That’s it
Flip back to the top to recap the takeaways.
The volumes in CCPView cover many more cleared instruments, metrics, and analysis parameters.
- Cleared instruments also include interest rate swaps, other asset class futures and options, and cash US Treasuries.
- Volume metrics also include new trade count / DV01 / average daily volume (ADV), open interest (OI), OI change, and notional unwound/matured.
- Analysis parameters also include date / week / month / year, exchange, product subtype, tenor, and activity type (D2C or D2D trade).
For more details, please contact us for a CCPView demonstration.