
This blog reviews Q3 2026 US-reported volumes and D2D platform market shares of major currency cross-currency swaps risk-trading, continuing the quarterly series from the Q2 edition.
Key takeaways
In Q3 2026 major currency cross-currency basis swaps:
- Compared to Q1 2026 highs, notional volumes were down 26%, trade counts were down 35%, but average trade size increased by 13%.
- All five major currencies increased average trade size but decreased trade count versus Q1 2026, while AUD was the only currency to increase notional volume versus Q1 2026.
- EUR led in notional volume, JPY led in trade count, and CAD led in average trade size.
- GBP (up 48%) and AUD (up 17%) were the only currencies with year-on-year (YoY) increases in notional volume, each driven heavily by increased average trade size.
- Tullett Prebon (Tulletts) led in overall major currency D2D platform share of trade DV01 with 54.8%, while YoY BGC gained 4.7%, ICAP gained 2.3%, Tulletts gained 1.1%, and Tradition (Trads) lost 8.0%.
Read on for supporting analysis of charts and data created in SDRView.
Blog scope
We continue to focus on US-reported major currency cross-currency basis swaps risk trading. In Q1 2026, this subset was 86.1% of the total after excluding 5.7% of fixed-fixed and fixed-float swaps, 8.1% of non-major currency basis swaps and 0.1% of major currency basis swap compressions (which are not risk-trading). Similar splits occurred in Q3 2026, though I note that cross-currency basis swap compressions were no longer reported after July.
We use SDRView to aggregate trade notional, trade DV01, and trade count and to compute average trade size from US-reported trades, which are a large representative subset of global market volumes.
Volumes by major currency
Note: throughout the blog, for example, “AUD cross-currency swaps” is shorthand for “USD versus AUD cross-currency swap”.
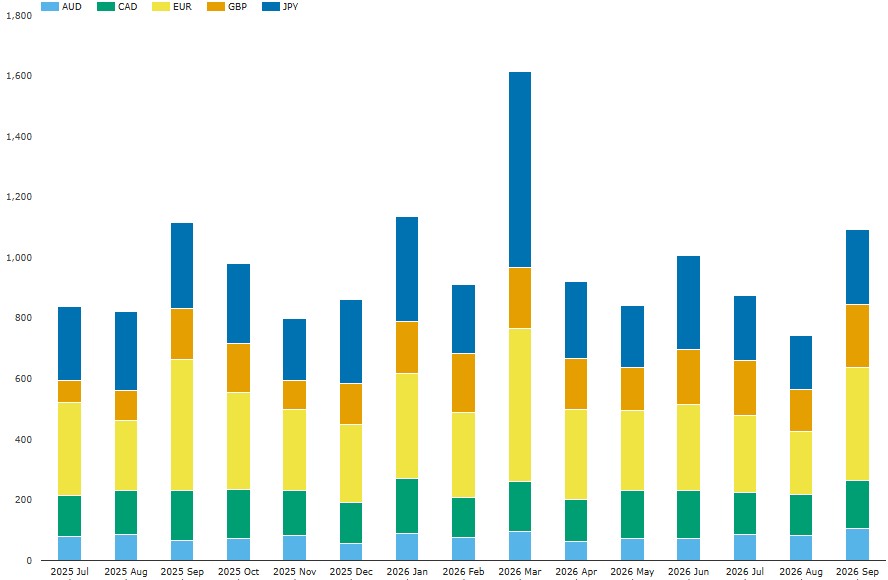
Chart 1: Volumes of US-reported major currency cross-currency basis swap risk-trading (notional USD billions). Source: SDRView
Chart 1 shows that Q3 2026 monthly notional volumes continued at 2025-like levels after the exceptional March 2026 numbers. Aggregating to quarter-level, Q3 2026 notional volumes were $2.71 trillion – down 26% from the Q1 2026 high of $3.66 trillion and down 2.3% YoY.
- EUR was largest with $833 billion – down 27% from the Q1 2026 high of $1.14 trillion.
- JPY was next with $636 billion – down 48% from the Q1 2026 high of $1.22 trillion.
- GBP had $535 billion – down 6.0% from the Q1 2026 high of $569 billion but up 56% YoY.
- CAD saw $432 billion – down 9.9% YoY from the Q1 2026 high of $479 billion.
- AUD showed a new high of $274 billion – up 6.1% from the Q1 2026 high of $259 billion and up 17% YoY.
We see steeper declines when we look at the same activity by trade count.
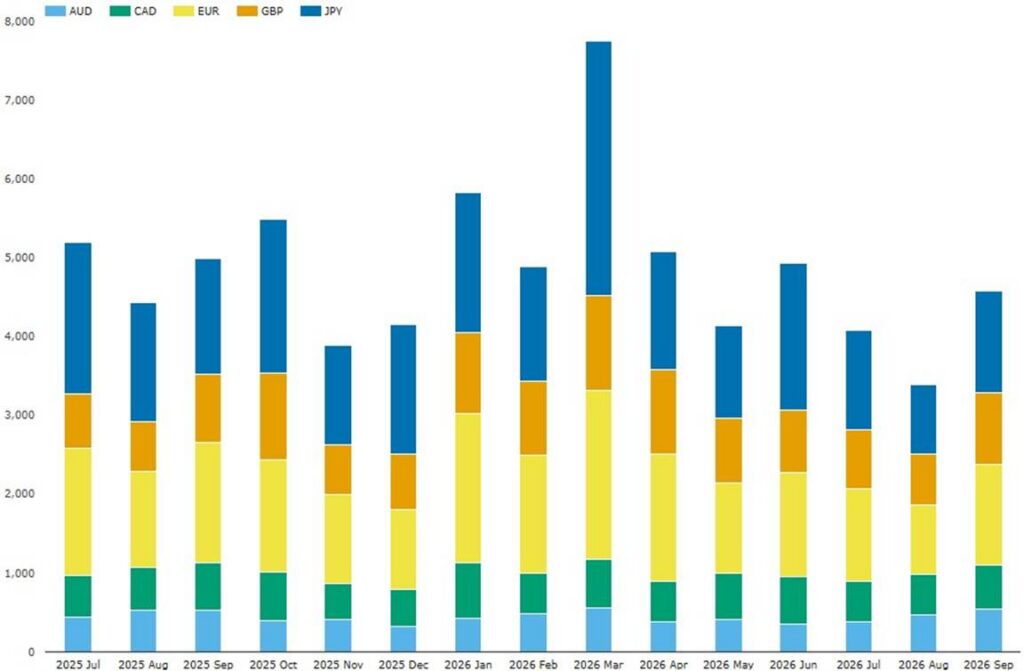
Chart 2: Volumes of US-reported major currency cross-currency basis swap risk-trading (trade count). Source: SDRView
Chart 2 shows that Q3 2026 monthly trade counts continued at 2025-like levels after the exceptional March 2026 numbers. Aggregating to quarter-level and rounding counts to the nearest ten for readability, Q3 2026 trade counts were 12,060 – down 35% from the Q1 2026 high of 18,470 and down 17% YoY.
- JPY had the highest trade count with 3,450 – down 47% from the Q1 2026 high of 6,460.
- EUR was next with 3,340 – down 40% from the Q1 2026 high of 5,530.
- GBP saw 2,300 – down 28% from the Q1 2026 high of 3,180 but up 5.9% YoY.
- CAD showed 1,590 – down 13% from the Q1 2026 high of 1,820.
- AUD had 1,400 – down 5.6% from the Q1 2026 high of 1,480.
The steeper declines from Q1 of trade count than notional imply increases in average trade sizes.
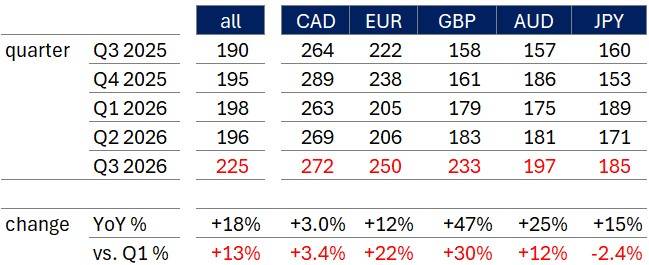
Table 1: Average trade size of US-reported major currency cross-currency basis swap risk-trading ($ millions). Source: SDRView
I calculated average trade sizes by simply dividing notional volumes by trade counts. Table 1 shows that Q3 2026 average trade notional across the five currencies was $225 million – up 18% YoY and up 13% from the Q1 2026 high of $198 million. By currency:
- CAD continued to lead average trade sizes at $272 million – up 3.4% from Q1 2026.
- EUR showed $250 million – up 22% from Q1 2026.
- GBP average trade size grew fastest from Q1 2026 with $233 million – up 30%.
- AUD saw $197 million – up 12% from Q1 2026.
- JPY had $185 million – down 2.4% from Q1 2026 but up 15% YoY.
Note that the above SDRView aggregate trade notionals are below actual values if they include trades that exceed the SDR-reporting notional caps. We track the level of this distortion by tagging capped and uncapped trades.
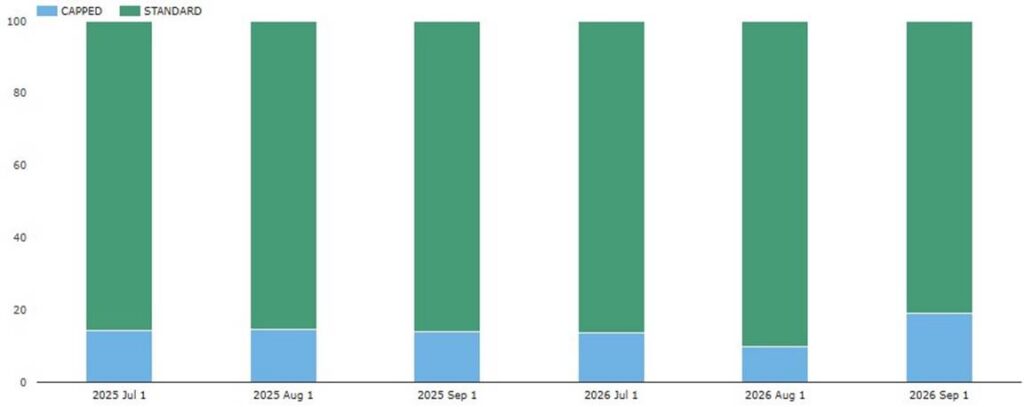
Chart 3: Split between capped and uncapped US-reported major currency cross-currency basis swap risk-trading (percentage of USD notional). Source: SDRView
Chart 3 shows that Q3 2026 month-by-month capped percentages were generally a little higher than in Q3 2025. Calculating at quarter-level, Q3 2026 saw 14.8% of notional from capped trades – up from 14.4% in Q3 2025. Cross-currency swaps are much less capped than, say, rates OIS, which tend to be capped for between 25% to 30% of reported notional volumes.
Platform types and platform shares
Firstly, we look at the volume splits by platform type.
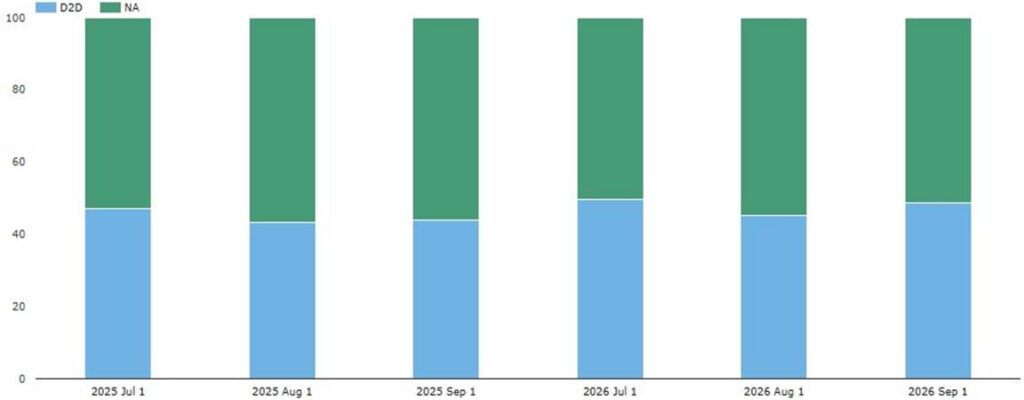
Chart 4: Split by platform type of US-reported major currency cross-currency basis swap risk-trading (percentage of notional). Source: SDRView
Chart 4 shows the D2D versus off-platform split of major currency cross-currency basis swap volumes in the months of Q3 2025 and Q3 2026. We see a noticeable YoY shift toward D2D platforms. Recalculating at quarter level, shows that that D2D platforms share in Q3 2026 was 48.1% – a 3.4-point YoY shift from off-platform (NA) to D2D platforms.
For D2D platform market shares we use traded DV01 as our metric instead of traded notional as platform revenue is often based on traded risk.
To find more reference information about each platform in the chart, google “MIC code XXXX” – where XXXX is platform ID in the chart key.
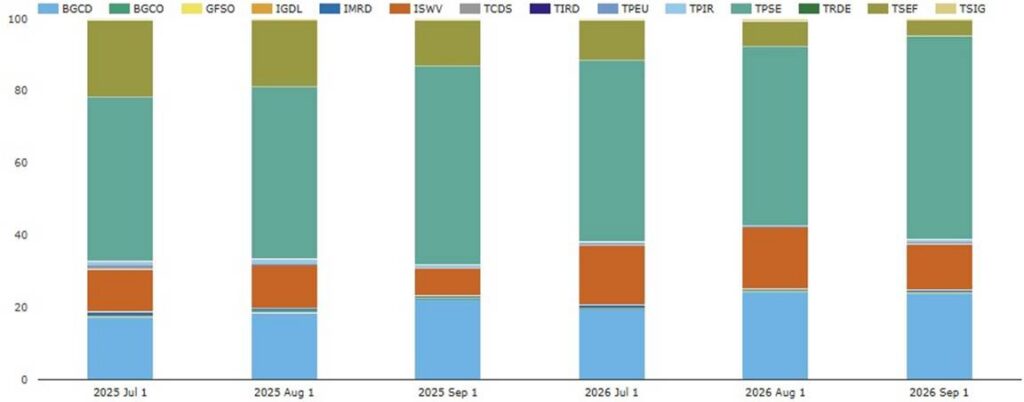
Chart 5: Platform shares of US-reported D2D platform major currency cross-currency basis swap traded risk (percentage of DV01). Source: SDRView
Chart 5 shows the shares of D2D platform major currency cross-currency basis swap traded DV01 traded in the months of Q2 2025 and Q3 2026. Recalculating at quarter level, Q3 2026 D2D platforms’ shares were as follows:
- Tulletts (led by TPSE) had the largest share with 54.8% – up 1.1 points YoY.
- BGC (led by BGCD) had 24.6% – up 4.7 points YoY.
- Trads (led by TSEF) saw 11.9% – down 8.0 points YoY.
- ICAP (led by ISWV) took 8.7% – up 2.3 points YoY.
Summarizing Q3 2026 YoY changes: BGC gained 4.7%, ICAP gained 2.3%, Tulletts gained 1.1%, and Trads lost 8.0%.
Now let’s look at platform shares by currency.
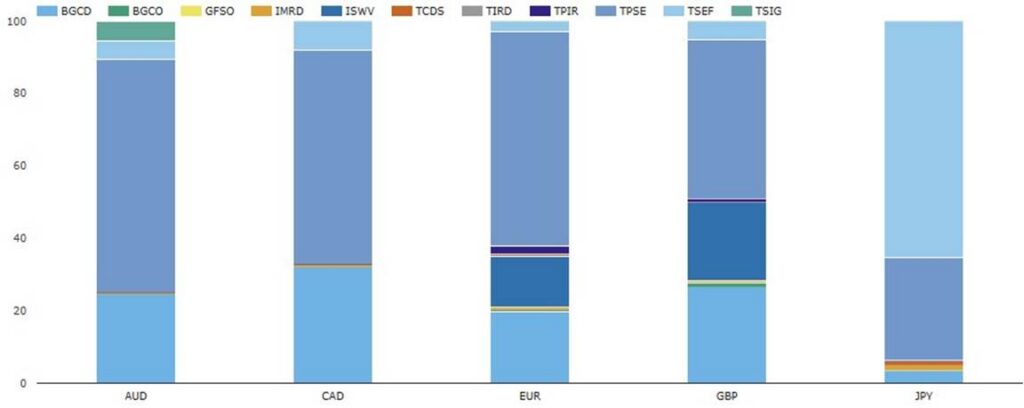
Chart 6: Q3 2025 platform shares per currency of D2D platform major currency cross-currency basis swaps traded risk (percentage of DV01). Source: SDRView
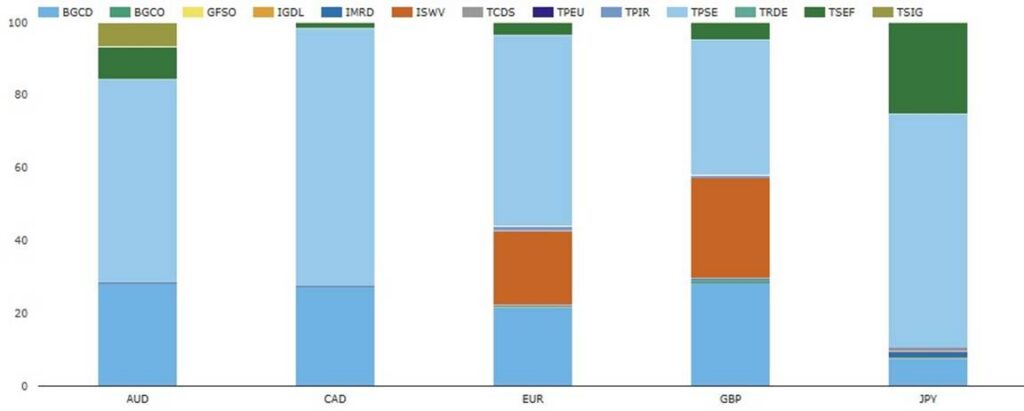
Chart 7: Q3 2026 platform shares per currency of D2D platform major currency cross-currency basis swap traded risk (percentage of DV01). Source: SDRView
Note: the color coding is slightly inconsistent between Charts 5 and 6. Hopefully the explanation below clarifies the comparison.
Charts 6 and 7 show that Tulletts (mainly TPSE) had the leading share in each currency and had more than half the trading activity in each currency except GBP. Tulletts’ share in each currency dramatically changed YoY in Q3 2026 (pale blue in Chart 7) from Q3 2025 (mid-blue in Chart 6):
- In AUD, Tulletts’ share (including TPSE and TSIG) decreased by 7.4 points to 62.6%, while BGC’s second-place share increased by 3.6 points to 28.4%, and Trads’ share increased by 3.8 points to 8.9%.
- In CAD, Tulletts’ share increased by 11.9 points to 71.0%, while BGC’s second-place share decreased by 4.8 points to 27.3%, and Trads’ share decreased by 6.4 points to 1.7%.
- In EUR, Tulletts’ share decreased by 8.3 points to 53.9%, while BGC’s second-place share increased by 1.5 points to 21.8%, and ICAP’s share increased by 6.1 points to 20.9%.
- In GBP, Tulletts’ share decreased by 6.9 points to 37.9%, while BGC’s second-place share increased by 1.1 point to 29.0%, and ICAP’s share increased by 6.0 points to 28.2%.
- In JPY, Tulletts’ share increased by 35.8 points to 65.5%, while Trads’ second-place share decreased by 40.3 points to 25.0%, and BGC’s share increased by 4.1 points to 7.7%.
In summary, Tulletts had large percentage gains in JPY and CAD mainly from Trads which more than offset 7- or 8-point share losses in EUR, GBP, and AUD which benefited BGC and ICAP.
End note
Skip back to the top to reread the key takeaways if you like.
We used seven charts and one table for a complete overview, but there is much more in SDRView.
Please contact us for information on our data products, or for more details on any of the above analysis.