
This blog looks at the market shares of swaps and futures customer segregated margin requirements (swaps seg and futures seg) of US-regulated derivatives clearing brokers (FCMs) at the end of Q3 2026.
Key takeaways
At the end of Q3 2026, the biggest year-on-year (YoY) changes in swaps seg market share were:
- North America banks gave up 3.9% while Europe banks gained 3.8% YoY and brokers gained 0.1%.
- Barclays (which moved from fifth to second place), BNPP, Citi, Wells, UBS, and DB combined gained 5.1%, while MS, BofA, GS, and JP combined gave up 5.1%.
- At the end of Q3 2026, the biggest year-on-year (YoY) changes in futures seg market share were:
- North America banks gave up 2.8% of futures seg, brokers gave up 0.4%, Europe banks added 2.5%, APAC banks added 0.7%, and digital and prediction brokers combined added 0.025%.
- Barclays, GS, SG, and BofA combined gained 2.0%, ten other banks combined picked up 2.4%, and JP and Citi combined gave up 4.1%.
- Read on for the supporting analysis.
Clearing broker market shares
Derivatives client clearing brokers make their revenue largely from ticket fees and margin spread. Rates for ticket fees and margin spread can vary by FCM and by individual client. Nonetheless, FCM shares of trade counts and seg are reasonable proxies for FCM shares of ticket fees revenue and margin spread revenue, respectively.
Client trade counts by FCM are not publicly available but we have total futures and swaps client IM balances by FCM from monthly publication by CFTC. It is reasonable to expect correlation between seg and ticket counts, barring extreme distributions of client trading approaches by FCM (for example, one FCM has only clients which trade risk flat, while another has only clients that trade buy and hold). Therefore, shares of FCM seg balances are a reasonable but imperfect proxy for shares of US clearing broker revenue.
Swaps seg
We chart swaps seg balances by G14 bank-owned FCM.
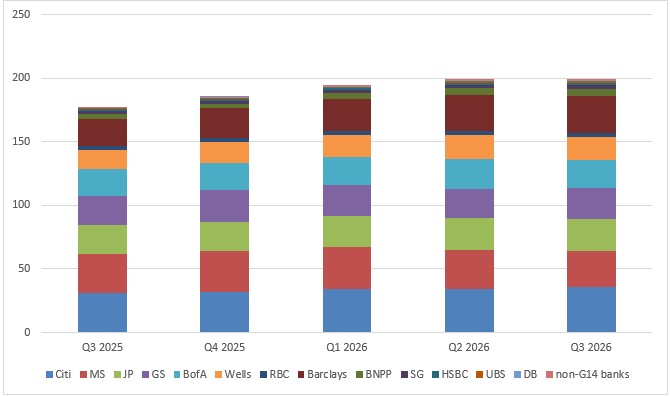
Chart 1: quarter-end FCM swaps seg by FCM (USD billions). Source: CFTC, author analysis
We see aggregate swaps seg of $199 billion at the end of Q3 2026 – up 12.5% YoY and flat QoQ.
- The top seven FCMs (owned by six banks from the US plus Barclays) each had more seg than all other G14 banks combined. The seven combined had $183 billion of swaps seg – up 10.5% YoY but down 0.6% QoQ.
- Other G14 bank FCMs had $16.0 billion – up 39% YoY and up 9.6% QoQ.
- Though invisible at this scale, I included non-G14 bank FCMs as a combined group, which had $329 million of swaps seg – up 3.9x YoY and up 22% QoQ.
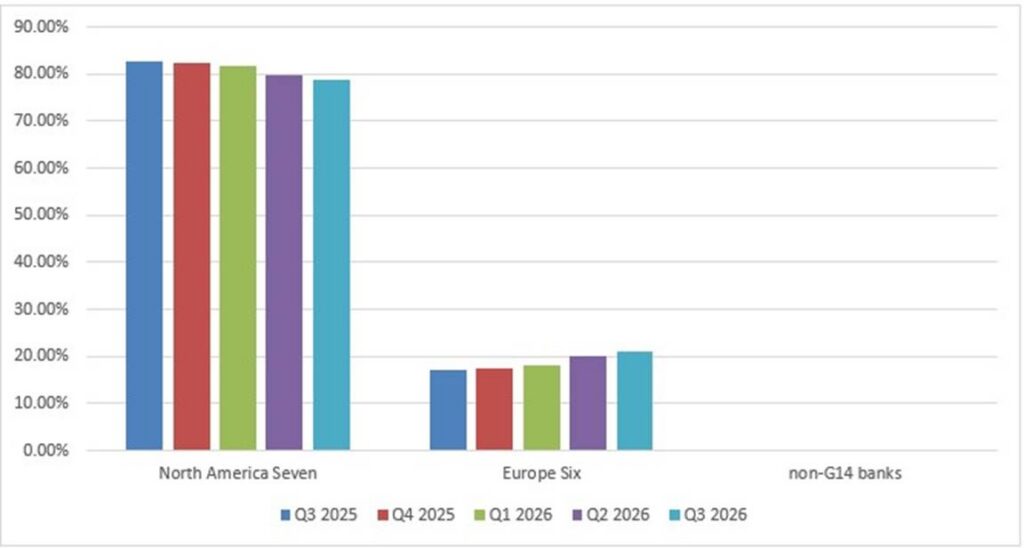
Chart 2: quarter-end FCM swaps seg share by FCM group (percentage of swaps seg requirement). Source: CFTC, author analysis
Chart 2 groups together the FCMs into the “North America Seven” G14-bank-owned CMs, the “Europe Six” G14-bank-owned FCMs and “non-G14 banks”, meaning all other FCMs. The missing G14 bank is Credit Suisse (CS), which withdrew from FCM clearing in 2021 (before the merger with UBS).
At the end of Q3 2026, the share of the North America Seven had continued its recent downward trend to 78.9% – down 3.9 points YoY and down 0.9 points QoQ, while the share of the Europe Six was 20.9% – up 3.8 points YoY and up 0.8 points QoQ.
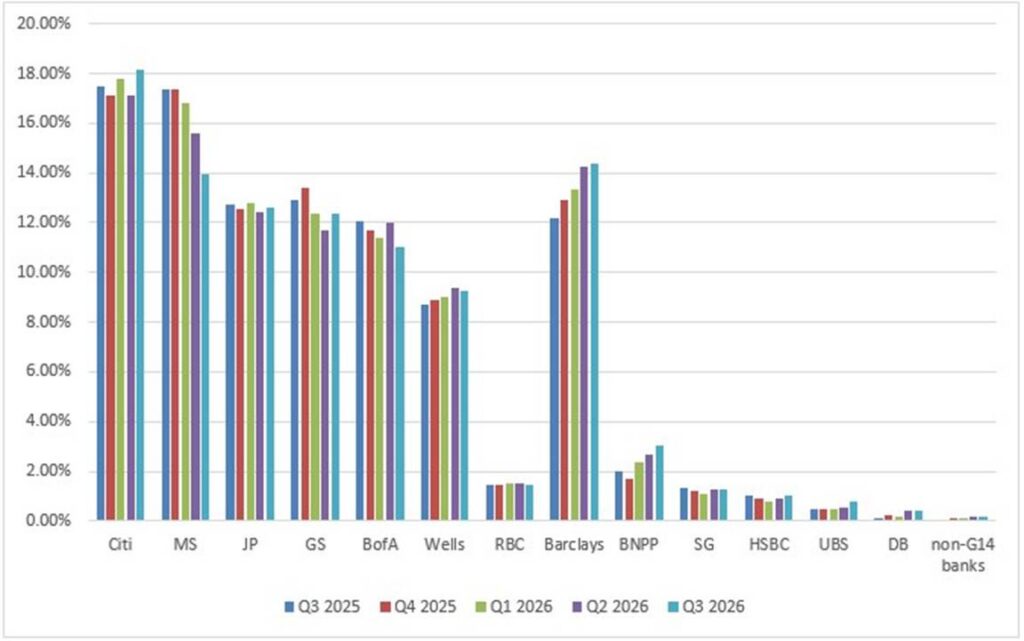
Chart 3: quarter-end FCM swaps seg share (percentage of swaps seg requirement). Source: CFTC, author analysis
Chart 3 breaks out Chart 2 to individual G14 bank. The top seven FCMs (six from the US plus Barclays) each exceeded 9% share of swaps seg at the end of Q3 2026, while the top seven combined had 91.8% – down 1.7 points YoY and down 0.7 points QoQ.
The North America Seven’s 3.9-point YoY share reduction noted under Chart 2 broke out as follows:
- Citigroup (Citi) gained 0.7 points for 18.2%.
- Wells Fargo (Wells) put on 0.5 points for 9.3%.
- Morgan Stanley (MS) lost 3.4 points at 14.0%.
- Bank of America (BofA) went down 1.0 points at 11.0%.
- Goldman Sachs (GS) lowered by 0.6 points at 12.4%.
- JP Morgan (JP) reduced by 0.1 points at 12.6%.
- Royal Bank of Canada (RBC) was flat at 1.5%.
The Europe Six’s 3.8-point YoY share increase noted under Chart 2 broke out as follows:
- Barclays gained 2.2 points for 14.4%.
- Banque National de Paris / Paribas (BNPP) added 1.0 points for 3.0%.
- UBS put on 0.32 points for 0.79%.
- Deutsche Banks (DB) rose 0.29 points for 0.42%.
- Société Générale (SG) and HSBC were flat at 1.3% and 1.0%, respectively.
The swaps seg ranking of G14 banks changed only as follows: Barclays stepped up from fifth to second place, Morgan Stanley stepped down from second to third, and GS stepped down from third to fifth.
All other FCMs picked up a net 0.14 points YoY, of which 0.11 points went to two brokers, Marex and Wedbush, combined.
To summarize the YoY shift in swaps seg share: Barclays (which moved from fifth to second place), BNPP, Citi, Wells, UBS, and DB combined gained 5.1%, while MS, BofA, GS, and JP combined gave up 5.1%. Brokers Marex and Wedbush combined gained 0.11%.
Futures seg balances
We can do a similar analysis on exchange traded derivatives customer segregated margin requirements (futures seg), which CFTC provides in the same monthly datasheet.
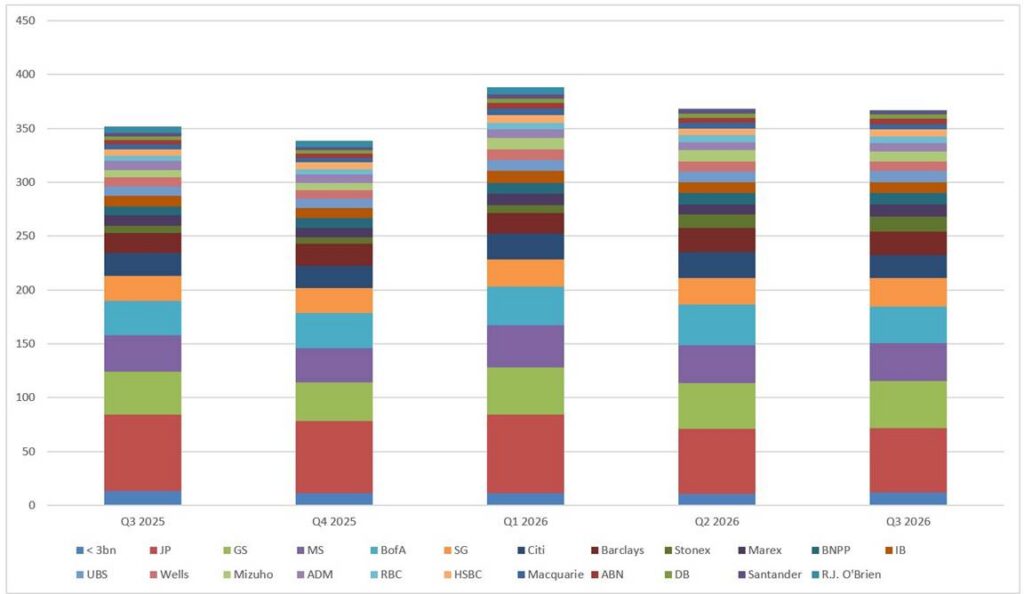
Chart 4: quarter-end FCM futures seg by FCM (USD billions). Source: CFTC, author analysis
- Chart 4 shows that customer futures seg was $367 billion at the end of Q3 2026 – up 4.3% YoY but down 0.27% QoQ.
- The top seven FCMs combined had $242 billion or 66% of futures seg – down 2.0 points YoY and down 1.0 points QoQ.
- Ten other bank-owned FCMs and four brokers each exceeded $3 billion of futures seg and combined for $113 billion or 30.7%– up 2.6 points YoY and up 0.7 points QoQ.
- 56 FCMs below $3 billion of futures seg totaled $11.6 billion or 3.2% – down 0.5 points YoY but up 0.3 points QoQ.
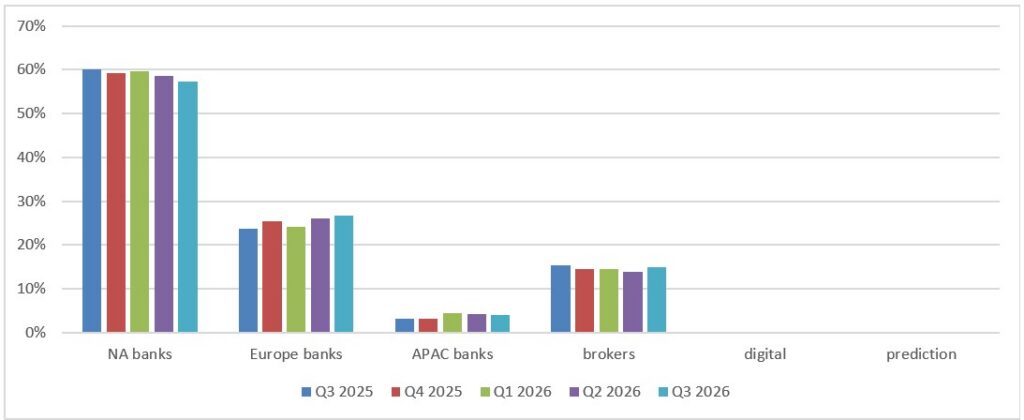
Chart 5: quarter-end FCM futures seg share by FCM group (percentage of futures seg requirement). Source: CFTC, author analysis
Chart 5 shows material shares of futures seg for FCM groups that are not material in swaps seg, namely Asia Pacific (APAC) banks and (non-bank) traditional brokers. Up and coming digital and prediction brokers have yet to establish material shares. YoY share changes were as follows:
- North America (NA) banks’ futures seg share was 57.2% (compared with 78.9% of swaps seg) – down 2.8 points YoY and down 1.3 points QoQ.
- Europe banks’ share increased to 26.6% – up 2.5 points YoY and up 0.4 points QoQ.
- APAC banks had 3.9% – up 0.7 points YoY but down 0.3 points QoQ.
- Traditional brokers had 15.0% – down 0.4 points YoY but up 1.2 points QoQ.
- Digital brokers (Coinbase) had 0.067% or $244 million – up 0.019 points or 1.4x YoY and up 0.027 points or 1.7x QoQ.
- Prediction markets (Kalshi and Fanduel combined) had 0.0054% or $20 million – a jump from zero coming from Kalshi’s first reporting in Q3.
- In summary YoY, North America banks gave up 2.8% of futures seg, brokers gave up 0.4%, Europe banks added 2.5%, APAC banks added 0.7%, and digital and prediction brokers combined added 0.025%.
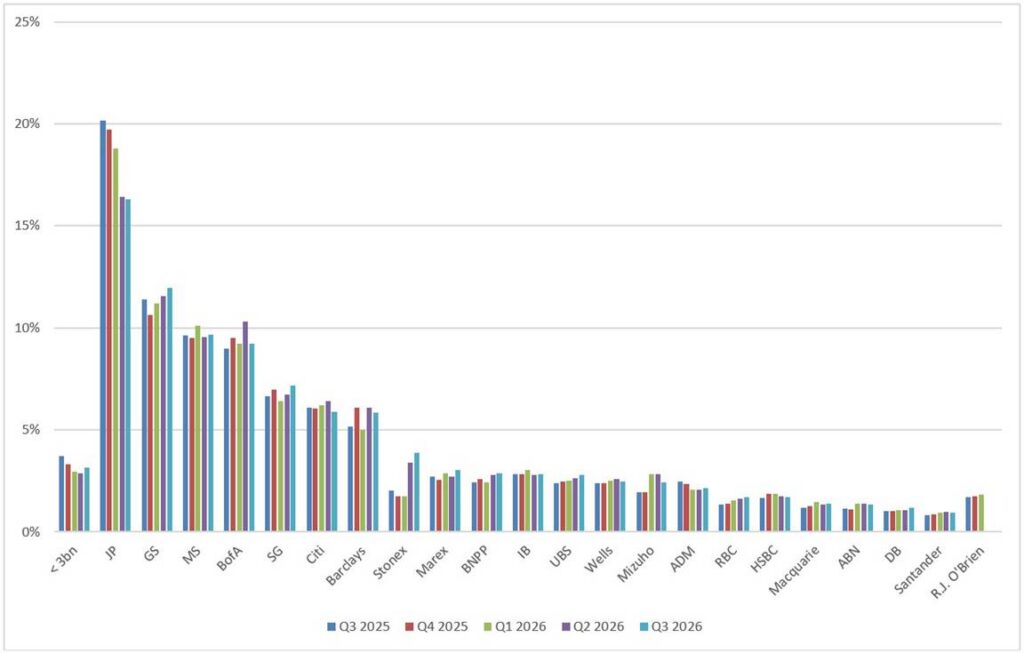
Chart 6: quarter-end FCM customer futures seg requirement share showing the five-quarter trend (percentage of futures seg requirement). Source: CFTC, author analysis
Chart 6 shows that in Q3 2026 the seven largest FCMs by futures seg (the same as the top seven FCMs by swap seg with SG substituted for Wells) each had more than 5% share and were collectively down 2.0 points YoY to 66.1% share, which broke out as follows:
- Barclays was up 0.7 points to 5.8% but down 0.3 points QoQ.
- GS was up 0.55 points to 12.0%.
- SG was up 0.52 points to 7.2%.
- BofA was up 0.3 points to 9.2% but down 1.1 points QoQ.
- MS was flat YoY at 9.7%.
- JP was down 3.9 points to 16.3%.
- Citi was down 0.2 points to 5.9%.
A further ten bank-owned FCMs each of which had more than $3 billion futures seg and rose YoY by a combined 2.4 points YoY to 18.8%.
Brokers overall lost out YoY by 0.4 points for a 15.0% share, but picked up 1.2 points QoQ, mainly at Stonex (up 0.5 points) and Marex (up 0.4 points).
To summarize the YoY shift in futures seg share: Barclays, GS, SG, and BofA combined gained 2.0%, ten other banks combined picked up 2.4%, JP and Citi combined gave up 4.1%.
End note
Six charts covered the CFTC published FCM seg balances and FCM market share in depth.
Skip back to the top to reread the key takeaways if you like.