
This blog is the Q3 2026 edition of our quarterly blog on volumes of US-reported OTC equity derivatives (EQD). As in the Q2 edition, we focus on the big six TRS by volume (G4 plus CNY and HKD).
Key takeaways
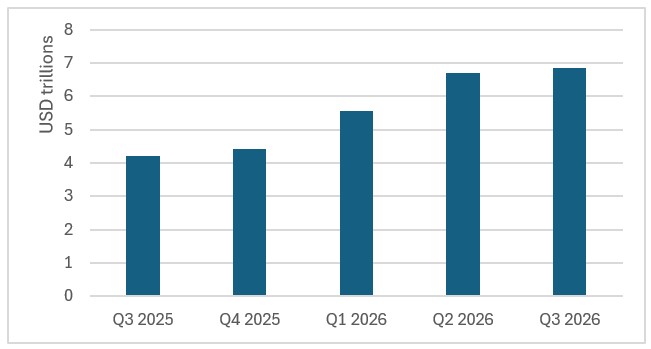
The chart shows combined big-six-currency volumes of equity TRS, which edged up 2.0% to a new high of $6.84 trillion and were up 63% year-on-year (YoY).
- USD TRS were up 84% YoY to a new high of $4.37 trillion (up 5.4% from the Q2 high).
- EUR TRS were up 39% YoY to $939 (down 2.6% from the Q2 high).
- CNY and HKD combined were up 22% YoY to $533 billion (down 14% from the Q2 high).
- JPY TRS were up 86% YoY to $519 billion (down 2.1% from the Q2 high).
- GBP TRS were up 13% YoY to a new high of $482 billion (up 6.5% from the Q2 high).
Read on for the charts and tables created in SBSDRView, which collects data from the US security-based swap data repositories (SBSDRs) which capture trades reported by participants according to US SEC regulation.
Discussion of focus
First let’s check the split of Q3 EQD volumes.
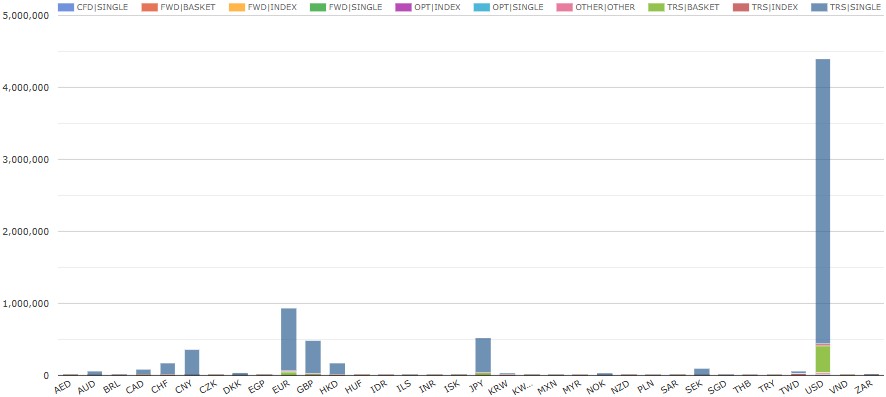
Chart 1: Q3 2026 US-reported EQD volumes by currency, product, and subtype (notional USD millions). Source: SBSDRView
Chart 1 illustrates that non-TRS other products (contracts for difference (CFDs), options (OPT), forwards (FWD) and other (OTHER)) were barely visible in the chart with only 0.80% of the total $7.55 trillion notional volume of Q3 2026 US-reported EQD. TRS were 99.2% of the total of which:
- The big six currencies were 90.6% – USD was 57.8%, EUR 12.4%, JPY 6.9%, GBP 6.4%, CNY 4.7%, and HKD 2.3%.
- The next eight currencies were 7.6% – CHF, SEK, CAD, AUD, TWD, DKK, NOK, and KRW.
- The remaining twenty currencies were 1.0%.
- By product subtype, single-names were 91.6%, baskets 6.8%, and indexes 0.9%.
Note that US SBSDRs limit trades reported to those with a US party on one or both sides. The fraction of global TRS volumes involving US parties is generally larger for Americas and European currencies. This means the Asian currency percentages above are likely to underestimate those currencies’ true share of global EQD volumes.
If like me you had imagined that equity TRS were mostly index or custom basket trades, the dominance of single-names may be surprising. In fact, single-names’ share of TRS has risen over time – averaging 85%, 88%, 88%, 91% in 2023, 2024, 2025, and 2026 to the end of October. Compared with trading the single stock, single-name TRS have the advantage that they bundle the equity exposure with the secured funding in a single instrument, which can be appealing to buy side firms.
In the remainder of this blog, we limit analysis to TRS in the big six currencies. We also combine CNY and HKD together since leading mainland Chinese companies may list in HKD on HKEx as well as in CNY on mainland exchanges.
USD TRS
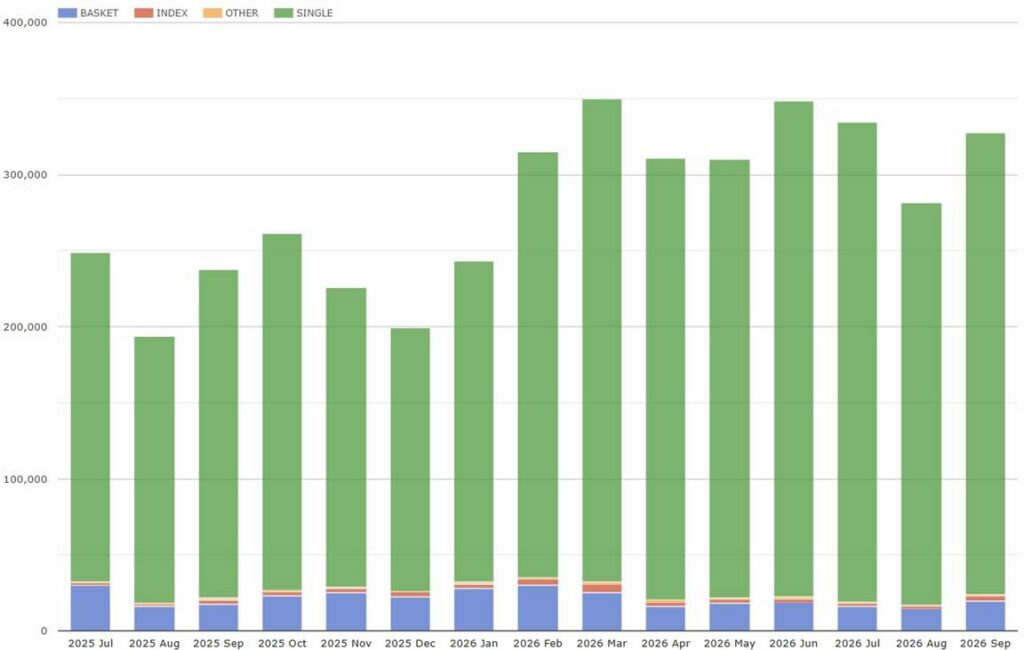
Chart 2: US-reported USD TRS volumes by subtype (notional USD millions). Source: SBSDRView
Chart 2 illustrates the breakdown by month of the total USD TRS volume in Q3 2026 of $4.37 trillion – up 5.4% from the Q2 high of $4.14 trillion and up 84% YoY.
- Single-names were $3.96 trillion – up 6.8% from the Q2 high of $3.71 trillion and up 97% YoY.
- Baskets were up 9.2% YoY.
- While Q3 was a new high, volumes in each month in the quarter were below the June high of $1.67 trillion.
Now we look at the top 10 names in June and September.
Top 10 most actively traded names on USD single-name and basket TRS (ranked by USD notional). Source: SBSDRView
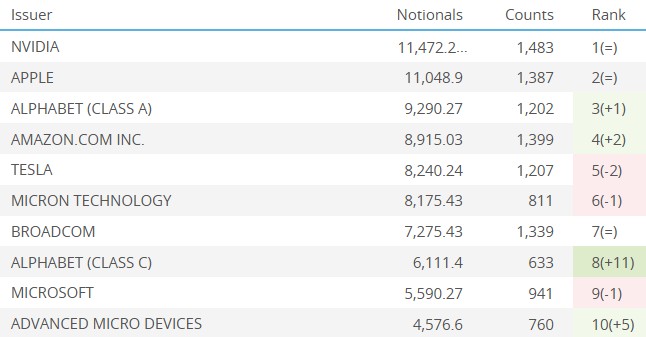
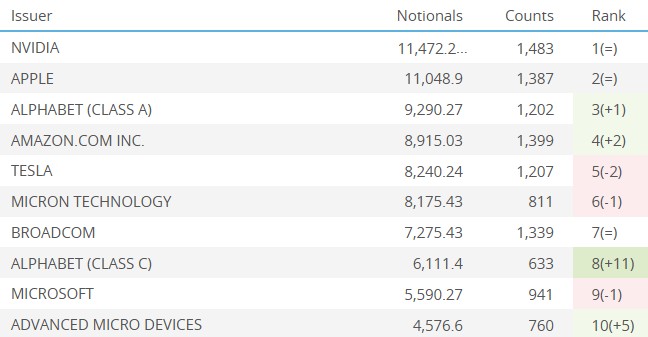
Table 1: June 2026 Table 2: September 2026
As usual, the June 2026 USD top 10 list is dominated by chip-makers, Tesla, big tech, and the S&P 500 index ETF. Seven of the June list featured in the September list, in which Facebook, the S&P 500 index, and Taiwan Semiconductor replaced Micron, Alphabet (Class C) and Advanced Micro from the June list.
EUR TRS
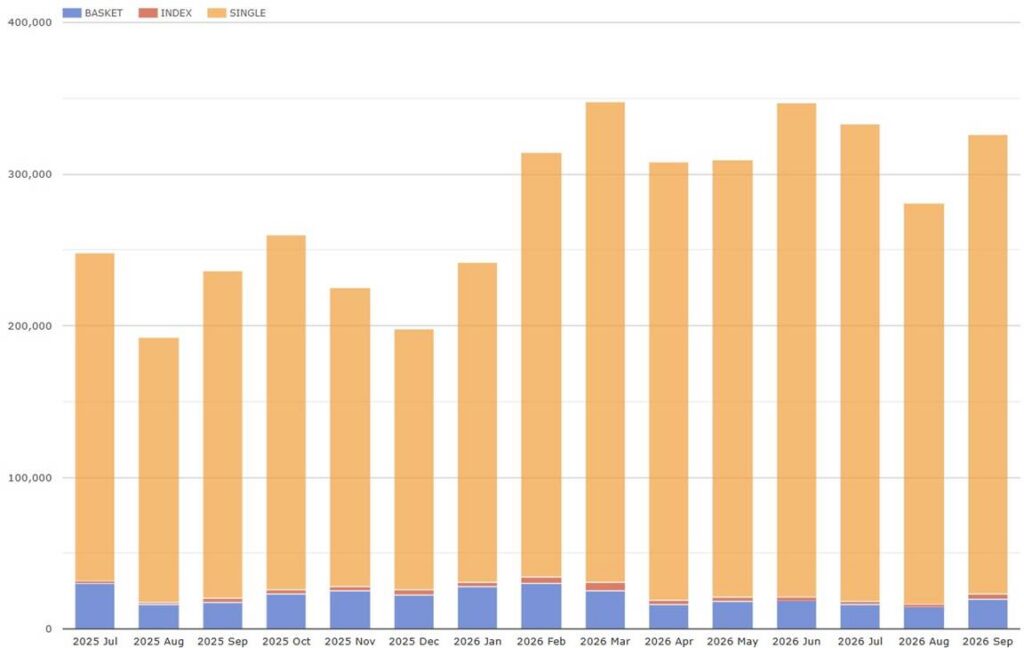
Chart 3: US-reported EUR TRS volumes by subtype (notional USD millions). Source: SBSDRView
Chart 3 illustrates the breakdown by month of the total EUR TRS volume in Q3 2026 of $940 billion – up 39% YoY but down 2.6% from the Q2 high of $964 billion.
- Single-names were $882 billion – up 45% YoY but down 2.4% QoQ the Q2 high.
- Baskets declined QoQ for the second quarter in a row.
- All three months in Q3 were below the March high of $348 billion.
Now we look at the top 10 names in June and September.
Top 10 most actively traded names on EUR single-name and basket TRS (ranked by USD notional). Source: SBSDRView
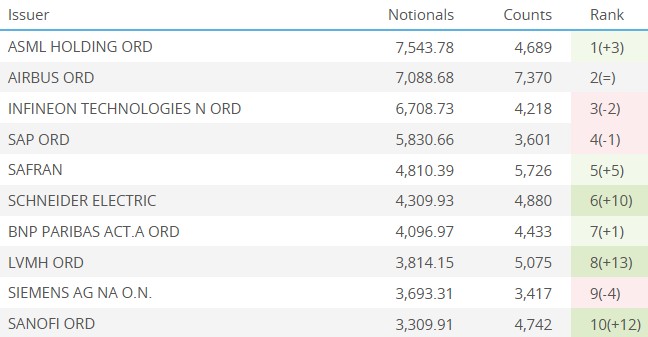
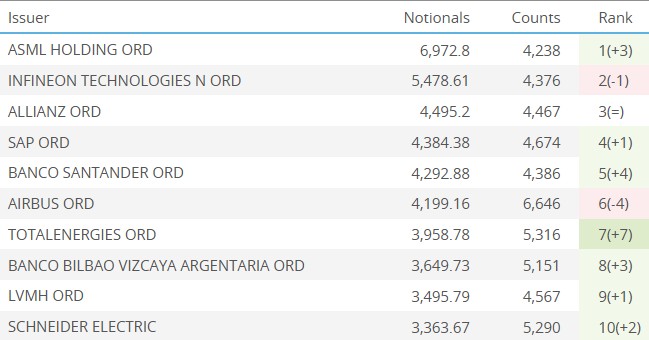
Table 3: June 2026 Table 4: September 2026
Few tech companies made the EUR top 10. Six of the June list also made the September list, in which Allianz, Banco Santander, Totalenergies, and Banco Bilbao replaced Safran, BNP, Siemens, and Sanofi from the June list.
CNY and HKD TRS
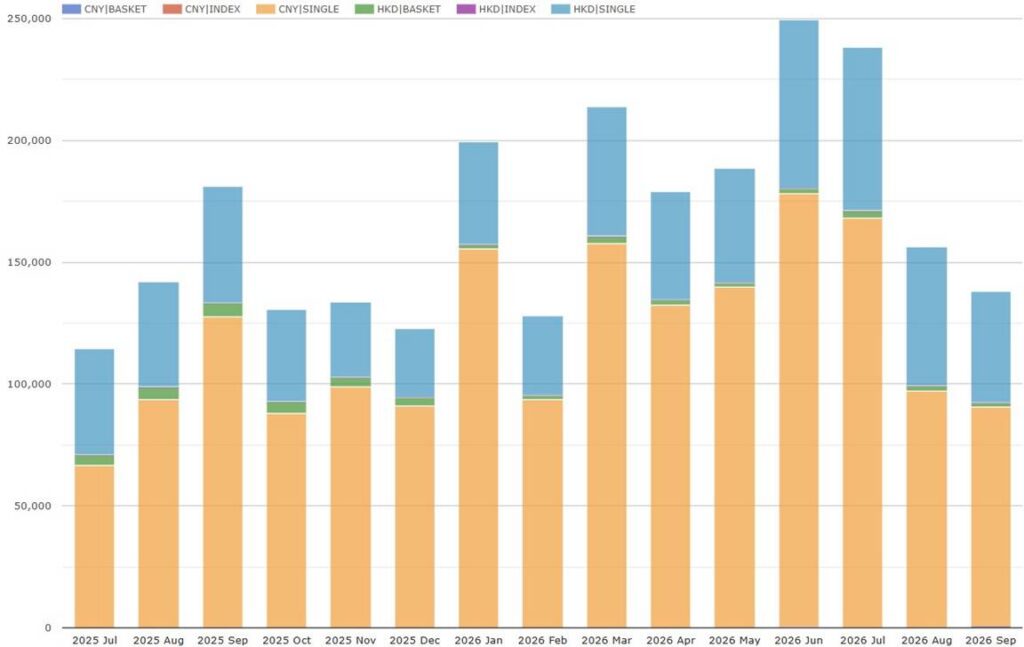
Chart 4: US-reported CNY and HKD TRS volumes by currency and subtype (notional USD millions). Source: SBSDRView
Chart 4 illustrates the breakdown by month of the total CNY and HKD TRS volume in Q3 2026 of $533 billion – up 22% YoY but down 14% from the Q2 high of $617 billion. CNY and HKD combined have outstripped JPY in quarterly volume each quarter since Q3 2025.
- Single-name TRS volumes declined QoQ by 14% while basket TRS rose QoQ by 16%.
- All three months in Q3 were below the June high of $249 billion.
JPY TRS
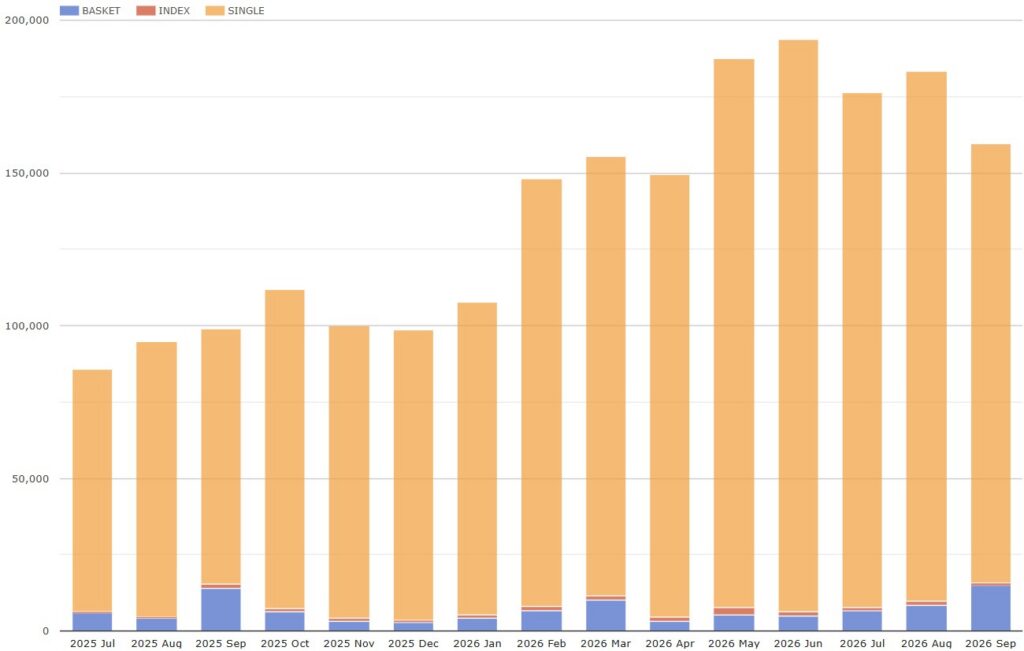
Chart 5: US-reported JPY TRS volumes by subtype (notional USD millions). Source: SBSDRView
Chart 5 illustrates the breakdown by month of the total JPY TRS volume in Q3 2026 of $519 billion – up 86% YoY but down 2.1% from the Q2 high of $531 billion.
- Buried in the QoQ decline, index TRS volumes jumped by 124%.
- All three months in Q3 were below the June high of $194 billion.
Now we look at the top 10 names in June and September.
Top 10 most actively traded names on EUR single-name and basket TRS (ranked by USD notional). Source: SBSDRView
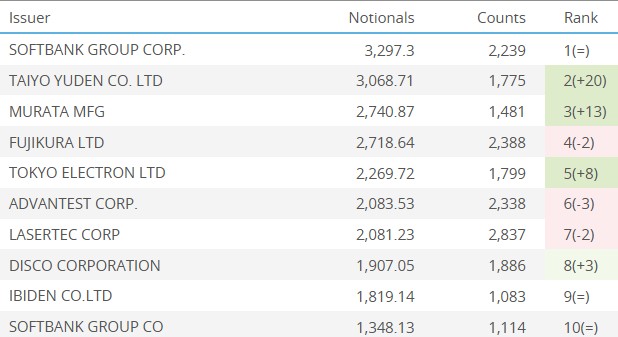
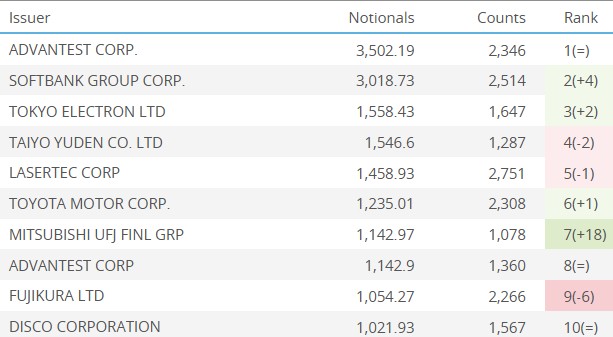
Table 5: June 2026 Table 6: September 2026
Like some other large Japanese corporations, Softbank has more than one separate equity name in the top 100. Softbank’s three names if combined would lead the September list. Other than Softbank, Toyota, and Mitsubishi UFJ, the remaining seven names in the September list are semiconductor or electrical equipment and parts manufacturing companies. From June to September, seven names stayed in the top 10, while Tokyo Yuden, Toyota, and Mitsubishi UFJ replaced Murata, Ibiden, and Softbank Group Co (as distinct from Softbank Group Corp).
GBP TRS
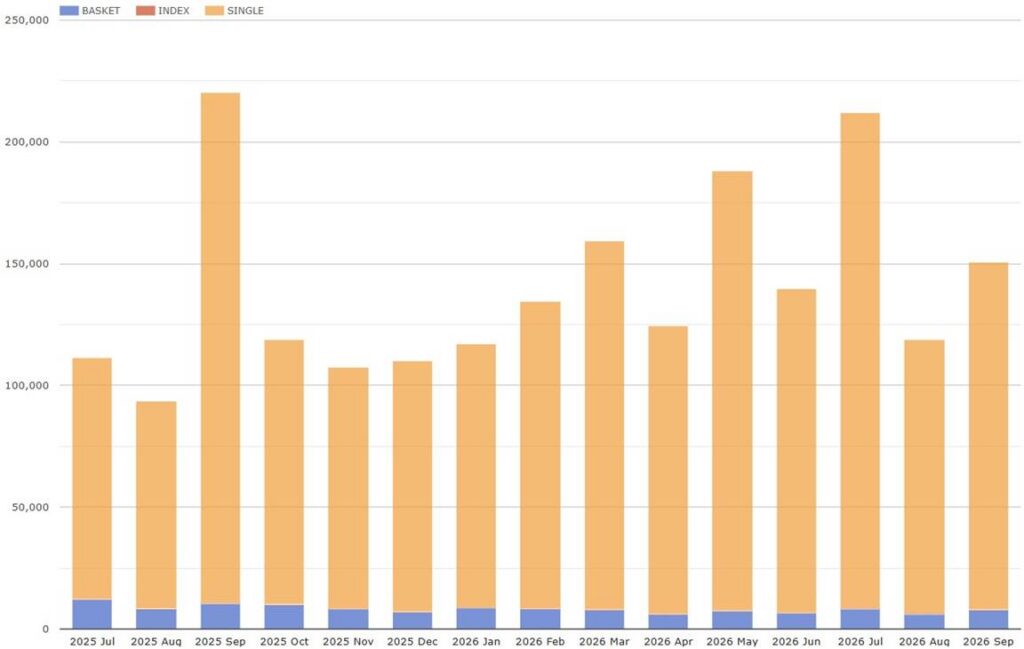
Chart 6: US-reported GBP TRS volumes by subtype (notional USD millions). Source: SBSDRView
Chart 6 illustrates the breakdown by month the total GBP TRS volume in Q3 2026 of $482 billion – up 6.5% from the Q2 high of $453 billion and up 13% YoY.
- Single-names were up 6.3% QoQ while baskets grew by 10% QoQ.
- While Q3 was a new high, monthly volumes in each month were below the September 2025 high of $220 billion.
Now we look at the top 10 names in June and September.
Top 10 most actively traded names on GBP single-name and basket TRS (ranked by USD notional). Source: SBSDRView
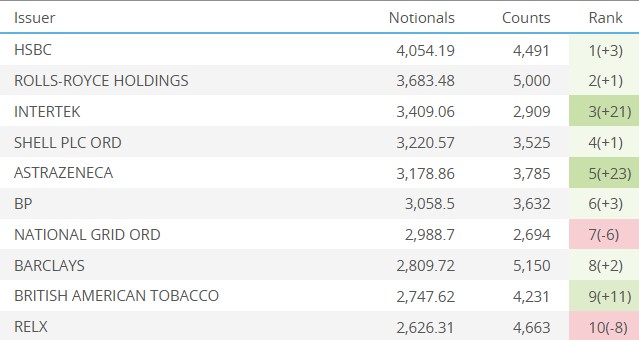
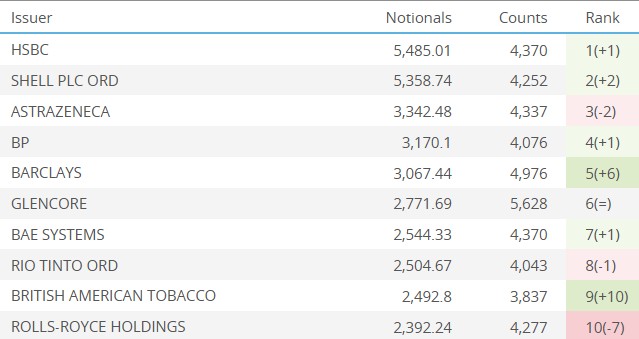
Table 7: June 2026 Table 8: September 2026
The GBP top 10 also contained few tech companies. Seven of the June list featured in the September list, in which Glencore – a commodities and mining group, BAE Systems – a defense, aerospace and security group, and Rio Tinto – a mining group replaced Intertek, National Grid and RELX from the June list.
End note
Seven charts and eight tables gave us an overview of Q2 volumes in Equity TRS, but you can find much more data in SBSDRView. Click the link for more details, or contact us for a demonstration.
Skip back to the top to re-read the key takeaways if you like.