- As in the 2019 blog, Optimizing IM in swaptions, we use days with outsize swaption execution volumes or “spike days” on BGC platforms to show Capitalab rates optimization runs.
- After the CFTC SDR reporting standards upgrade in 2022, we changed SDRView to include platform type and platform ID (among others) – allowing us to attribute trades and trade volumes to specific SEFs, MTFs, and OTFs.
- As a result, this blog shows the 2023 migration of Capitalab runs from BGC’s New York SEF to BGC’s London OTF, and also the increases in run size that accompanied their acquisition by Capitolis in December 2024.
Background
Several points are listed here for convenience. Feel free to skip to the next section now and refer to them later.
According to the ISDA margin survey, uncleared SIMM IM collected exceeded $350 billion at the end of 2024, a large slice of which is incurred by rates derivatives portfolios.
Capitolis kindly confirmed that each of their rates IM optimization runs leads to the execution via BGC of a set of new swaptions and the termination via MarkitWire of the set of swaptions put on in their prior run. Capitolis also confirmed that they typically run one rates IM optimization per month, and would expect their competitors to also run one main rates IM optimization per month.
My 2019 blog highlighted a pattern of monthly swaption spike days executed on BGC’s SEF and reported on SEFView. These were confirmed at the time as arising largely from Capitalab rates IM optimization runs, and we noted at the time that TriBalance and Quantile were direct competition. In addition, an earlier blog in 2019, Reducing Counterparty Risk of Uncleared Derivatives, gives a basic example of how these runs work (see section 4).
CFTC added several fields to the standards used by banks reporting to SDRs in late 2022. We added new fields to SDRView in response to give further analysis capabilities: by platform ID that is, individual SEF or OTF or MTF and by platform type – D2C vs. D2D vs. single dealer platform vs. off platform. The two relevant platform IDs to this blog are:
- “BGCD”, BGC’s New York SEF (legal name: BGC DERIVATIVE MARKETS, L.P.).
- “BGCO”, BGC’s London OTF (legal name: BGC BROKERS L.P.).
SEFView and SDRView volumes are not directly comparable. SEFView captures 100 percent of the volume reported by SEFs, but does not include trade-level detail and does not cover non-US platforms such as OTFs / MTFs. SDRView, by contrast, includes non-US platforms, but caps trade notional above a block threshold and only includes trades where one party is a US financial firm. SEFView shows 100 percent of volumes on US SEFs but no other platforms, while SDRView shows a large fraction (around 50 percent) of volumes on all platforms. SDRView is a good guide to market volume dynamics over time, which we often blog about.
If you are interested in more on the trade caps, refer to our blog: We have new block sizes.
SEFView BGC volumes
Let’s start by connecting the prior blog with the present via SEFView day-by-day charts from January 2018 to December 2023. Note that each chart has a different vertical scale.
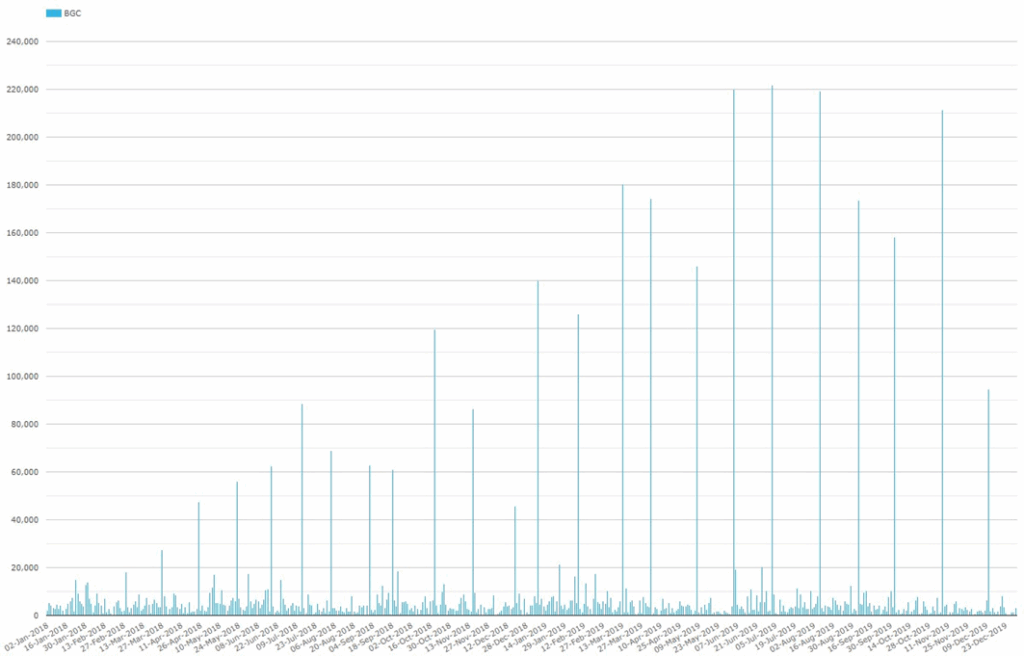
Chart 1a: Day-by-day BGC SEF G4 currency swaptions trades – 2018 and 2019 (notional $ billions)
Chart 1a shows the initial rise in BGC monthly spike days to above $200 billion, corresponding to Capitalab rates IM optimization runs as noted in the prior blog.
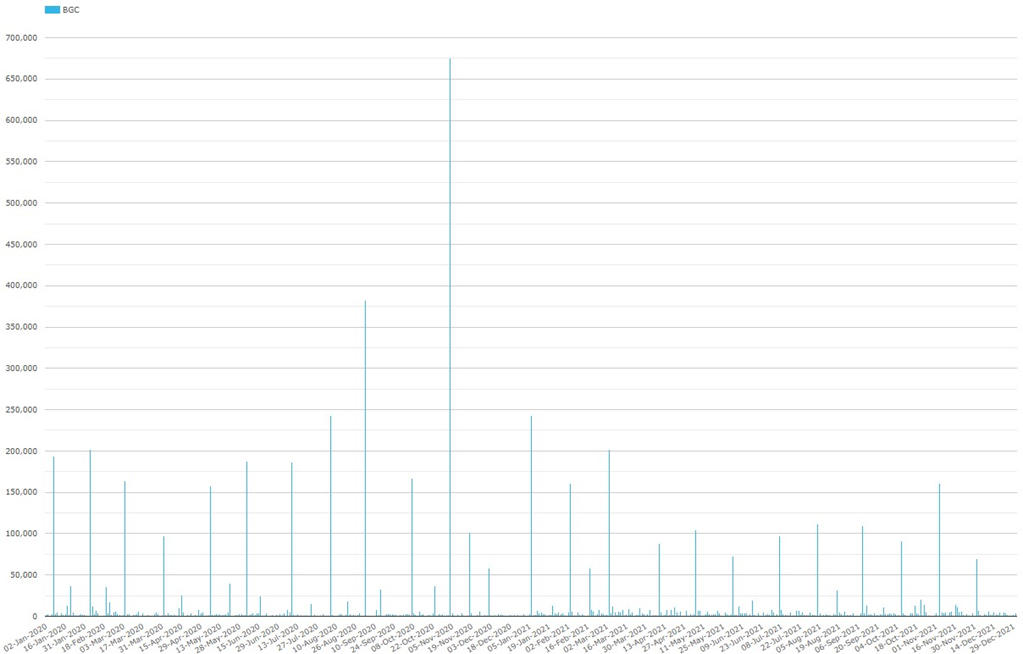
Chart 1b: Day-by-day BGC SEF G4 currency swaptions trades – 2020 and 2021 (notional $ billions)
Chart 1b shows monthly spike days, corresponding to Capitalab rates IM optimization runs, of around $200 billion through Q1 2021. After March 2021, spike days were around $100 billion. Standout spike days were $382 billion in September 2020 and $678 billion in November 2020.
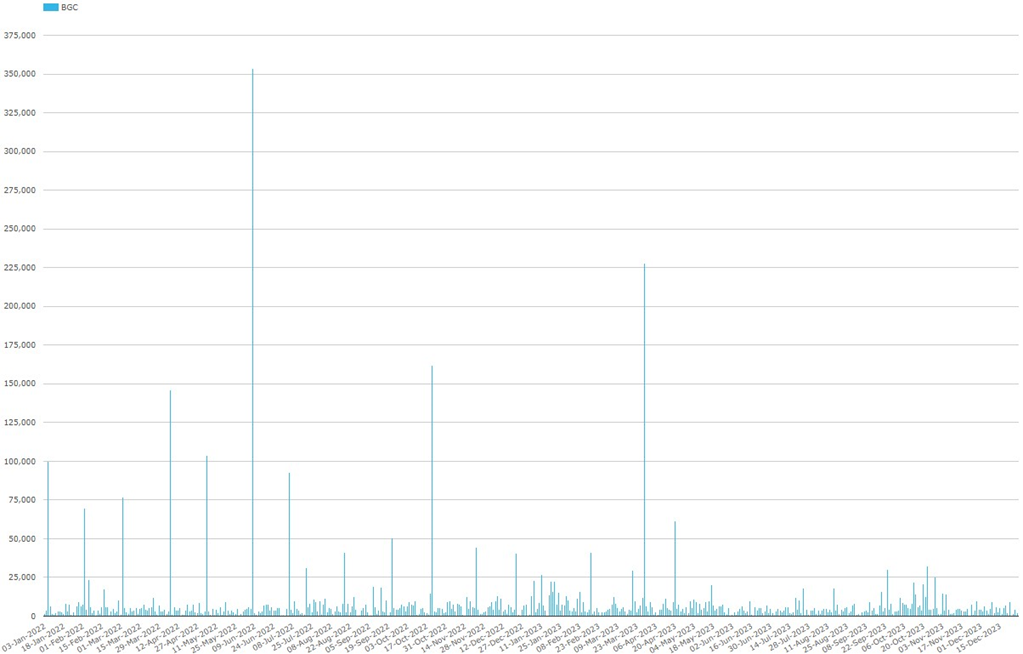
Chart 1c: Day-by-day BGC SEF G4 currency swaptions trades – 2022 and 2023 (notional $ billions)
Chart 1c shows that monthly spike days, corresponding to Capitalab rates IM optimization runs, continued at around $100 billion for the first half of 2022. After July 2022, spike days became more irregular and stopped altogether after April 2023. Standout spike days were $354 billion in June 2022 and $228 billion in March 2023.
Capitolis kindly confirmed that their rates IM optimization new swaptions execution transferred from BGC SEF to BGC OTF around April 2023 to enable non-SEF participants to join.
SDRView BGC volumes
Now, using platform ID, we chart new swaptions (excluding compression package type) on D2D platforms by individual SEF/OTF/MTF. If you scan your eyes across the next two charts, you will see that BGC New York SEF (BGCD in blue at the bottom of each daily stack) had material daily trading activity most days which only occasionally exceeded $10 billion. You will also see that BGC London OTF (BGCO in green, second to bottom of each daily stack) has smaller, more patchy daily trading activity than BGC SEF – but with more pronounced occasional spike days.
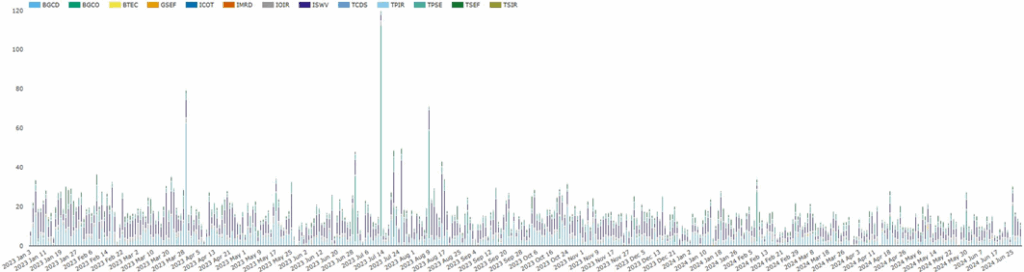
Chart 2a shows that:
- There were larger spike days in BGC OTF swaptions activity from April 2023 onwards – corresponding to Capitalab’s transfer of rates IM optimization run execution from BGC SEF to BGC OTF.
- There was a cluster of spike days around mid-2023, including $33 billion in June, $104 billion in July, and $55 billion in August after which the spike days stayed below $25 billion. Note that mid-2023 was the timing of USD-LIBOR cessation.
Capitolis kindly confirmed that the largest of these spike days corresponds to one of their LIBOR switches. Run occasionally, these convert LIBOR swaptions to SOFR swaptions by terminating and replacing via the same execution approach, via BGC and MarkitWire, as their rates IM optimization runs.
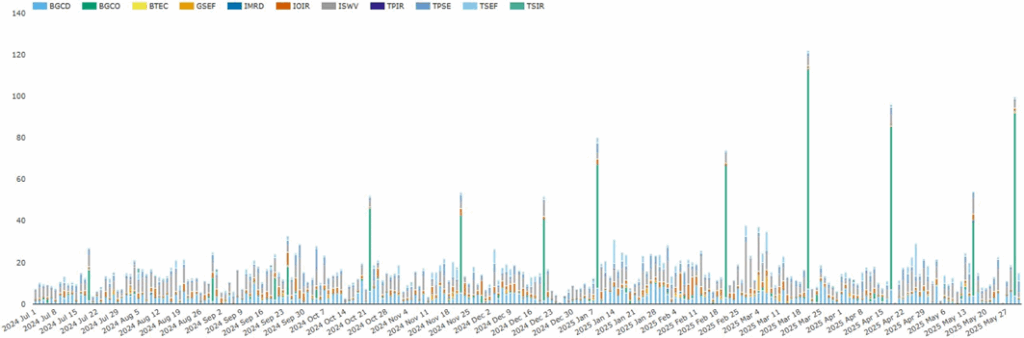
Chart 2b: Day-by-day D2D platform G4 currency swaptions trades by platform ID – July 2024 to May 2025 (notional $ billions)
Chart 2b shows that the monthly spike days stood out again from October 2024 onwards, with the largest being $105 billion in March 2025. Capitolis kindly confirmed rates optimization run participation increased with the acquisition, enabled by easier onboarding of participants in other Capitolis services.
As an aside, Capitolis noted that they perform quarterly swaption multilateral compression runs separately from their rates IM optimization runs. Multilateral compression is exempt from SDR reporting and thus absent from the data here. Instead, Capitolis publicly reports these via the TradEcho approved publication arrangement (APA).
Recap
The addition of platform ID to SDRView in late 2022 allowed us to use BGC swaption execution spike days to identify both Capitolis rates IM optimization runs and their occasional LIBOR swaption switches.
We can see that Capitalab’s rates IM optimization activity increased alongside the acquisition and rebranding by Capitolis in December 2024.
SDRView has trade-level detail (with parties anonymized and trades capped), which enables trade counts, notional, and DV01 to be analyzed by platform ID and platform type, by new trade vs. termination, by package type, by currency, by product type and subtype, and many more.
There is also more SDRView and CCPView data on multilateral IM optimization. Watch this space.
Please contact us if you are interested in a subscription.