- We take a look at Scandie swaps through the lens of our data products.
- SEK are the most traded currency, seeing an average daily volume of $19bn, and a monthly total of $290bn.
- SEK is the 7th largest cleared currency in IRS trading.
- The US persons market accounts for around 20% of volumes.
- There is virtually no OIS trading.
- We see no evidence that trading will move from the Scandinavian ‘IBOR indices anytime soon.
Cleared Volumes
We’ve never taken a look at Scandie swaps (Skandi? I’m sticking with Scandie for this blog). We did briefly take a look at NOK and SEK spreads last month following the Nasdaq default – but more as a thought experiment than any particularly interesting volumes.
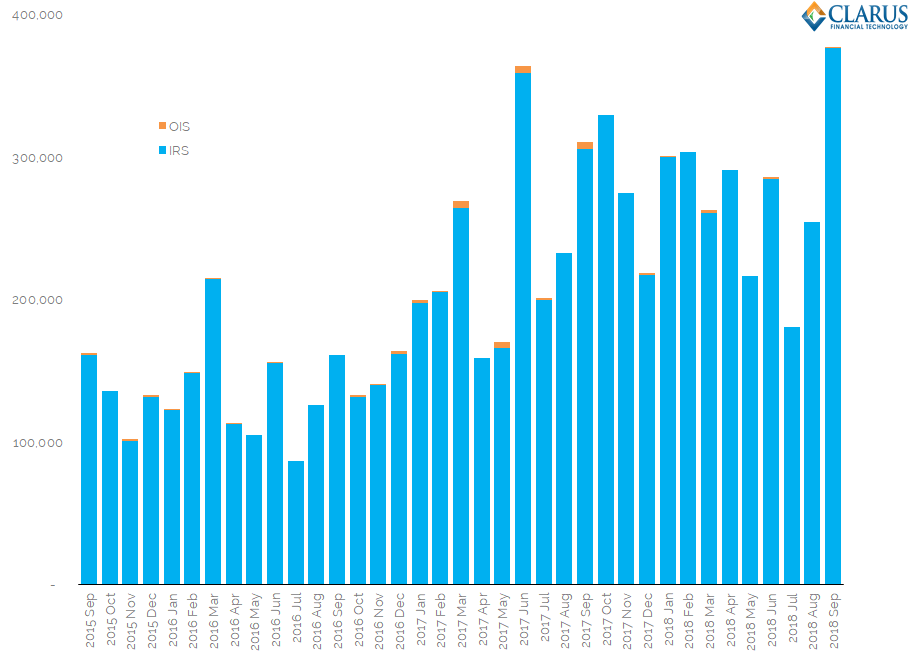
Let’s start with CCPView. This shows global cleared volumes in Interest Rate Swaps:
Showing;
- Monthly cleared volumes across SEK, NOK and DKK swaps.
- We’ve split the volumes by IRS and OIS. OIS is only just about visible. They hardly trade.
- Volumes in IRS have increased consistently for the past three years.
- September 2018 was a record month for cleared volumes, recording a monthly total of $377bn equivalent.
Currency Split
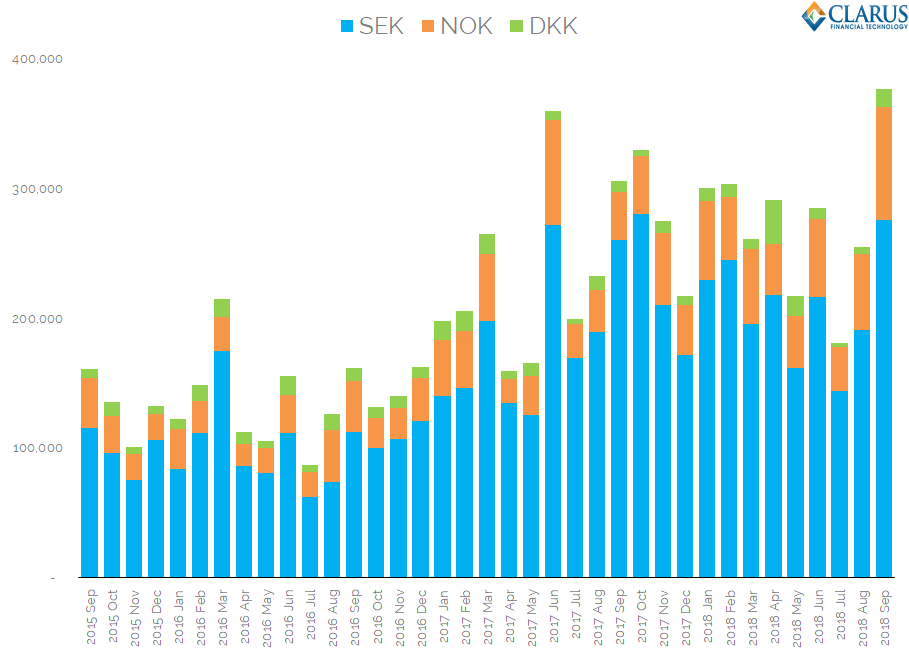
With volumes increasing in IRS but virtually no trading in OIS, what is the currency split amongst the three currencies?
Showing;
- SEK is easily the largest of the three currencies. It averages a share of Scandie volumes of 75%.
- NOK is the second largest. It averages 20% of volumes.
- DKK is far and away the smallest market. It makes up just 5% of Scandie volumes.
September 2018 saw record volumes in both SEK ($289bn equivalent) and NOK ($87bn equivalent) but DKK was well short of a record month (back in April 2018).
Perspective
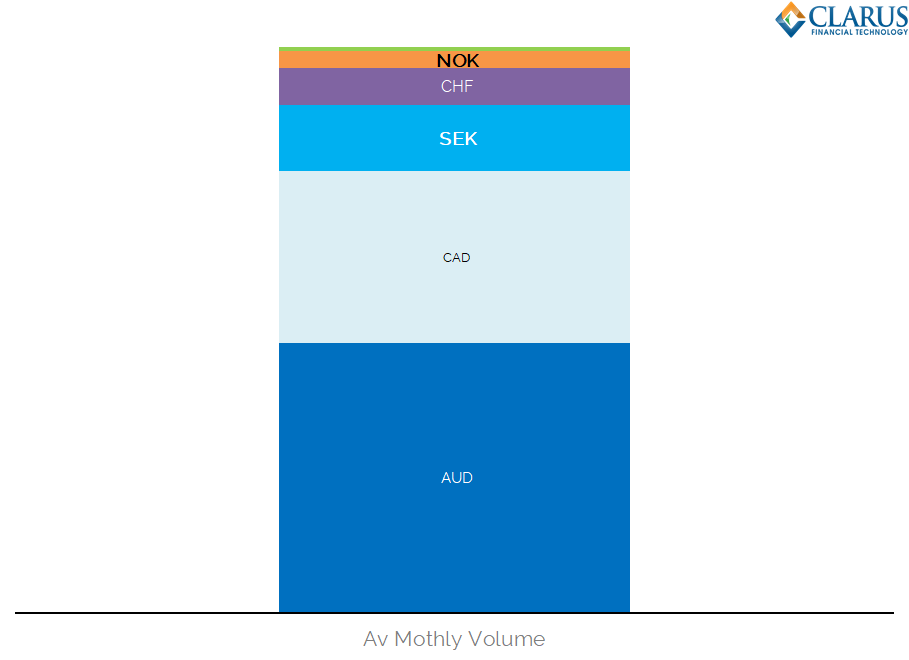
It is worth putting these volumes in perspective – let’s compare to what else trades across CCPs. We are not expecting Scandie swaps to trouble USD (or EUR) swaps for the largest currency award, but how do they compare to some other currencies?
Showing;
- SEK swaps volumes are larger than CHF volumes. That surprised me.
- AUD and CAD volumes are both significantly larger than Scandinavian currencies.
- Overall, it looks like SEK are the 7th most traded currency in cleared Interest Rate Swaps.
- Volumes then drop off significantly into NOK and DKK (the green sliver at the top of the chart).
US Persons trading Scandie Swaps
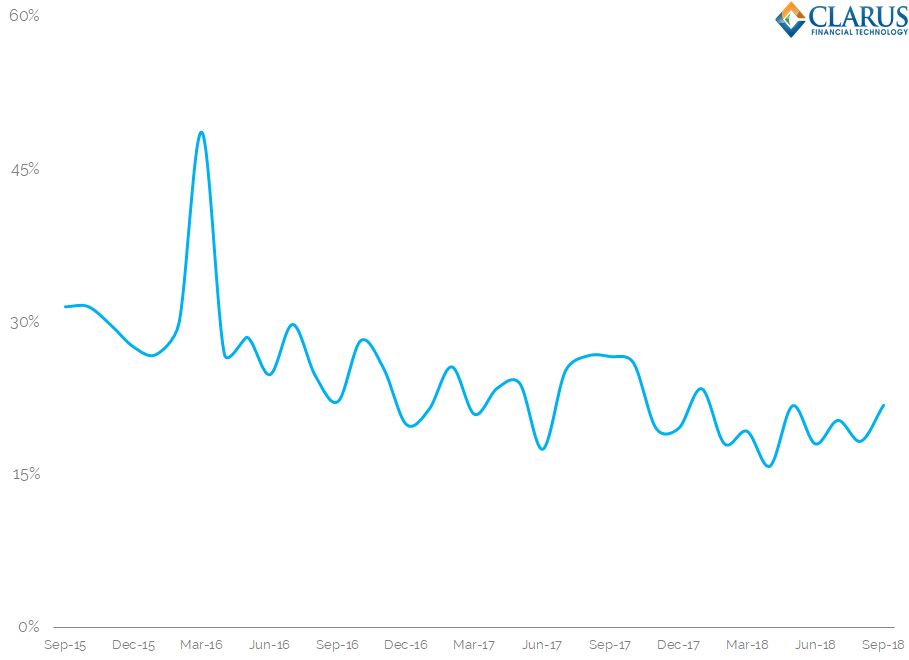
As well as looking at the global market from a high-level perspective, we can look at the US market at a trade-by-trade level thanks to SDRView. Calibrating our data, it is worth noting the percentage of the global Scandie market made up by America:
Showing;
- The ratio of CCPView cleared volumes to total volumes reported to SDRs across all Scandie IRS. This excludes OIS.
- Three years ago, the SDR data accounted for about 30% of the market.
- We have seen this gradually decline to stand at 20% in 2018.
- Is this related to more of the SDR market also being Cleared? I’m not sure why that would change things…
SEF Trading of Scandie Swaps
There is very little volume of Scandie swaps being transacted on-SEF:

Showing;
- Only 15% of trades reported to US SDRs have been transacted on a SEF in 2018.
- Scandie trading remains predominantly an off-SEF market, even amongst US persons.
- For that reason, we won’t take a look at the SEF market share – we don’t consider the SEF market to be representative of the overall market.
European Data
As we’ve seen, SDR data offers a window into 20% of the Scandie market. To see more trade-by-trade detail for the remaining 80% of the market, we turn our attention to European data provided through MIFID II transparency. We can see the following volumes from the Bloomberg APA and MTF, shedding light on a further $3bn per month of the market. 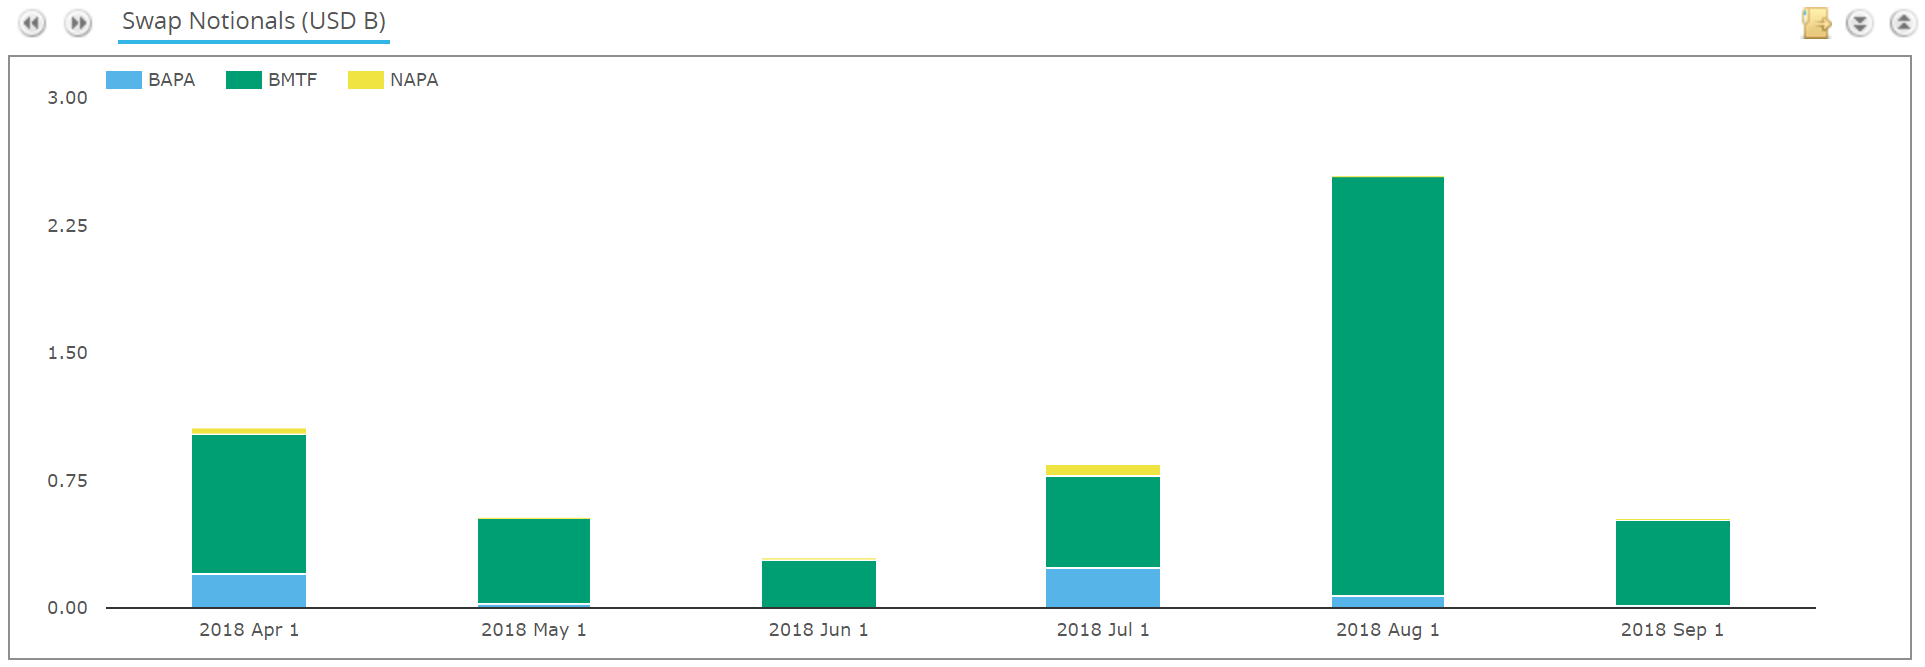
Outside of this, we have to wait for other APAs to enact the changes directed by ESMA. Yes, we are still waiting, six months after the guidance was published….
RFRs in Scandinavia
Having performed this rudimentary research into the Scandie markets, I am struck by a seeming lack of plans to shift away from ‘IBOR indices and towards OIS. This is in stark contrast to other major currencies, where Risk Free Rates are trading more and more.
It is notable that almost no OIS trades in Scandinavia. Why is that? Is unsecured interbank lending still alive and well and occurring in decent volumes at longer tenors in Scandinavia? The banks certainly have a reputation for being well capitalised.
It is worth reading about NIBOR and STIBOR as they appear to have very strict codes. Will this prevent these markets embracing OIS trading, even as other currencies see liquidity move?
What could a cross-currency swap look like in the future?
NIBOR vs SOFR? STIBOR vs SONIA?
It seems odd to trade longer dated, credit-related indices in one currency vs an overnight rate in the other. How would you roll the funding in FX markets for that structure? Three-month plus a three-month OIS in the major currency? One to ponder as market reform gathers pace.
In Summary
- Scandie swaps trade upwards of $375bn each month.
- SEK are the most active swaps, and are the 7th most traded currency overall.
- Almost all swaps are cleared, but the SEF market is pretty inactive.
- OIS hardly trades across the Scandie currencies.